
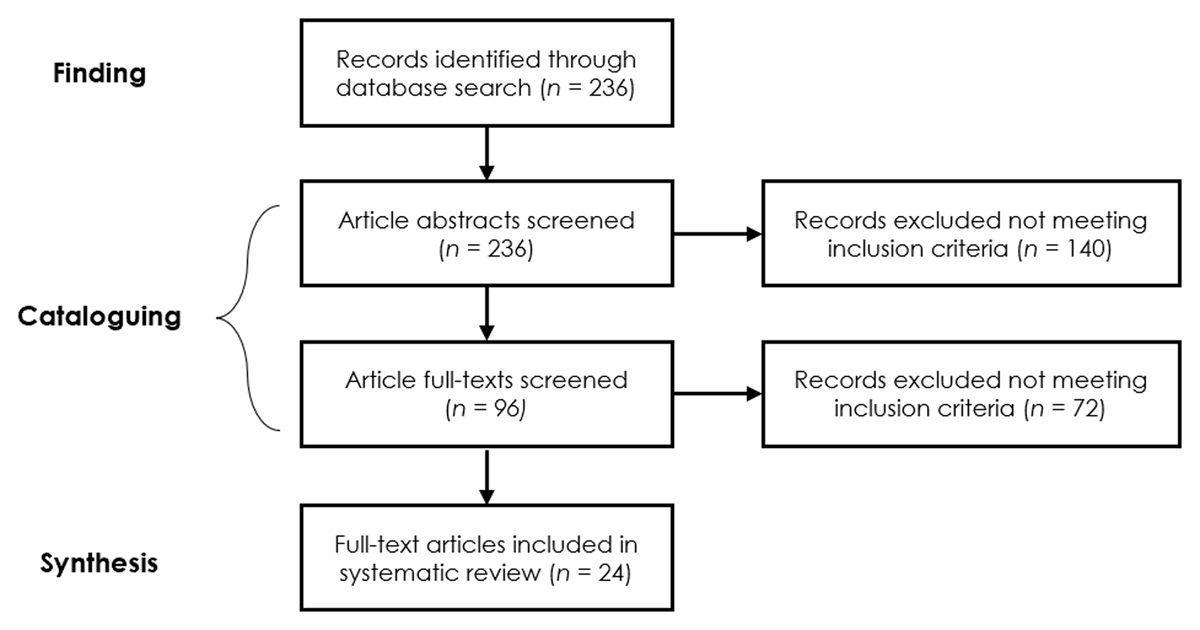
Figure 1
PRISMA diagram of SLR procedures.
Table 1
Summary of the composition of the final sample of selected articles.
| PRIMARY DATA-DRIVEN METHOD | NUMBER OF ARTICLES | % SAMPLE |
|---|---|---|
| Cluster Analysis | 13 | 54.2% |
| Decision Tree Methods | 4 | 16.6% |
| PCA | 2 | 8.3% |
| Hidden-Markov Chain | 2 | 8.3% |
| Naïve Bayes | 1 | 4.2% |
| Topic Modeling | 1 | 4.2% |
| Model Comparison | 1 | 4.2% |
| Total | 24 |
Table 2
Summary of person and variable-centeredness found in the sample.
| METHOD | PERSON-CENTEREDNESS | VARIABLE-CENTEREDNESS |
|---|---|---|
| Cluster Analysis |
|
|
| Decision Tree(s) |
|
|
| Principal Component Analysis |
| |
| Bayesian Techniques |
|
|
| Topic Modeling |
|
Table 3
Summary of cluster analysis applications in sample (n = 13).
| ARTICLE | CLUSTERING ALGORITHM |
|---|---|
| Faber & Benson (2017) | k-means |
| Scheid et al. (2021) | Gaussian Mixture Model |
| Marbouti et al. (2021) | Bisecting k-means |
| Jaiswal et al. (2021) | Hierarchical clustering |
| Martin et al. (2015) | Two-step clustering (not specified) |
| Yellamraju et al. (2019) | n-TARP clustering |
| Ruipérez-Valiente et al. (2017) | Two-step clustering (not specified) |
| Reid et al. (2016) | McDermott’s three-stage cluster analysis |
| Cakir & Gheorghe (2017) | Two-step clustering (hierarchical -> expectation maximization) |
| S. Haase (2014) | Nearest centroid |
| Nelson et al. (2015) | Two-step clustering (not specified) |
| Gallego et al. (2016) | Hierarchical clustering |
| Choe & Borrego (2020) | Two-step clustering (k-means variant -> modified hierarchical) |