
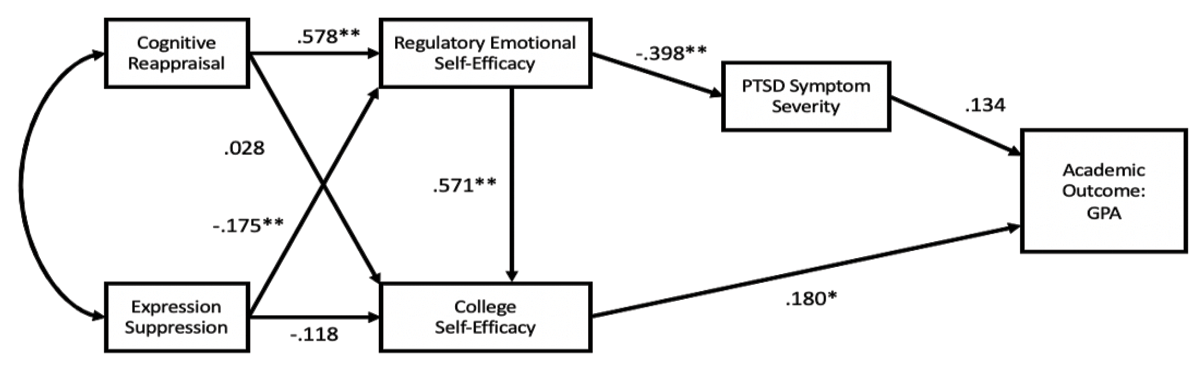
Figure 1
Original Path Model.
Note: Correlates include emotion regulation strategies, regulatory emotional and college self-efficacy, PTSD symptom severity, and cumulative GPA. * p < .05, ** p < .01.
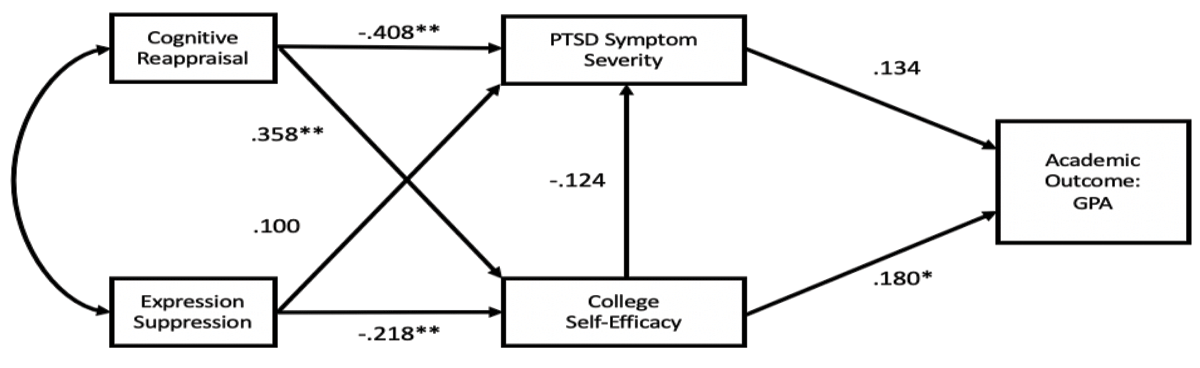
Figure 2
College Self-Efficacy (CSE) Path Model.
Note: Correlates include emotion regulation strategies, PTSD symptom severity, regulatory emotional self-efficacy, and cumulative GPA. * p < .05, ** p < .01.
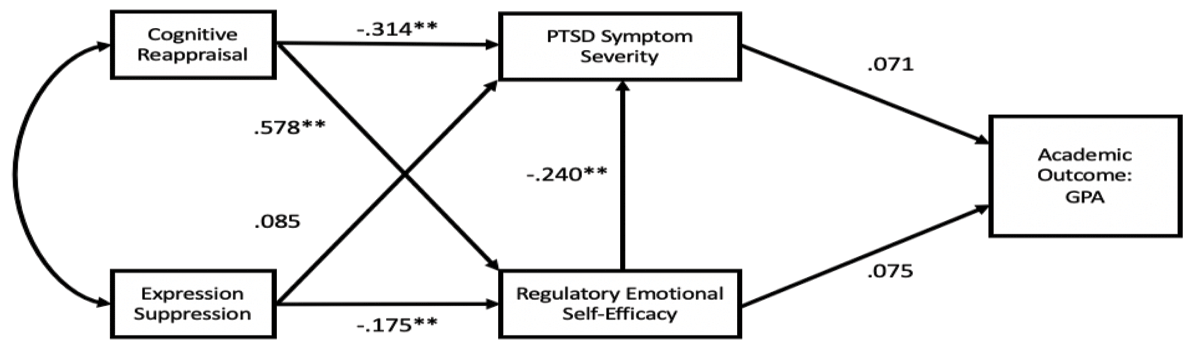
Figure 3
Regulatory Emotional Self-Efficacy (RESE) Path Model.
Note: Correlates include emotion regulation strategies, PTSD symptom severity, college self-efficacy, and cumulative GPA. * p < .05, ** p < .01.
Table 1
Frequencies and Percentages for Sample Demographic Variables.
| DEMOGRAPHIC VARIABLE | n | % |
|---|---|---|
| GENDER | ||
| Male | 315 | 76.5 |
| Female | 97 | 23.5 |
| RACE/ETHNICITY | ||
| Caucasian/White | 364 | 88.3 |
| Hispanic/Latino/Spanish | 186 | 45.1 |
| African American/Black | 32 | 7.8 |
| American Indian or Native American | 10 | 2.4 |
| Asian | 2 | 0.5 |
| Native Hawaiian/Pacific Islander | 1 | 0.2 |
| Other | 6 | 1.5 |
| AGE | ||
| 20 – 29 | 211 | 51.2 |
| 30 – 39 | 158 | 38.3 |
| 40 – 49 | 40 | 9.7 |
| 50 – 59 | 1 | 0.2 |
| 60 – 69 | 2 | 0.5 |
| MILITARY BRANCH | ||
| Army | 212 | 51.5 |
| Air Force | 89 | 21.6 |
| Navy | 46 | 11.2 |
| Marine Corps | 31 | 7.5 |
| National Guard | 15 | 3.6 |
| Coast Guard | 10 | 2.4 |
| Reserve | 9 | 2.2 |
| SELF-REPORTED CUMULATIVE GPA | ||
| 3.70 – 4.00 | 112 | 27.2 |
| 2.70 – 3.69 | 176 | 42.7 |
| 1.70 – 2.69 | 7 | 1.7 |
| 1.69 and below | 3 | 0.7 |
Table 2
Correlations and Multiple Regressions.
| CORRELATIONS, MEANS, AND STANDARD DEVIATIONS | ||||||
|---|---|---|---|---|---|---|
| VARIABLE | 1 | 2 | 3 | 4 | 5 | 6 |
| 1. GPA | – | |||||
| 2. PCL | –.04 | – | ||||
| 3. CSEI | .10 | –.21** | – | |||
| 4. RESES | .04 | –.39** | .55** | – | ||
| 5. CR | .15* | –.35** | .17** | .51** | – | |
| 6. ES | .02 | .01 | –.15** | .07 | .33** | – |
| M | 3.48 | 34.96 | 50.25 | 35.75 | 26.27 | 16.61 |
| SD | 0.43 | 15.81 | 10.72 | 8.24 | 6.33 | 4.36 |
[i] Note: GPA= Cumulative Grade Point Average, PCL = PTSD Check-List, CSEI = College Self-Efficacy Inventory, RESES = Regulatory Self-Efficacy Scale, CR = Cognitive Reappraisal, ES = Expression Suppression. * p < .05; ** p < .01.
Table 3
One-way Analysis of Variance of PTSD Symptom Severity by Gender.
| SOURCE | df | SS | MS | F | p |
|---|---|---|---|---|---|
| Between Groups | 1 | 2202.026 | 2201.026 | 8.988 | .003* |
| Within Groups | 385 | 94326.227 | 245.003 | ||
| Total | 386 | 96528.253 | |||
| ONE-WAY ANALYSIS OF VARIANCE OF CUMULATIVE GPA BY GENDER | |||||
| SOURCE | df | SS | MS | F | p |
| Between Groups | 1 | .093 | .093 | .493 | .483 |
| Within Groups | 294 | 55.167 | .188 | ||
| Total | 295 | 55.259 | |||
[i] Note: * p < .05.
Table 4
Goodness of Fit Comparison: Path Models Predicting Academic Outcomes.
| MODEL | X2 | df | CFI | RMSEA |
|---|---|---|---|---|
| Original Model | 24.34* | 6 | .90 | .13 |
| RESE Model | 11.20* | 2 | .92 | .16 |
| CSE Model | 07.33* | 2 | .92 | .12 |
[i] Note: RESE = Regulatory Self-Efficacy, CSE = College Self-Efficacy. * p < .05.

Figure 4
Direct Effect: Cumulative GPA on Cognitive Reappraisal.
The coefficient presented for the prediction of cumulative GPA is a beta weight/path regression coefficient. Note: * p < .05.
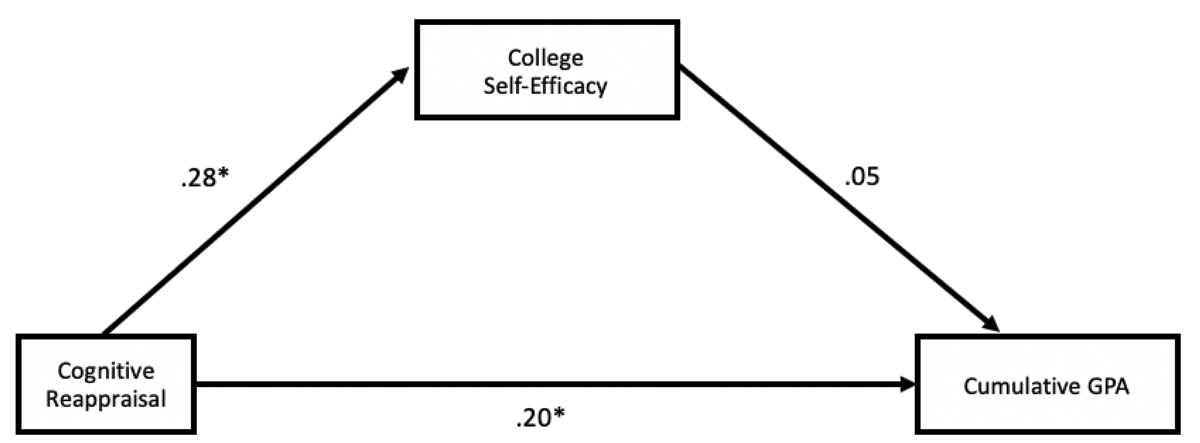
Figure 5
College Self-Efficacy Mediation Model Predicting GPA.
Note: * p < .05.
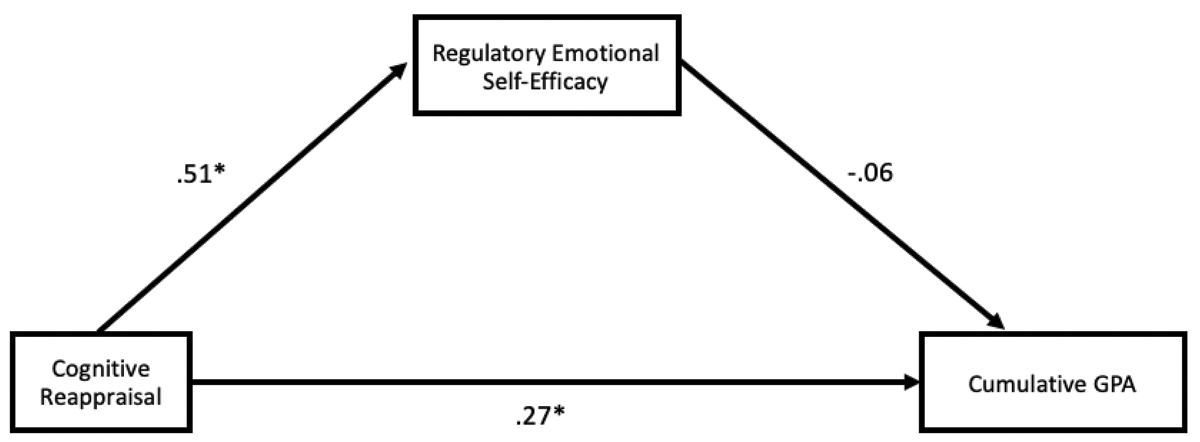
Figure 6
Regulatory Emotional Self-Efficacy Mediation Model Predicting GPA.
Note: * p < .05.

Figure 7
Direct Effect: PTSD Severity on Cognitive Reappraisal.
Note: * p < .05.
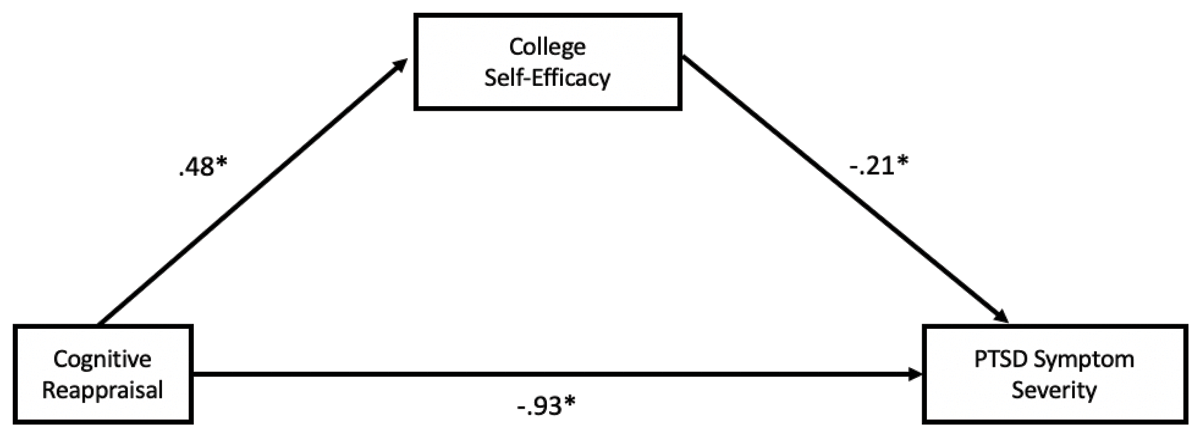
Figure 8
College Self-Efficacy Mediation Model Predicting PTSD Severity.
Note: * p < .05.
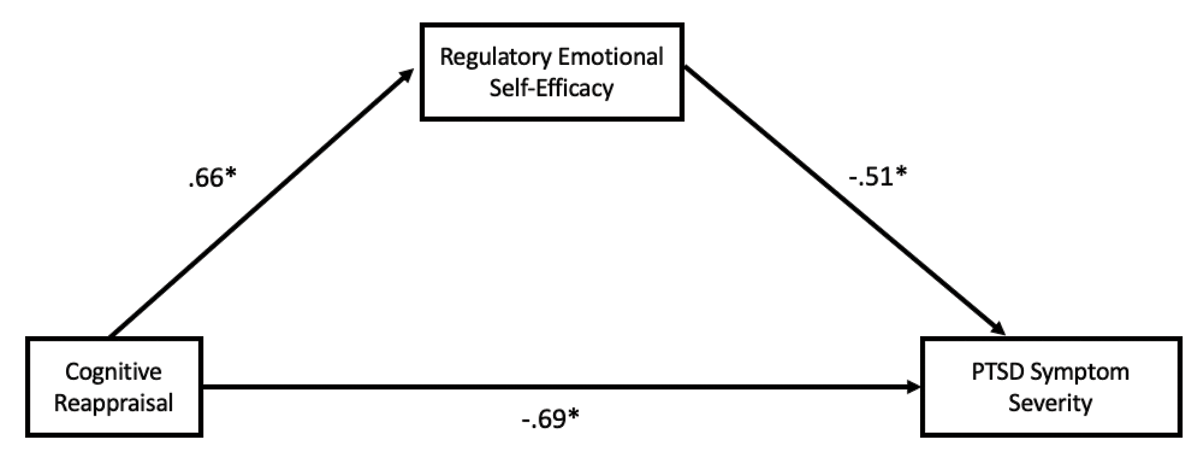
Figure 9
Regulatory Emotional Self-Efficacy Mediation Model Predicting PTSD Severity.
Note: * p < .05.