
Mike Baumann, a student at DePaul University, felt a bit out of place. Baumann served in the United States Army for six years and enrolled as an undergraduate at age 32. In an interview with the Chicago Tribune, he commented that he was “[d]efinitely not living the life they are,” referring to his undergraduate colleagues (Thayer, 2019). Indeed, veterans and military students come to college with experiences different from those of most other students. Experiences in the military can build confidence and self-reliance (Livingston et al., 2011) but can also contribute to a weaker sense of belonging and perception of support from civilian students and faculty members (Barry et al., 2014; Elliott, 2015). In this study, we explored how students with military experience, such as Baumann, may differ from those without such experience in terms of academic achievement and learning mindset, and how these differences may be associated.
The National Center for Education Statistics estimates that over 1.1 million students who are veterans or active-duty military personnel were enrolled as undergraduates in postsecondary institutions in the 2015–2016 academic year (Holian & Adam, 2020), which accounted for 6.1% of the U.S. undergraduate population. Approximately three-quarters of these students were veterans, with the remaining quarter being either active-duty or in the reserves. Financial aid programs, including the G.I. Bill for veterans, a range of state-level educational benefits for veterans, and Department of Defense funds for active military personnel, support Student Service Members/Veterans (SSM/V; Cook & Kim, 2009). Specialized programs at many colleges and universities also support SSM/V (McBain et al., 2012).
Given the large number of SSM/V, it is not surprising that a substantial body of research exists identifying variables that are associated with their academic achievement. Durdella and Kim (2012) found that demographic characteristics such as ethnicity, gender, parents’ income, and engagement in certain campus activities are associated with SSM/V grade point averages (GPA). Semer and Harmening (2015) identified broadly similar factors associated with the GPAs of SSM/V, with somewhat different specifications in observing these factors. Elliott (2015) demonstrated that SSM/V with post-traumatic stress disorder (PTSD) and depression reported a more-negative campus experience. Norman et al. (2015) and Schonfeld et al. (2015) showed that SSM/V with PTSD experienced greater difficulty in integrating into the campus community, while Williston and Roemer (2017) found that SSM/V with a greater ability to emotionally regulate reported higher levels of academic engagement. The ease of receiving military-connected financial aid benefits also correlates with academic outcomes. Southwell et al. (2018) demonstrated that SSM/V who had easier experiences determining their financial eligibility earned higher GPAs than those SSM/V who experienced difficulty in determining their eligibility, while Barr (2019) found that the general availability of financial aid was positively associated with the degree attainment of SSM/V. In addition, Elliott (2015) found that SSM/V who felt socially supported on campus reported more-positive campus experiences, while Southwell et al. (2018) demonstrated that SSM/V who felt more academically prepared earned higher GPAs.
Learning Mindset
As demographic characteristics, academic services, efficient receipt of benefits, social support, and mental health are associated with better outcomes for SSM/V, so might a student’s learning mindset. In their meta-analysis of academic mindset research, Lazowski and Hulleman (2016) identified 16 motivational theories relevant to student achievement. Consistent with the community college survey data set used in our research, we focused on four commonly studied motivational theories included in Lazowski and Hulleman’s (2016) meta-analysis: self-efficacy, growth mindset, relevance, and sense of belonging. According to Lazowski and Hulleman (2016), self-efficacy “[h]elp(s) students perceive that they can successfully complete the specific tasks and activities required for learning, such as setting and achieving realistic study goals” (p. 610). Growth mindset, also referred to as implicit theories of intelligence, “[h]elp(s) students realize that we can become smarter by tackling challenges” (p. 608). Relevance, also known as expectancy-value, “[h]elp(s) students discover the relevance of academic material to their lives” (p. 607). Moreover, a sense of belonging, or social belongingness, “[h]elp(s) students perceive stronger connections between themselves and important others in the learning context” (p. 610). These motivational constructs are also echoed in research outside of higher education. The William and Flora Hewlett Foundation added “develop academic mindsets” to its deeper learning framework as an important K–16 competency (William and Flora Hewlett Foundation Education Program, 2013).
The consensus of the extensive literature on learning mindset is that students with a more-positive learning mindset tend to interpret setbacks as the norm and respond with persistence towards goals, with actions predicated on the belief that improvement is possible. Students with a less-positive learning mindset, however, tend to see setbacks as proof of their own inadequacy, responding in ways that do not further academic success (Yeager et al., 2014). A wealth of research attests to the robustness of the association between mindset and academic success. For example, Robbins et al. (2004) identified 109 studies that included self-efficacy among college students as a predictor of academic success. Self-efficacy was associated with both retention and GPA. Costa and Faria (2018) utilized 46 studies in which growth-mindset and fixed-mindset beliefs were assessed among students ranging from middle school through college. Students with growth-mindset beliefs received higher grades on average in some subjects than students with fixed-mindset beliefs. Han et al. (2017) assessed both self-efficacy and sense of belonging—along with academic motivation—among 1,400 first-year students from a large public university. Students who were higher in these mindset attributes exhibited higher GPAs and higher second-year retention rates. Shirley et al. (2022) found that emotion regulation and academic self-efficacy significantly predicted college GPA in a sample of over 400 student veterans. Moreover, Destin et al. (2019) found that ninth-grade students with a fixed mindset earned lower grades than those with a growth mindset. Other research has shown that aspects of mindset also correlate with pride in the academic institution (Jones & Bell, 2025) and student race (Fong et al., 2025), among a host of other factors (Boulton, 2023).
Other research has used randomized-controlled trials to study the effects of academic mindset interventions on academic performance. For example, Lazowski and Hulleman (2016) conducted a meta-analysis of 74 intervention studies that linked motivation theory to academic outcomes. Across a wide range of sample characteristics, including various demographic groups and various education levels, they found that mindset interventions were generally effective in improving academic outcomes. Lavecchia et al. (2016) surveyed studies that examined various behavioral effects influencing students’ decisions to invest in education. They defined one category of interventions as ones “[t]hat strengthen positive identities” (p. 55). Most of the roughly one dozen studies in this category report on experimental interventions designed to strengthen aspects of academic mindset and examine their impact on academic outcomes.
The Learning Mindset of SSM/V
Research has demonstrated ways in which SSM/V hold a less-positive sense of belonging than do their civilian peers. For example, Whiteman et al. (2013) found that SSM/V reported less emotional support from fellow students, Wheeler (2012) found that SSM/V case-study participants largely felt that it was a struggle to relate to their peers, while Livingston et al. (2011) stated participants felt as though they were invisible members of the campus community. Using a survey of University of California system undergraduates, Durdella and Kim (2012) found that veterans had less-positive senses of belonging, controlling for demographic characteristics, campus engagement, and academic major. To our knowledge, no research to date has demonstrated how SSM/V compare with civilian students in terms of self-efficacy, growth, or relevance, the other aspects of learning mindset on which this research is focused.
Purpose and Research Questions
Although the literature attesting to a link between learning mindset and academic outcomes is robust, a study explicitly linking learning mindset and academic outcomes, such as GPA for SSM/V, does not, to our knowledge, appear in the literature.1 Given the importance of educational benefits to recruitment in the United States’ all-volunteer armed forces and given the significant public funding devoted to SSM/V educational benefits, a better understanding of the association between mindset and academic success among SSM/V is important.
In this study, we used a large survey data set of community-college students to address the following research questions: (1) Do SSM/V have a different self-reported learning mindset than civilian students, controlling for demographic background? (2) Controlling for level of learning mindset and demographic background, do SSM/V have a different self-reported GPA than civilian students? (3) Are institutional characteristics, such as the number of students and the fraction of students who are SSM/V, associated with mindset and GPA? (4) Do unobservable characteristics of institutions affect our results; are there school-level fixed effects? (5) Are the effects of mindset and institutional characteristics moderated by SSM/V status?
Method
Data
We used data collected by The Center for Community College Student Engagement (CCSSE), also known as the Center, at The University of Texas at Austin. The Center conducts an annual survey of student engagement at participating colleges nationwide. CCSSE was entirely a classroom-administered, paper-and-pencil survey until 2020; subsequently, an online option for its administration became available. In 2018, participating colleges administered the paper-and-pencil survey to students in randomly selected courses between early February and mid-May.2 Overall, 130,617 usable surveys were completed from 250 colleges (approximately 26% of all public and private, not-for-profit 2-year colleges in the U.S.) across 36 states.3 This data set is far larger and more representative of SSM/V presence in higher education, given its focus on community college, than any we have seen in the literature on SSM/V achievement in higher education.
Mindset and Military Variables in CCSSE
Along with its usual questions, the Center typically creates additional measures on special topics for each administration. The 2018 administration included a 5-item questionnaire regarding mindset, with focus on the following facets of learning mindset: sense of belonging, self-efficacy, relevance of academic experience, and growth mindset (CCCSE, 2019, p. 3).4 The questions, as indicated in the 2018 CCSSE codebook with relevant mindset facet, were as follows:
Social Belonging: I feel welcome and respected at this college.
Relevance: This college is preparing me for what I plan to do in life.
Self-efficiency: I can learn all of the material being presented in my courses this academic term.
Social Belonging: I have good relationships with others at this college.
Growth: I can become more intelligent by working hard on my studies.
There are many variables associated with an academic mindset. The Center’s choice to include these particular four variables is consistent with the research of Farrington et al. (2012), who identified them as four primary indicators of an overall academic mindset that predicts long-term flourishing. Furthermore, a host of research (Bayer et al., 2020; Freeman et al., 2007; Han et al., 2017; Kattoum & Baillie, 2025) has found at least subsets of these four variables to be strongly correlated and, in some cases, has treated them as indicators of a latent factor of general mindset. Although we make no argument that social belonging, relevance, self-efficacy, and growth are the four best indicators of a general academic mindset, prior theorizing and research suggest that they may at least be considered as a subset of valid indicators of such a global construct.
CCSSE asks directly about veteran and military status with a question about whether “the student is a current or former member of the Armed Services, National Guard, or Reserves.” In our sample, 5.2% of the students reported being veterans or active military. This percentage is similar to the 6% of the undergraduate population who are SSM/V as reported by Holian and Adam (2020). Because the single question asked respondents if they were “current or former” members of the military, veterans and active military personnel cannot be distinguished from each other in the CCSSE data. Table 1 provides data on the demographic characteristics of students included in this analysis, for the full sample and in sub-categories of civilians and SSM/V.
Table 1
Descriptive Statistics by Military Status and for the Overall Sample.
| CIVILIAN | SSM/V | ALL-SAMPLE | |||||
|---|---|---|---|---|---|---|---|
| mean | mean | mean | SD | min | max | n | |
| GPA | 3.07 | 3.18 | 3.08 | 0.76 | 1 | 4 | 121580 |
| Mindset | 21.56 | 21.46 | 21.55 | 2.94 | 5 | 25 | 121777 |
| SSM/V status | 0 | 1 | 0.05 | 0.22 | 0 | 1 | 126816 |
| Father college enroll | 0.42 | 0.38 | 0.41 | 0.49 | 0 | 1 | 130613 |
| Mother college enroll | 0.54 | 0.47 | 0.52 | 0.50 | 0 | 1 | 130614 |
| School enrollment in 1000s | 9.03 | 9.08 | 9.07 | 9.24 | 0.08 | 57.03 | 130617 |
| % Funded by military | 0.03 | 0.05 | 0.04 | 0.05 | 0 | 0.27 | 130617 |
| Gender (man) | 0.42 | 0.71 | 0.43 | 0.50 | 0 | 1 | 127207 |
| Gender (woman) | 0.56 | 0.25 | 0.55 | 0.50 | 0 | 1 | 127207 |
| Gender (other) | 0.01 | 0.01 | 0.01 | 0.08 | 0 | 1 | 127207 |
| Gender (no response) | 0.01 | 0.02 | 0.01 | 0.12 | 0 | 1 | 127207 |
| Age (18–19) | 0.35 | 0.07 | 0.33 | 0.47 | 0 | 1 | 127310 |
| Age (20–21) | 0.26 | 0.10 | 0.25 | 0.43 | 0 | 1 | 127310 |
| Age (22–24) | 0.14 | 0.15 | 0.14 | 0.34 | 0 | 1 | 127310 |
| Age (25–29) | 0.11 | 0.24 | 0.11 | 0.32 | 0 | 1 | 127310 |
| Age (30–39) | 0.09 | 0.25 | 0.1 | 0.3 | 0 | 1 | 127310 |
| Age (40–49) | 0.04 | 0.12 | 0.04 | 0.2 | 0 | 1 | 127310 |
| Age (50–64) | 0.02 | 0.07 | 0.02 | 0.15 | 0 | 1 | 127310 |
| Age (65+) | 0.00 | 0.02 | 0.00 | 0.06 | 0 | 1 | 127310 |
| Race/eth (Native American) | 0.02 | 0.02 | 0.02 | 0.14 | 0 | 1 | 127053 |
| Race/eth (Asian) | 0.06 | 0.05 | 0.06 | 0.23 | 0 | 1 | 127053 |
| Race/eth (Black) | 0.12 | 0.14 | 0.12 | 0.32 | 0 | 1 | 127053 |
| Race/eth (Latino) | 0.18 | 0.12 | 0.18 | 0.38 | 0 | 1 | 127053 |
| Race/eth (Native Hawaiian) | 0.00 | 0.00 | 0.00 | 0.04 | 0 | 1 | 127053 |
| Race/eth (Pacific Islander) | 0.00 | 0.01 | 0.00 | 0.06 | 0 | 1 | 127053 |
| Race/eth (White) | 0.48 | 0.50 | 0.48 | 0.50 | 0 | 1 | 127053 |
| Race/eth (other) | 0.02 | 0.03 | 0.02 | 0.13 | 0 | 1 | 127053 |
| Race/eth (2 or more) | 0.09 | 0.09 | 0.09 | 0.29 | 0 | 1 | 127053 |
| Race/eth (no response) | 0.03 | 0.05 | 0.03 | 0.18 | 0 | 1 | 127053 |
| Observations | 120230 | 6586 | |||||
Data Management
Our operationalization of mindset is the sum of the five learning mindset items previously described. To ensure that these items assessed a single global-mindset construct, an exploratory factor analysis using varimax rotation was conducted. A single factor emerged, with loadings between 0.67 and 0.76, supporting the decision to create a composite analysis variable. This decision was further supported by a Cronbach’s alpha of (α = 0.76). The learning mindset index was thus created by summing the values of the five items, which had a range of 1 to 5, giving the index a range of 5 to 25. If a response to any of the five questions was missing, then the sum was coded as missing. We use the terms “more-positive” and “less-positive” mindset to refer to respondents’ relative scores on this composite variable.
The identification of survey responses with the respondent’s institution presents an opportunity to consider how characteristics of schools may be associated with mindset. To facilitate these analyses, institutional characteristic data were downloaded from the Integrated Postsecondary Education Data System (IPEDS) and merged with the survey data prior to the release of the data set to the researchers. To maintain the confidentiality of the institutions attended by students and prevent the identification of these institutions, random identifiers were assigned to each.
Analysis Strategy
To address the first two research questions, multiple-regression models were conducted for two dependent variables: the learning mindset index and the self-reported college GPA. Variables used in these models included student status as a current or former member of the U.S. Armed Forces, Reserves, or National Guard, and, for the model with GPA as the dependent variable, the mindset composite variable.
Covariates included age, gender, parental college attendance, and race and ethnicity. Survey respondents could select one of eight age categories: 18–19, 20–21, 22–24, 25–29, 30–39, 40–49, 50–64, and 65 and above. Dummy variables were included for each category, with 18–19 being the excluded base age range. Three dummy variables were included for gender: woman, other, and prefer not to respond, with man being the excluded base category. College attendance for father and mother were captured separately, with dummy variables equal to 1 if the relevant parent had some college attendance. Race and ethnicity were characterized in the survey by ten categories: Native American, Asian, Black, Latino, Native Hawaiian, Pacific Islander, White, other, two or more, and prefer not to respond. We included a dummy variable for each category, excluding White as the base category.
Results
Descriptive Statistics
Table 1 presents descriptive statistics for the entire sample (N = 130,617) as well as for the civilian (n = 120,230) and SSM/V (n = 6,586) subsamples. SSM/V comprised 5.19% of the sample. Respondents aged 18–21 comprised 58% of the sample, while 16% of students were 30 or older. Only 17% of SSM/V students were aged 18–21, while 61% of civilian students fell within that age range. In the whole sample, 43% of respondents were men; 42% of the civilians were men, while a considerably higher 71% of the SSM/V students were men. Forty-one percent of students’ fathers and 52% of students’ mothers had at least some college education; these percentages are 42% and 53% for fathers and mothers of civilian parents, respectively, and somewhat lower, at 38% and 41% for fathers and mothers of SSM/V parents, respectively. Most categories of the race and ethnicity variables differed by only one or two percentage points between civilians and SSM/V students, except for Latino students, with 18% of civilians identified as Latino, while only 12% of SSM/V respondents identified as Latino.
Main Effects
Military status (0 = civilian, 1 = SSM/V) and demographic controls for age, gender, race-ethnicity, and parents’ college attendance were entered into a regression analysis predicting the composite-mindset variable. Most importantly, as indicated in Equation 1 of Table 2, military status was negatively associated with mindset (b = –0.27, p < .001), such that current and former members of the military demonstrated less-positive mindset than did students without military experience. The mindset variable was constructed by adding the five mindset questions, each of which is scored on a scale of 1 to 5. Observations with missing values for any of the five questions were deleted from the dataset. The composite item, therefore, ranged from 5 to 25. On this scale, the mean value was (M = 21.56) for civilians and (M = 21.46) for SSM/V. This is a difference of one-tenth of one point on the 5 to 25 scale. Thus, while this difference is statistically significant, it is quite small. With demographic variables held constant, the regression analysis indicates a slightly larger association between military status and mindset of about one-quarter of a point (b = –0.27). This indicates that, on average, accounting for demographic factors, mindset is lower by about one-quarter of one point on the 5- to 25-point scale.
Table 2
Regressions for Mindset and GPA.
| MINDSET | GPA | |||||
|---|---|---|---|---|---|---|
| ESTIMATE | SE | BETA | ESTIMATE | SE | BETA | |
| SSM/V status | –0.27*** | (0.05) | –0.020 | 0.051*** | (0.01) | 0.015 |
| Mindset | 0.049*** | 0.188 | ||||
| Father college enroll | 0.036 | (0.03) | 0.006 | 0.092*** | (0.01) | 0.060 |
| Mother college enroll | 0.016 | (0.02) | 0.003 | 0.022** | (0.01) | 0.015 |
| School enrollment in 1000s | –0.0095** | (0.00) | –0.029 | 0.00066 | (0.00) | 0.008 |
| % funded by military | 0.11 | (0.53) | 0.002 | 0.13 | (0.18) | 0.008 |
| Eth/race (Native American) | 0.067 | (0.12) | 0.023 | –0.27*** | (0.04) | –0.351 |
| Eth/race (Asian) | –0.30*** | (0.08) | –0.104 | 0.051* | (0.02) | 0.067 |
| Eth/race (Black) | –0.011 | (0.05) | –0.004 | –0.34*** | (0.01) | –0.443 |
| Eth/race (Latino) | 0.23*** | (0.05) | 0.077 | –0.21*** | (0.01) | –0.277 |
| Eth/race (Native Hawaiian) | 0.35 | (0.34) | 0.119 | –0.27*** | (0.07) | –0.355 |
| Eth/race (Pacific Islander) | –0.27 | (0.19) | –0.092 | –0.25*** | (0.06) | –0.335 |
| Eth/race (other) | –0.63*** | (0.09) | –0.215 | –0.11*** | (0.02) | –0.145 |
| Eth/race (2 or more) | –0.14** | (0.05) | –0.049 | –0.13*** | (0.01) | –0.170 |
| Eth/race (prefer not to respond) | –1.02*** | (0.07) | –0.348 | –0.086*** | (0.02) | –0.113 |
| Gender (woman) | 0.39*** | (0.03) | 0.134 | 0.070*** | (0.01) | 0.092 |
| Gender (other) | –1.72*** | (0.21) | –0.586 | 0.049 | (0.05) | 0.065 |
| Gender (prefer not to respond) | –1.06*** | (0.11) | –0.360 | 0.065* | (0.03) | 0.086 |
| Age (20–21) | 0.18*** | (0.03) | 0.061 | –0.064*** | (0.01) | –0.084 |
| Age (22–24) | 0.47*** | (0.04) | 0.160 | –0.017 | (0.01) | –0.022 |
| Age (25–29) | 0.91*** | (0.04) | 0.310 | 0.11*** | (0.01) | 0.144 |
| Age (30–39) | 1.04*** | (0.05) | 0.356 | 0.22*** | (0.01) | 0.292 |
| Age (40–49) | 0.97*** | (0.06) | 0.331 | 0.28*** | (0.02) | 0.370 |
| Age (50–64) | 1.01*** | (0.07) | 0.344 | 0.37*** | (0.02) | 0.490 |
| Age (65+) | 0.57*** | (0.16) | 0.196 | 0.50*** | (0.05) | 0.661 |
| Constant | 21.0*** | (0.06) | –0.215 | 1.95*** | (0.03) | –0.026 |
| Observations | 119360 | 113671 | ||||
| Adjusted R2 | 0.038 | 0.097 | ||||
[i] Clustered standard errors in parentheses.
*p < 0.05, **p < 0.01, ***p < 0.001.
Military status, the composite mindset variable, and the measures of age, race-ethnicity, and gender were entered into another regression predicting self-reported GPA. As indicated in Equation 2 of Table 2, military status was positively associated with GPA (b = 0.051, p < .001), such that current and former members of the military had higher GPAs than did students without military experience: SSM/V students had 0.05 point higher GPAs on the standard 4-point scale than did non-SSM/V students. Thus, as was the case with mindset, although the association between SSM/V status and GPA was statistically significant, it was quite small.
Mediation
A mediational analysis was conducted using PROCESS macro (Version 4.3.1; Hayes, 2023) to test whether the association between SSM/V and GPA was mediated by mindset, using 5,000 bootstrap samples and a 95% confidence interval. As shown in Figure 1, SSM/V predicted mindset, (b = –0.086, SE = 0.039, t = –2.19, p = .029). In turn, both SSM/V (b = 0.121, SE = 0.010, t = 12.04, p < .001) and mindset (b = 0.049, SE = .001, t = 65.33, p < .001) were significant predictors of GPA. The direct association between SSM/V and GPA remained significant, while the indirect association controlling for mindset was also statistically significant (b = –0.0042, 95% CI [–0.0083, –0.0002]). Notably, the indirect association was negative while the direct association was positive, suggesting suppression: The mindset the mindset variable diminished the statistical association between SSM/V and GPA. In other words, this mediational analysis suggests that were it not for their less-positive mindset, SSM/V students would have had even higher GPAs.5
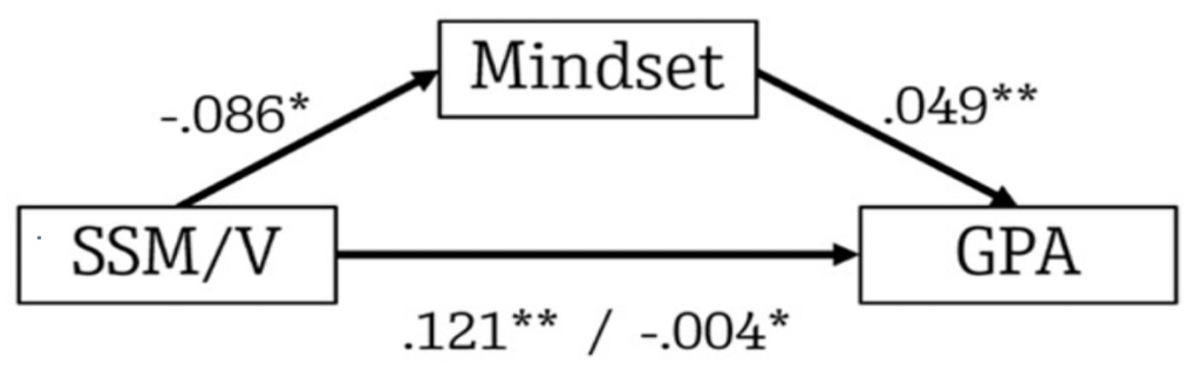
Figure 1
Mediation Model.
Institutional Characteristics
The mindset and GPA regressions include two institutional characteristics: the size of college and the size of the SSM/V-related population. The variables assessed the possible role of college-based characteristics in predicting the relationships between the extent of the military community, mindset, and GPA. College size was measured as enrollment in thousands, and the percentage of enrollment that is SSM/V-related was measured as students receiving military-based financial aid (e.g., G.I. Bill or Department of Defense funding).6 Data for these variables were drawn from the 2017 IPEDS data set. As indicated in Table 2, the size of the college was negatively associated with mindset (b = –0.009, p < .001) but was not associated with GPA. That is, students at larger institutions tended to have less-positive mindset scores than, but similar GPAs as, students at smaller schools. The percentage of students who received military-sourced financial aid was not statistically significant in either the mindset or the GPA regression.
We also included the percent of students on campus receiving SSM/V funding, along with an interaction term, to assess whether the association between SSM/V mindset and academic achievement was moderated by the proportion of SSM/V students on campus. This question is consistent with prior findings (Walton, 2014) that women in engineering are helped more by mindset interventions when the proportion of women in an engineering program is low. This term was not statistically significant, suggesting no evidence that the percentage of SSM/V students on campus is associated with the SSM/V mindset or academic performance. This finding, however, may vary across types of higher education institutions. For example, at four-year mostly residential schools, the presence of other SSM/V may be of more significance to SSM/V students than it is at community colleges, where they are more likely to be close to home and living in a familiar community. We also investigated the possibility that mindset and the size of the college variables were moderated by SSM/V status and found that neither of these interaction terms was significant. Moreover, none of the interaction terms we included affects the estimated coefficients for other variables significantly; consequently, we removed them from the analysis.
Next, we considered the possibility that both mindset and GPA were associated with unobserved institution-specific factors by introducing fixed effects in both equations. We also explored multilevel modelling, which allows for random effects that can account for unobserved variation in institutional factors. In both cases, we found that school-specific effects accounted for no more than 3% of the variation in either of our dependent variables. Consequently, our presented results are estimated using ordinary least squares regression analysis.7
Discussion
In this study, we explored the nature of learning mindset and its association with academic performance, as measured by GPA, for SSM/V, using the CCSSE. Five questions were designed to assess facets of the learning mindset, which included growth mindset, sense of social belonging, view of relevance of college studies to career goals, and self-efficacy, that were part of the 2018 administration of CCSSE. The primary results include:
SSM/V had higher GPAs but less-positive mindset on average than their civilian peers, even when controlling for a host of demographic variables. Although these differences were statistically significant, they were small.
The association between SSM/V status and GPA was partially mediated by learning mindset. Although SSM/V had higher GPAs on average, they also reported less-positive learning mindsets, which, in turn, predicted lower GPA. This suggests that, were it not for their less-positive mindset, SSM/V individuals might have achieved even higher academic performance.
No evidence was found to indicate that the SSM/V mindset or GPA were correlated with the percentage of SSM/V at an educational institution.
Implications
The data suggests that SSM/V have a slightly less-positive learning mindset on average, which, although statistically significant, is small in magnitude. The small difference between SSM/V and civilians is an important result. Given the absence of a large difference in mindset between SSM/V and civilians, we urge caution in making any assumptions that the SSM/V mindset is substantially different from that of civilians. It may be the case that facets of mindset differ noticeably for these two groups. However, we do not see evidence of such material differences in the data and analysis at hand.
Limitations and Directions for Future Research
A limitation of this study is that the data do not allow for differentiation between veterans and active-duty military students. Veterans and active-duty personnel likely face different challenges. For example, active-duty military students may be managing deployment schedules, military obligations, and various benefit structures, while veterans may be dealing with transition challenges and reintegration into civilian life. These different circumstances could produce different patterns in mindset and academic achievement that we were unable to assess in this study. Because the data were collected from students at U.S. community colleges, future research into the generalizability of these findings would also be warranted. For example, exploring if students at four-year colleges and universities show similar results to include students in graduate programs. Also, it may prove useful to expand the research to explore if students at vocational institutions show similar results. As community colleges represent only one post-secondary educational experience, the extent to which these findings generalize to other such experiences may be of interest to future researchers.
Perhaps the most exciting direction for future research would be to assess the potential causal effects of a mindset intervention on academic achievement among SSM/V. To our knowledge, none of the mindset intervention literature to date has investigated the effectiveness of interventions for SSM/V. Consequently, we do not know if SSM/V react differently to mindset interventions than civilians on average, or if they would benefit from their own SSM/V-tailored mindset exercises. Still, such an intervention must be considered in light of recent scholarship that calls these interventions into question. For example, Macnamara and Burgoyne’s (2023) meta-analysis of dozens of studies found only a non-significant overall effect when accounting for publication bias. Similarly, Gazmuri’s (2025) structured review of 24 trials noted that the highest-quality experiments report near-zero effects and generally no meaningful improvement in achievement. In a large field experiment, Huillery et al. (2023) found a very modest positive outcome among students at disadvantaged schools.
Conclusion
As SSM/V represent a meaningful proportion of college students in the U.S., understanding the correlates of their academic success is of profound importance. We found that SSM/V had a slightly less-positive mindset and higher GPAs than civilian students. We further found evidence that were not for their less-positive mindset, SSM/V would have had even higher GPAs than did civilian students. Finally, we found that SSM/V slightly outperformed civilian students when controlling for other demographic factors.
College faculty and staff are well-positioned to help close this modest academic mindset deficit that SSM/V have relative to their peers. By actively fostering a sense of belonging and explicitly encouraging a growth mindset, college personnel can enhance the extent to which SSM/V believe in their ability to succeed academically. While we cannot assert a direct causal link, closing that mindset gap may further bolster SSM/V success. Whether or not SSM/V mindset is best addressed through programs specifically designed for SSM/V is an open question. Because the difference we found was so small, it is possible that the experience and needs of SSM/V may be quite similar to those of other students. But it may also be that SSM/V mindset would benefit from programs designed for them specifically. Our findings suggest that both approaches should be considered.
Data Accessibility Statement
The data set and codebook used in this study is available upon request from the Center for Community College Student Engagement and is subject to acceptance of a data-use agreement. IPEDS data were downloaded and merged with the Community College Survey of Student Engagement data by the Center. Consequently, the IPEDS data used are part of the data set available from the Center. A Stata do-file for replication of results is available upon request from the authors.
Notes
[2] Though we are not aware of mindset intervention studies for SSM/V in higher education, Lucke and Furtner (2015) and McCrory et al. (2013) demonstrated that interventions to enhance the self-efficacy facet of mindset have been effective in a military-training context.
[3] In the process of conducting the CCSSE survey in the classroom, courses were randomly selected from a sampling frame of all credit-bearing courses, including developmental-education courses. Because full-time students, by definition, enrolled in more classes than did part-time students, full-time students are overrepresented in the final sample. The Center creates college-specific weights using the year-appropriate publicly available IPEDS (U.S. Department of Education, Integrated Postsecondary Education Data System) data for the participating colleges each year to account for this sampling bias.
[4] The Center deems surveys unusable for reasons such as the absence of a response to the full-time/part-time question, which is needed to create weights for the data. “Usable” in this context is a determination made by the Center and not by individual researchers using the data. In accordance with the Center’s confidentiality guidelines, researchers may not have access to responses that can be associated with a particular school’s identity. Thus, because of very small numbers of participating colleges from some states (one or two colleges), responses from the following states and territories were not provided to us: Washington, D.C.; South Dakota; Utah; Idaho; Montana; New Mexico; Nevada; Oregon; the Marshall Islands; Guam; and Micronesia. A total of 3639 students (2.71% of the sample) across the colleges in the states and U.S. territories listed were excluded from the final data set. Furthermore, given the focus on students associated with the U.S. Armed Forces, responses from Canadian colleges were also not provided.
[5] The 2018 survey also included a more detailed 15-item instrument assessing mindset. We only analyzed the 5-item mindset measure, however, because more schools administered the 5-item measure than the 15-item measure. Using the 15-item measure would have meant losing 37% of our participants and 14 states and territories.
[6] The mediational model did not include the battery of covariates found in the primary analyses. The coefficients in this model therefore differ from their primary-analysis counterparts. Additionally, we conducted five follow-up mediation analyses, one for each of the items that comprised the global measure. Of these five alternative models, two showed complete corroboration (all four coefficients remained significant), and three showed substantial corroboration (two of the four coefficients remained significant). None of the five alternate models yielded any significant coefficients contrary to that of the original model.
[7] IPEDS does not report the number of SSM/V. Rather it reports the number of students who received Post-9/11 GI Bill benefits plus the number of students receiving Department of Defense tuition assistance. Since GI Bill benefits can be reassigned to immediate family members, this variable is more a measure of students who are part of military-associated families than it is a measure of military status. Descriptive statistics for this variable are included in Table 1 as military funding.
[8] We included fixed effects using Stata’s “areg” command, which absorbs a categorical factor, in this case, institution identity, in a manner that permits retention of the institution-specific weights required by the survey design, which are used in all other regressions in this research. The intraclass correlation coefficients are .033 and .027 for the GPA and mindset regressions respectively, indicating that very little of the dependent variable variation is associated with variation across schools. Fixed effects are therefore not needed, which has the advantage of allowing us to include the variables for institution enrollment and military community presence, which could not be included with the fixed effects. The mixed multilevel model that allows random effects has intraclass coefficients of 0.024 for the GPA regression and 0.028 for the mindset regression when independent variables are not included; these are a few tenths of a point lower when independent variables are included in the regression.
Ethics and Consent
This research received approval from the Human Subjects Review Committee at Union College; Approval number (exempt) E25018.
Acknowledgements
We thank Roger Hoerl for assistance with data analysis.
Competing Interests
The authors have no competing interests to declare.
Author Contributions
Therese McCarty and George Bizer developed the research question, conducted data analysis, and prepared the manuscript. E. Michael Bohlig prepared the data set, guided decisions regarding data analysis, and assisted with manuscript preparation.