
Table 1
Demographic and Military Characteristics of the Sample (N = 269).
| CHARACTERISTIC | n | (%) |
|---|---|---|
| Age Range | ||
| 22–32 | 53 | (19.7%) |
| 33–43 | 95 | (35.3%) |
| 44–55 | 66 | (24.5%) |
| 56–66 | 35 | (13.0%) |
| 67–80 | 20 | (7.4%) |
| Gender | ||
| Male | 222 | (82.5%) |
| Female | 42 | (15.6%) |
| Non-binary/Other | 5 | (1.9%) |
| Race/Ethnicity | ||
| White/Caucasian | 175 | (65.1%) |
| Black/African American | 49 | (18.2%) |
| Latino/Latinx/Hispanic | 23 | (8.6%) |
| Asian | 7 | (2.6%) |
| American Indian | 5 | (1.9%) |
| Multiracial/Other | 10 | (3.7%) |
| Education | ||
| High school or equivalent | 96 | (35.7%) |
| Some college | 80 | (29.7%) |
| Bachelor’s or higher | 53 | (19.7%) |
| Other | 40 | (14.9%) |
| Employment Status | ||
| Full-time | 125 | (46.5%) |
| Unemployed | 48 | (17.8%) |
| Retired | 37 | (13.8%) |
| Other | 59 | (21.9%) |
| Military Branch | ||
| Marine Corps | 140 | (52.0%) |
| Army | 72 | (26.8%) |
| Navy | 40 | (14.9%) |
| Air Force | 17 | (6.3%) |
| Service Era/Operational History | ||
| Vietnam/Post-Vietnam | 33 | (12.3%) |
| Gulf War/Somalia | 44 | (16.4%) |
| GWT/OIR | 181 | (67.3%) |
| Other | 39 | (14.5%) |
| Received Transition Resources | ||
| Yes | 176 | (65.4%) |
| No | 89 | (33.1%) |
[i] Note. Percentages may not total 100 due to rounding or multiple responses. GWT/OIR = Global War on Terror and/or Operation Inherent Resolve.
Table 2
Frequency of Institutional Betrayal Total Scores (IBQ_11total; N = 269).
| SCORE | FREQUENCY | PERCENT | CUMULATIVE % |
|---|---|---|---|
| 0 | 14 | 5.2 | 5.2 |
| 1 | 10 | 3.7 | 8.9 |
| 2 | 6 | 2.2 | 11.2 |
| 3 | 14 | 5.2 | 16.4 |
| 4 | 14 | 5.2 | 21.6 |
| 5 | 27 | 10.0 | 31.6 |
| 6 | 30 | 11.2 | 42.8 |
| 7 | 31 | 11.5 | 54.3 |
| 8 | 38 | 14.1 | 68.4 |
| 9 | 35 | 13.0 | 81.4 |
| 10 | 39 | 14.5 | 95.9 |
| 11 | 11 | 4.1 | 100.0 |
[i] Note. IBQ_11total reflects the number of “Yes” responses to 11 core items of the IBQ.2-M (excluding IBQ1 and IBQ6).
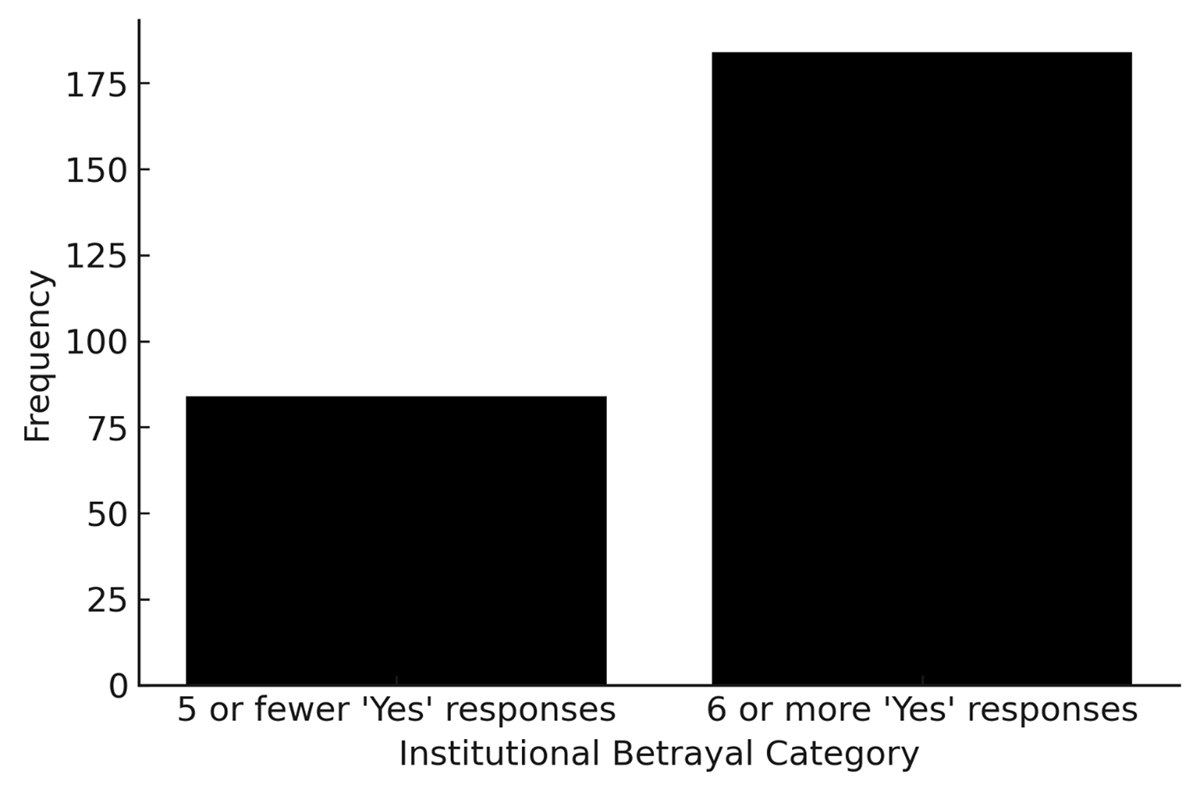
Figure 1
Distribution of Institutional Betrayal Scores.
Note. Frequency of participants who reported 5 or fewer vs. 6 or more “Yes” responses to institutional betrayal items.
Table 3
Percentage of “Yes” Responses to IBQ2-M Items Among Veterans (N = 269).
| ITEM | DESCRIPTION | n | % |
|---|---|---|---|
| IBQ1 | Current transitional process betrayal | 169 | 62.8% |
| IBQ2 | Failed to prevent challenges | 222 | 82.5% |
| IBQ3 | Difficulties seemed common/normal | 213 | 79.5% |
| IBQ4 | Difficulties more likely | 215 | 79.9% |
| IBQ5 | Difficult to report challenges | 211 | 78.7% |
| IBQ6 | Inadequate support | 205 | 76.5% |
| IBQ7 | Mishandled experience | 111 | 41.4% |
| IBQ8 | Covered up challenges | 144 | 53.7% |
| IBQ9 | Denied/minimized experiences | 154 | 57.7% |
| IBQ10 | Punished for reporting | 39 | 14.6% |
| IBQ11 | Affected reputation | 78 | 29.1% |
| IBQ12 | No longer felt valued | 207 | 77.5% |
| IBQ13 | Dissuaded from re-enlisting | 191 | 71.5% |
[i] Note. N varies slightly due to minimal missing data (267–269). Percentages reflect the proportion of “Yes” responses to each item of the IBQ-2-M.
Table 4
Cross-tabulation Perceived Military Transition Support and Institutional Betrayal Groups.
| IBQ HALVES | INADEQUATELY SUPPORTED? YES | INADEQUATELY SUPPORTED? NO | TOTAL |
|---|---|---|---|
| 5 or fewer ‘Yes’ responses | |||
| Count | 42 | 42 | 84 |
| Expected Count | 64.3 | 19.7 | 84.0 |
| % within IBQ6 | 20.5% | 66.7% | 31.3% |
| Standardized Residual | –2.8 | 5.0 | |
| 6 or more ‘Yes’ responses | |||
| Count | 163 | 21 | 184 |
| Expected Count | 140.7 | 43.3 | 184.0 |
| % within IBQ6 | 79.5% | 33.3% | 68.7% |
| Standardized Residual | 1.9 | –3.4 | |
| Total | |||
| Count | 205 | 63 | 268 |
| Expected Count | 205.0 | 63.0 | 268.0 |
| % within IBQ6 | 100.0% | 100.0% | 100.0% |
[i] Note. Perceived military support was assessed based on participant responses to IBQ6, which addressed the inadequacy of military support for the transition process. Institutional betrayal groups were determined by the number of “Yes” responses to 11 core items from the IBQ.2-M (excluding IBQ1 and IBQ6), with a total sample of 268 participants.
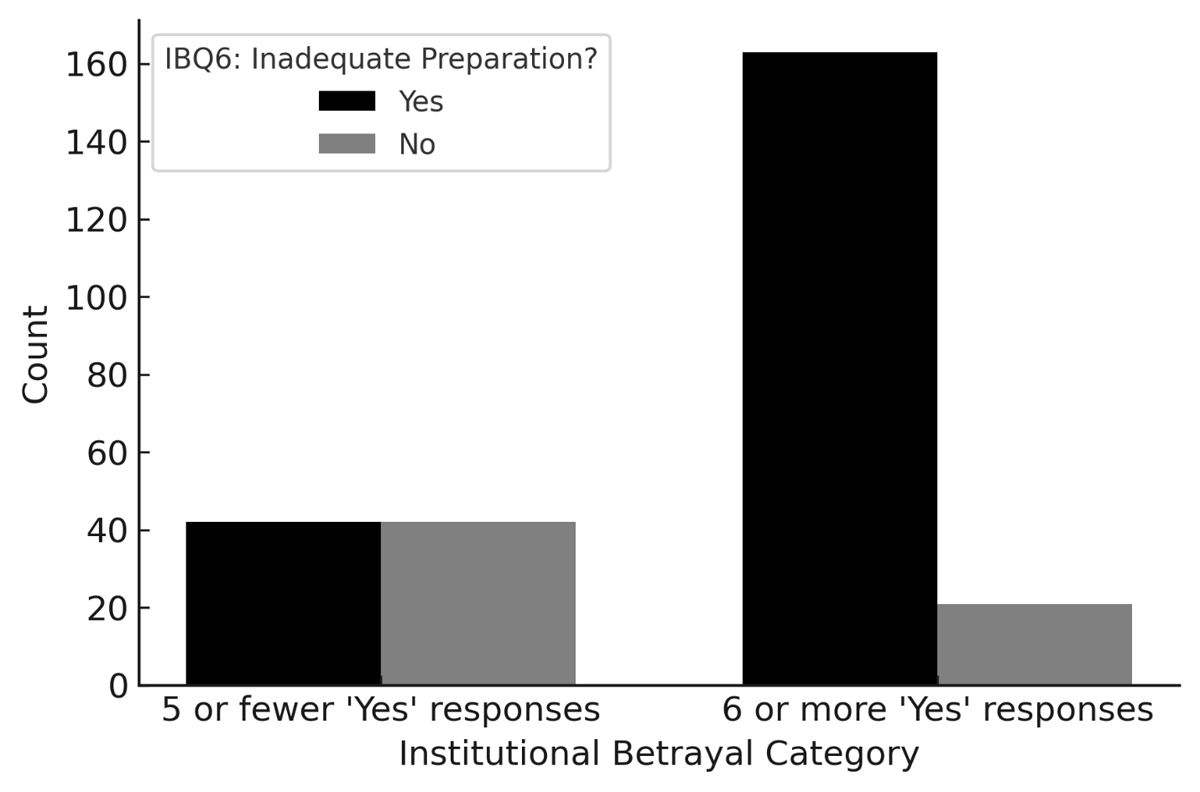
Figure 2
Institutional Betrayal by Perceived Inadequacy of Military Support.
Note. This figure illustrates the association between institutional betrayal scores and perceptions of military preparation adequacy.
Table 5
Frequencies and Percentages of Resources Received from Military (N = 269).
| RESOURCE RECEIVED | FREQUENCY | VALID PERCENT | CUMULATIVE % |
|---|---|---|---|
| Solid Start | 3 | 1.1% | 1.1% |
| Post-9/11 Military2VA | 19 | 7.2% | 8.3% |
| VA Liaison Program | 2 | 0.8% | 9.1% |
| Transition Assistance Program (TAP) | 152 | 57.4% | 66.4% |
| No, I did not receive or access any of these services during transition | 89 | 33.6% | 100.0% |
| Total (Valid) | 265 | 100.0% | — |
| Missing (System) | 4 | — | — |
| Total (All Cases) | 269 | — | — |
[i] Note. Valid percentages are based on 265 participants who provided responses. Four cases with missing data were excluded from the valid percentage calculations.