
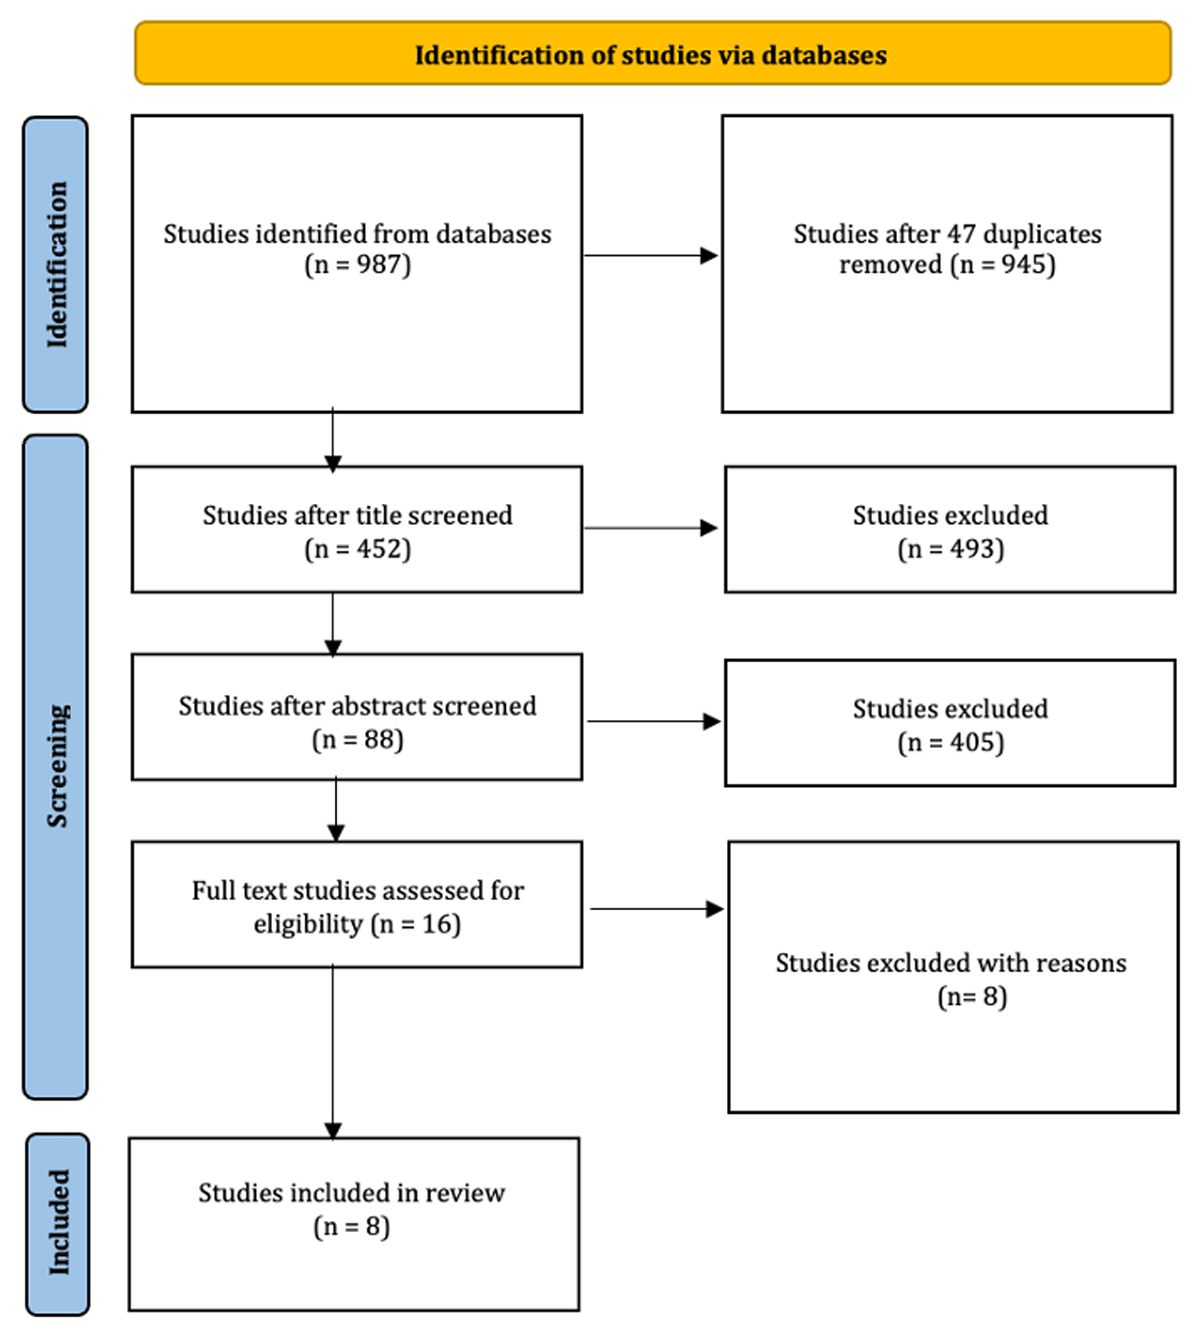
Figure 1
PRISMA 2020 Flow Diagram.
Note. See the PRISMA 2020 Statement from Page et al., 2020.
Table 1
Study and Sample Characteristics.
| STUDY | STUDY DESIGN | PARTICIPANTS | SELECTED QUANTITATIVE HEALTH AND WELLBEING OUTCOMES |
|---|---|---|---|
| Hammer et al. (2019) [1] | RCT comparing Supportive Supervisor Training (SST) to standard practice SST Group: 16 organisations taking part in SST (n = 275) Control Group 19 organisations on waiting list (n = 222) Assessment at baseline, 3 months; 9 months | Service members from the Northwest region of the US, currently employed in the civilian workforce (with some still in active contracted duty e.g., part time) National Guard members (Army and Air), Army Reserves, Marine Reserves, Navy Reserves, Air Force Reserves, Coast Guard Reserves, Army, Navy, Air Force, Marine, Coast Guard Average age 39.91 years (at baseline) 83.7% male, 16.3% female (at baseline) | Reported as Group: Baseline 3 months; at 9 months Perceived health [4 item scale, adapted from Hobfall et al., (2012). (1 (to no extent/never) to 5 (a very great extent/all the time); reported as an average response, a higher value indicates better health. SSTGroup: 3.56 (±0.88); 3.63 (±0.82); 2.54 (±0.88) Control Group: 3.67 (±0.81); 3.74 (±0.75); 3.58 (±0.84) Walter Reed Functional Impairment Scale [14 items; 1 (no difficulty at all) to 5 (extremely difficult); reported as an average response; lower score indicates less impairment] SST Group: 1.71 (±0.63);1.67 (±0.66); 1.67 (±0.69) Control Group: 1.72 (±0.63); 1.68 (±0.58); 7.64 (±0.59) Difference between groups at 3 months; at 9 months Perceived Health: NSD p = 0.519; NSD p = 0.302 Functional Impairment: NSD p = 0.526; NSD p = 0.747 |
| Mohr etal. 2021 [2] | RCT comparing Supportive Supervisor Training (SST) to standard practice Secondary analysis included only individuals who were married or cohabiting SST Group 16 organisations taking part in SST (n = 72) Control Group: 19 organisations on the waiting list (n = 72) Assessment at baseline, 6 months | National Guard members, reservists, and separated (former) service members (termed veterans) and married or cohabiting partners (referred to as spouses) from across Oregon and Southwest Washington, US Average age 38.4 years (at baseline) 91% male, 9% female (at baseline) | Reported as Group: baseline; 6 months Positive and Negative Emotion: PANAS-X [9 items (5 negative, 4 positive emotions), 1 (not at all) to 5 (extremely); reported as average response; individual emotions and composite scores, higher value indicates more emotion] Negative emotion composite score SST Group: 1.43 (±0.22); 1.40 (±0.26) Control Group: 1.40 (±0.22); 1.39 (±0.28) Positive emotion composite score SST Group: 2.48 (±0.72); 2.47 (±0.71) Control Group: 2.52 (±0.67); 2.38 (±0.52) Difference between groups at 6 months Negative composite: NSD p > 0.05 Positive composite: NSD p > 0.05 Relaxed: positive effect p < 0.001 Quiet: positive effect p < 0.001 other individual emotions: NSD p > 0.05 |
| Hammer et al. 2020 [3] | RCT comparing Supportive Supervisor Training (SST) to standard practice. Secondary analysis included individuals matched with a participating supervisor. SST Group 16 organisations taking part in SST (n = 79) Control Group 19 organisations on the waiting list (n = 110) Assessment at baseline, 3 months; 9 months | Veterans and supervisors employed within organisations (matched together) from the Northwest region of the US National Guard members (Army and Air), Army Reserves, Marine Reserves, Navy Reserves, Air Force Reserves, Coast Guard Reserves, Army, Navy, Air Force, Marine, Coast Guard Veteran Participants: Average age 39 years (at baseline) 85.5% male, 14.5% female | Reported as Group: baseline; 3 months; 9 months Pittsburgh Sleep Quality Index [selected items; sleep quality using one item on overall sleep quality 1 (very bad) to 4 (very good); sleep duration time between lights off and getting out of bed. Sleep Quality: SST Group: 2.46 (±0.71); 2.59 (±0.72); 2.59 (±0.86) Control Group: 2.46 (±0.70); 2.56 (±0.64); 2.56 (±0.65) Sleep Duration [hours]: SST Group: 7.11 (±1.24); 7.30 (±1.22); 7.26 (±1.16) Control Group: 7.23 (±1.18); 7.27 (±1.08); 7.19 (±1.17) Perceived Stress [4 item scale, adapted from Cohen et al, 1983; 1 (never) to 5 (often), reported as an average response, higher values indicate more perceived stress] SST Group: 2.38 (±0.86); 2.43 (±0.74); 2.34 (±0.92) Control Group: 2.41 (±0.84); 2.43 (±0.64); 2.20 (±0.77) Difference between groups at 3 months; at 9 months Sleep Quality: NSD p = 0.35; NSD p = 0.48 Sleep Duration: NSD p = 0.59; NSD p = 0.41 Perceived Stress: NSD p = 0.62; NSD p = 0.15 |
| Leddy et al. 2014 [4] | Observational (cross-sectional) study of Supported employment (IPS) and/or transitional work experience (TWE) Two cohorts progressing through the same Veterans Affairs (VA) centres. The Initial cohort was offered standard VA services, including TWE. The Second cohort was offered both IPS and standard VA services, including TWE. Secondary analysis combined data from both cohorts for this analysis and reported as five groups based on the support received and working status across 6 months. Group 1: no IPS, no TWE, not working (n = 100) Group 2: no IPS, TWE, not working (n = 96) Group 3: no IPS, TWE, working (n = 30) Group 4: no IPS, no TWE, working (n = 58) Group 5: IPS, no TWE, working (n = 158) | Homeless veterans with psychiatric or substance use disorders from three Department of Veteran Affairs sites across the US Age range: 44–47 years Over 90% male | Reported as, Time: Group 1; Group 2; Group 3; Group 4; and Group 5 Health Related Quality of Life measured by Short From 12 [SF-12, 12 items, reported as physical and mental composite score, range 0–100, higher scores indicate better physical and mental health functioning] SF-12 physical component (PCS) Baseline: 46.86; 47.24; 48.84; 49.47; 48.99 Changeat 6 months: –1.15; –0.72; –0.44; –0.38; –0.76 SF-12 mental component (MCS) Baseline: 42.46; 41.47; 44.90; 45.52; 45.67 Changeat 6 months: 0.53; 1.66; 5.33; 2.74; 3.68 Subjective distress [33 items from symptom checklist 90 SCL-30, 0 (not at all) to 4 (extremely), report as an average response; higher values indicate more distress] Baseline: 1.08; 1.15; 1.08; 0.95; 0.81 Change at 6 months: –0.15; –0.26; –0.38; –0.33; –0.27 Difference Between Groups at 6 months SF-12 PCS: NSD p = 0.98 SF-12 MCS: NSD p = 0.15 SCL-30: NSD p = 0.17 |
| Ottomanelli et al. 2013 [5] | RCT comparing a Supported employment program (SE) to control SE Group: Participants received supported employment (n = 81) Control Group: Participants received treatment as usual (n = 76) Assessment at baseline; 12 months | Veterans with spinal cord injury (SCI) receiving healthcare from one US Veterans Affairs Medical Center (VAMC) Average age 48.5 years 95.5% male, 4.5% female | Reported as Group baseline; 12 months Veteran specific health related quality of life VR-36 [36 items; 3-point response scale, reported as physical component and mental component sub-scores, range 0–100, higher values represent between physical and mental health functioning] VR-36 physical component (PCS) SE Group: 27.7 (±7.5); 29.3 (±7.7) Control Group: 28.1 (±8.4); 27.6 (±7.9) VR-36 mental component (MCS) SEGroup: 54.7 (±13.8); 55.1 (±14.3) Control Group: 55.6 (±12.9); 55.0 (±14.2) Functional Independence Measure [FIM, 18-items 1 (total assistance) to 7 (complete independence), report as the sum of scores, total score composed of the sum of cognitive (range 5–35) and mobility (range 13–91) components, higher scores indicate more independence FIM cognitive SE Group: 33.8 (±2.3); 33.9 (±2.2) Control Group: 33.7 (±2.8); 34.1 (±1.5) FIM mobility SE Group: 66.9 (±21.6); 70.7 (±17.4) Control Group: 66.4 (±22.2); 67.4 (±20.8) Craig handicap assessment and reporting technique (CHART) [32 items, six dimensions (cognitive independence, physical independence, mobility, occupation, social integration, economic self-sufficiency), range 0–100; higher values represent lesser degree of disability or higher degree of social/community participation] CHART economic self-sufficiency SE Group: 51.5 (±37.8); 56.8 (±36.1) Control Group: 52.6 (±36.9); 59.1 (±3.8) CHART physical independence SE Group: 85.7 (±20.9); 87.4 (±20.3) Control Group: 87.2 (±22.1); 86.7 (±23.8) |
| Bond et al. 2022a [6] | RCT comparing an intensive employment model (National Career Coach Program; NCCP) to control NCCP Group: Participants receiving NCCP intensive training scheme (n = 115) Control Group: Participants referred to local services (n = 114) Assessment at baseline, 12 months | Transitioning veterans from across the US with self-reported service-connected disabilities seeking permanent employment. Without civilian employment or unemployed or working short term jobs and receiving for a service-connected disability rating and compensation Average age 30.3 years 80.6% male, 19.2% female | Reported as, Group: baseline; 12 months [difference baseline to 12 months] Veteran specific health related quality of life VR-12 [12 items; reported as physical component and mental component sub-scores, range 0–100, higher scores indicate better physical and mental health function] VR-12 physical component (PCS) NCCP Group: 39.57 (±11.23); 12 months: 41.57 [p = 0.04] Control Group: 41.99 (±10.81); 38.39 (±11.51) [p = 0.001] VR-12 mental component (MCS) NCCP Group: 42.53 (±13.66); 45.07 (±13.70) [p = 0.04] Control Group: 45.05 (±14.52); 42.87 (±15.52) [p = 0.11] Depression: Patient Health Questionnaire-9 [PHQ-9; 9 items 0 to 3, sum to score, range 0–27, higher values indicate more severe depression] NCCP Group: 8.74 (±6.58); 8.18 (±5.67) [p = 0.29] Control Group: 8.08 (±5.92); 8.68 (±7.07) [p = 0.31] InCharge Financial Distress Financial Wellbeing [IFDFW; 8 items, 1 to 10, reported as an average response; higher values indicate less financial distress and more financial wellbeing] NCCP Group: 5.73 (±2.49); 6.52 (±2.24) [p = 0.001] ControlGroup: 5.15 (±2.68); 5.87 (±2.86) [p = 0.01] Difference between groups from baseline to 12 months VR-12 PCS: NCCP Group better p < 0.001 VR-12 MCS: NCCP Group better p = 0.02 PHQ-9: NSD p = 0.14 IFDFW: NSD p = 0.86 |
| Bond et al. 2022b [7] | RCT comparing an intensive employment model (National Career Coach Program; NCCP) to control NCCP Group: Participants receiving NCCP intensive training scheme (n = 115) Control Group: Participants referred to local services (n = 114) Assessment at baseline, 24 months | Transitioning veterans from across the US with self-reported service-connected disabilities seeking permanent employment. Without civilian employment or unemployed or working short term jobs and receiving for a service-connected disability rating and compensation. Average age 30.4 years 81.2% male, 18.8% female | This is a follow-up study from [7]; see entry in table above for tool information. Note that the analysis on a smaller sample due to dropouts, so baseline is not identical. Reported as, Group: baseline; 24 months [difference baseline to 24 months] VR-12 PCS: NCCP Group: 40.04 (±11.38); 43.80 (±10.91) [p = 0.002] Control Group: 42.22 (±11.13); 40.55 (±15.30) [p = 0.31] VR-12 MCS: NCCP Group: 43.37 (±12.80); 45.02 (±14.73) [p = 0.62] Control Group: 47.92 (±13.59); 44.39 (±15.30) [p = 0.05] PHQ-9: NCCP Group: 8.10 (±6.27); 7.59 (±5.52) [p = 0.39] Control Group: 6.61 (±5.04); 7.29 (±6.06) [p = 0.35] IFDFW: NCCP Group: 6.04 (±2.52); 7.24 (±2.57) [p < 0.01] Control Group: 5.41 (±2.91); 6.85 (±2.64) [p < 0.01] Difference between change in groups to 24 months VR-12 PCS: NCCP Group better p = 0.01 VR-12 MCS: NCCP Group better p = 0.03 PHQ-9: NSD p = 0.20 IFDFW: NSD p = 0.59 |
| Shepherd-Banigan et al. 2021 [8] | Qualitative exploration of facilitators and barriers of veterans and carers engaged in Supported employment, vocational, and educational services (VR&E). Assessment: Qualitative semi-structured one-off telephone interviews. | Veterans with disabilities and caregiving needs who were enrolled in a Veteran Affairs programme of comprehensive assistance for family caregivers (and their family members) from across the US Disabilities include musculoskeletal problems, PTSD, mental health conditions Average age 42.2 years 100% male | n/a |
[i] Note: No Significant Difference (NSD).
Table 2
Content of Each Employment and Vocational-based Intervention.
| CONTENT OF THE PROGRAMME | SUPERVISOR SUPPORT TRAINING (SST) | SUPPORTED EMPLOYMENT (SE) | TRANSITIONAL WORK EXPERIENCE (TWE) | NATIONAL CAREER COACH PROGRAM (NCCP) |
|---|---|---|---|---|
| Support services (including emotional, instrumental, workplace, vocational, training, skills development) | X | X | X | X |
| Measurement, monitoring, and direction (setting goals and measuring results) | X | |||
| Feedback/coaching/ mentoring/ role modelling | X | X | ||
| Resource provision (provision of finances, equipment, and/or materials to aid employment) | X | X | ||
| Health-related aspects (health protection/ integrated clinical care/ medical rehabilitation) | X | X | ||
| Family support (to help veterans meet family and personal demands) | X | |||
| Placement opportunities Access to competitive jobs/ job placement (including flexibility of placement, incentives for employment) | X | X |
Table 3
Summary Table of Identified Links from a Review of Impacts of Employment and Vocational-based Interventions on the Health and Wellbeing of Veterans.
| EMPLOYMENT AND/OR VOCATIONAL INTERVENTION | HEALTH STATUS | HEALTH AND WELLBEING OUTCOMES |
|---|---|---|
| Supportive Supervisor Training (SST) | No diagnosed health issue specified | Improved perceived health moderated by perceived support [1] Improved daily emotions related to being calm, quiet, and relaxed [2] Reduced negative emotions in those without any PTSD symptoms [2] Improved sleep quality moderated by supervisor support [3] Improved perceived stress moderated by supervisor support [3] |
| Supported Employment (SE) | Spinal cord injury (SCI) Veterans with disabilities, musculoskeletal problems, and/or PTSD and/ or mental health condition Diagnosed psychiatric disability and/or a substance use problem | Improvement in mobility (unclear whether statistically significant) [5] Improved self-confidence [8] Decreased anxiety [8] Improved quality of life [8] No significant findings [4] |
| Transitional Work Experience (TWE) | Diagnosed psychiatric disability and/or a substance use problem | No significant findings [4] |
| National Career Coach Program (NCCP) | No diagnosed health issue specified | Improved physical health-related quality of life [6, 7] Maintained mental health-related quality of life [6, 7] Decreased financial-related distress [6, 7] Decreased tobacco use [6, 7] Decreased opioid use [6, 7] Decreased alcohol use per week [7] |