
Introduction
Open-source technology is typically defined as software for which the original source code is made freely available and which may be redistributed and modified by anyone to comment, to detect bugs, to write patches for correcting bugs, and to propose modifications (De Laat, 2004). These open-source licenses allow everybody to correct, modify, and improve the source code as they please, and to further distribute code, whether modified or not. This method allows for the user community to freely view and contribute ideas rather than allowing only proprietary ideas to be contributed towards the end product. Transparent collaboration and information sharing is a cornerstone of the open-source movement, which dates back to the hacker culture of the 1960s (Senia, Horton & Whitehead, 2010).
The Open Source Initiative (2019) further defines open-source as a way for companies and individuals to collaborate around shared needs on a product that they could not do by themselves or when key business differentiators are not involved. They go on to say that the open-source model enables increased security due to the extreme scrutiny from many public contributors, and it is a way to organize smaller players against monopolistic organizations. There is also a culture, or attitude, of collaborative sharing that includes a broader set of values called ‘the open-source way,’ which involves applying the principles of open-source beyond software technology to change society in similar ways that the open-source model changed software. Open exchange, collaborative participation, rapid prototyping, transparency, meritocracy, and community-oriented development are key factors (Open Source, 2019). Furthermore, it means committing to playing an active role in improving the world, which they say is possible only when everyone has access to the way that world is designed and being able to participate.
Whitehurst (2015), the CEO of the open-source organization Red Hat, says leaders that embrace such open-source methodology values can successfully redesign or create an organization suitable for the decentralized and empowered digital age. An open organization, Whitehurst (2015) defines, engages participative communities both inside and out by quickly responding to opportunities, having access to resources and talent, and inspires, motivates, and empowers people at all levels of the organization to act with accountability. Corrupt behavior made possible by secrecy is a problem that the technological and cultural aspects of open-source methodology might help resolve, along with improving public trust, among other benefits.
Previous research shows the importance of trust. Pavlou (2003) explains that trust can help to reduce perceived risk felt by consumers online as well as favorably influence transaction intentions through positive attitudes. Trust factors also have a positive effect on system trust, which is effective in increasing open-source adopters’ attitudes and intentions (Roumani, Nwankpa & Roumani, 2017). Fuchs, Prandelli, and Schreier (2010) found that users engaging in value-creation activities for a company feel that they have an impact on their products on a personal level as well as positive outcomes for demand of their products. Dahl, Fuchs, and Martin (2015) further mention that observational consumers might also demand products of consumer driven companies over designer-driven companies. A review of the extant literature found little research regarding current levels of managerial and public trust in open-source adoption situations.
Even with the abundance of information stimulating us at nearly every moment, there is still information that is not readily available for people to make informed decisions. At the same time, private information can be a necessary component for peace in society, and too much information can be counterproductive (De Fine Licht, 2014; Grimmelikhuijsen, Porumbescu & Hong, 2013). Exactly what and how much information needs to be private or public is a balance we as a society are figuring out together. The balance is continually being challenged by people who have interests in keeping information private and those that are actively working to implement policies for transparency.
The general meaning of transparency implies openness. Finel and Lord (1999) define transparency as legal, political, and institutional structures that make internal information available to actors both inside and outside of the domestic systems. Transparency, along with accountability, is rarely defined with precision and it tends to mean different things to different people (Fox, 2007). According to leading voices on the subject, transparency is the opposite of secrecy and is made possible by greater availability of information (Florini, 1998; Gupta & Mason, 2014). Florini (1998) also states that transparency is a choice and is encouraged by changing attitudes about what constitutes appropriate behavior. Gupta (2008) and Mason (2008) further highlight the complex, contested, and important nature of transparency as a tool of reconstituting embedded power relationships. Moreover, in an era in which information and technology are fundamental to society, determining who has the right to know what amidst constantly changing public acceptance presents an important and challenging policy matter in the presence of powerful entities. Across multiple domains, transparency has been touted as a countervailing solution for social, political, and corporate issues (Roberts, 2009), while scholarly interest in transparency has enhanced our understanding of information sharing, accountability, and how transparency removes corruption, secrecy, and other kinds of misconduct (Flyverbom et al., 2016).
The quantity and accessibility of shared resources are key factors. For example, under the open-source model, people diagnose problems, suggest fixes, and help with improvements far more quickly than the proprietors could do by themselves (Raymond, 2001). Open-source solutions also have a history of reliability and security because everyone is able to see the code and report the issues they find (Senia et al., 2010). To develop computer security by assuring predictability, we have to understand the interrelationships between all of the hosts and services on our networks as well as the ways in which those hosts can be accessed (Burgess, 2004). While this goes back to the hacker ethic of open collaboration, there are also studies that indicate more protection through secrecy may lead to less prosperity and therefore utilizing more open-source methods would not only allow organizations to increase prosperity but also allow the local community and even the country to prosper together as well through a source of continually evolving ideas produced by a community of heads, hearts, and hands with skin in the game as citizens (MacDermott, 2015; Senia et al., 2010).
An organization using a piece of open-source software is free to perform their own security auditing, which would not be possible with proprietary closed-source software. While the ability to audit source code, particularly for high-level risks, is an advantage, the ability to modify the software to specifically meet customized requirements is perhaps even more significant (Payne, 2002). The users of proprietary software are entirely at the mercy of the software vendor and their level of expertise, whereas an open-source solution can have a community of talent at the ready to solve specific issues with customized or universal solutions. Payne (2002) has also suggested that empirical research shows that open-source systems tend to be more secure; however, software will not become automatically more secure by simply making the source code open-source. Skilled code auditors and programmers with the necessary security expertise are required to make a significant impact on the overall security of software code (Payne, 2002).
Problem statement
This project examined the ways that open-source methods, such as technology, culture, transparency, information sharing, and collaboration, can be utilized to improve public and business services as well as trust in these services. Breaches in security, inefficient energy usage, malware, and other malfeasance thrive in secrecy and continue to plague socio-economics, which extends out to the consumer sphere. For the past several years, public trust levels in business, media, government, and non-governmental organizations have declined (Edelman, 2017; 2020). Critical business systems, such as networking, data storage, and daily computing equipment, are especially susceptible given their necessity for business operations. For example, the closed-source solutions that businesses currently use might be spying, creating security holes, or wasting resources, especially if the solutions originate from other countries or are a one-size-fits-all type of solution with limited customization and support personnel. Furthermore, the current adoption and acceptance levels of open-source methodology are unknown. The problem statement of this study was how open-source methodology can be used to improve business processes and services as well as public trust with transparency, information sharing, and collaborative progress in the proprietary and largely closed source business world.
Research Questions
The research questions that guided this study include the following:
How are businesses currently utilizing open-source methods?
Where might progress be hindered by proprietary closed-source business models?
What are expectations and desires for expansion of open-source methods?
How could developing an open-source methodology improve business processes and trust with the consumer sphere?
Research Methods
This study was mainly quantitative in design with some qualitatively fashioned open-ended components included on a survey. Mackenzie and Knipe (2006) mentioned that both quantitative and qualitative approaches to research are needed for a study to be fully effective. While a fully mixed-methods study would have provided more information, the scope of this project was already large in scale and pushing size and budgetary boundaries. Therefore, open-ended questions were used in a qualitative fashion for acquiring deeper understanding to attempt what Gorard (2004) identified as improving social science with mixed-methods research, which also gives impetus for further research on the topic of open-source adoption. While a survey was used as the single method for data collection, this study used mixed-method approaches for data analysis. The quantitative and qualitative data was collected from both quantitative questions and open-ended questions to gather more in-depth responses from participants on their perceptions about open-source adoption. The survey was designed and hosted with the tools available on the Qualtrics experience management software platform sponsored through Indiana State University.
Population and sample
The population that this research has generalized included technology managers employed at companies in the United States of America with $10 million or more in annual revenue. Managers from technology business units can include executives, mid-level, and supervisory management personnel where technology policy and decision making occur as part of their job functions. Identifying the level of each manager was not allowed due to Institutional Review Board constraints. Being both quantitative and qualitative in nature, this study followed the methods and protocols for acquiring a random representative sample of the population while also taking the necessary precautions for participant and data security required by the Institutional Review Board.
A market research firm was utilized for assistance in delivering the survey and gathering the response data from their pool of pre-recruited participants based on the target population parameters. According to their research consultant assigned to this project, each participant is vetted through a qualification panel that also includes incentives for participating. The goal was to collect 250 total responses to analyze for a margin of error rate of 6% while also staying within budget, rather than collecting 350 responses and going over budget for only a 1% drop to a 5% margin of error.
Survey instrument
The survey was constructed from previously published academic surveys based on open-source usage and adoption in European organizations. Three in total were used to develop the different parts of the survey instrument for this research study. Communication was established with the authors of the previous studies to collaborate with their prior research. They were easily reachable through email after some searching for updated contact information. Some tips were shared and encouragement given to facilitate updated information about open-source technology and related methodology.
The first of three survey projects utilized was called ‘How European Software Industry Perceives OSS Trustworthiness and What Are the Specific Criteria to Establish Trust in OSS’ and facilitated by Vieri del Bianco, Michele Chinosi, Luigi Lavazza, Sandro Morasca, and Davide Taibi (2011). Their survey was based on three other previously published surveys also studying adoption. Two were published in the journal IEEE Software, and another was published in the edited compilation publication called Open-Source Development, Adoption, and Innovation. The results reported from their survey matched the findings of the three other surveys published in 2008–2009 regarding the selection and usage of commercial off-the-shelf and open-source software components, reasons for adopting open-source software, and external support for open-source software adoption (Bianco et al., 2011).
The second survey project referenced was called ‘Motivation of Software Developers in Open-Source Projects: An Internet-Based Survey of Contributors to the Linux Kernel’ and facilitated by Guido Hertel, Sven Niedner, and Stefanie Herrmann (2003). The measures for this survey were based on models from social science and factors derived from discussions within the Linux community. The first model, called VIST, is based on the previous work by Hertel (2002) and acknowledges that an individual’s motivation to work in a virtual team is determined by the four components of valence, instrumentality, self-efficacy, and trust. The second is called the Extended Klandermans Model, or EKM, and comprises four motivational components, which includes collective motives, norm-oriented motives, reward motives, and identification processes, to explain motivations for voluntary action in social movements or community projects (Klandermans, 1997). The participants identified themselves as Linux developers with pragmatic motives to improve their own software with consideration to their tolerances of time investments for both individual and team contributions. Activities in the teams were determined by the participants’ evaluation of the team goals as well as by their perceived indispensability and self-efficacy. The authors based their research study on systematic approaches as provided by the aforementioned relevant theoretical models from social sciences to understand the motives of open-source software developers.
The third survey project utilized was called ‘Selective Openness, Fairness and the Motivation to Contribute to Open Innovation Communities’ and was facilitated by Cord Gruenewald (2012). This survey used two research models to measure the results. The first model analyzed the effect of selective openness on the motivation to participate and the effect of motivation on participation behavior. The second model analyzed how fairness mediates the relationship between selective openness and the motivation to contribute. Both models involve the constructs of transparency, accessibility, intellectual property rights, usage motivation, profit motivation, activity and supportiveness while the second model includes fairness as well (Gruenewald, 2012).
Greene et al. (1989) mentions reasons for a mixed-methods approach to further clarify the research design and data analysis used in this study: triangularization seeks convergence, corroboration, and correspondence of results; complementarity seeks elaboration enhancement, illustration, and clarification of the results from one method—such as the quantitative questioning component in this study—with the results from another method—such as the results from the open-ended questioning component; completeness, as further mentioned by Bryman (2006), allows the researcher to construct a more comprehensive analysis by using both quantitative and qualitative data. These reasons contributed towards justifying the decisions on the general framework of this study (Creswell & Plano Clark, 2018).
All of the survey components mentioned above were used to form the category constructs for this survey. The category constructs used for the survey instrument were developed by the previously published open-source themed surveys referenced as well as previous research done by the authors of this study. Table 1 lists the category constructs along with their abbreviations as a legend and any related variable notes for statistical calculations. The full survey instrument and data results are available in their entirety at ProQuest as a dissertation under the same author and title name as this article. Anyone wanting the raw data can also contact the author, Lawrence Bosek, with their inquiry.1
Table 1
Category Constructs Used on the Survey.
| CATEGORY CONSTRUCT | ABBREVIATION | VARIABLE TYPE |
|---|---|---|
| Awareness | Q1 | Multiple Selection Nominal |
| Quantity | Q2 | Continuous Scale Ratio |
| Economic Development | Q3 | Likert Scale Ordinal |
| Licensing | Q4 | Likert Scale Ordinal |
| How open-source could improve public trust | Q5 | Open-Ended Qualitative |
| Product Quality | Q6 | Likert Scale Ordinal |
| Trust Elements | Q7 | Likert Scale Ordinal |
| Verifying Quality | Q8 | Likert Scale Ordinal |
| Other factors to include in open-source | Q9 | Open-Ended Qualitative |
| Commercial Alternatives | Q10 | Likert Scale Ordinal |
| Support | Q11 | Likert Scale Ordinal |
| General Colleague Attitude | Q12 | Continuous Interval |
| Involvement Gains | Q13 & Q13ab | Likert Scale Ordinal |
| Open-source Thoughts | Q14 | Likert Scale Ordinal |
| Open-source Feelings | Q15 | Likert Scale Ordinal |
| Usage Motivations | Q16 | Likert Scale Ordinal |
| Profit Motivations | Q17 | Likert Scale Ordinal |
| Sharing Motivations | Q18 | Likert Scale Ordinal |
| Availability Motivations | Q19 | Likert Scale Ordinal |
| Other ideas to improve public trust | Q20 | Open-Ended Qualitative |
| Education Level | Q21 | Demographic Nominal |
| Age | Q22 | Demographic Ordinal |
| Industry | Q23 | Demographic Nominal |
| Company Background/Size | Q24 | Demographic Ordinal |
| Additional Information | Q25 | Open-Ended Qualitative |
[i] Note. This table provides a key for each survey question and the associated categorical constructs as well as the abbreviations and variable types used in this report when referencing or describing in the text and for data analysis with statistical calculations.
Data Analysis
After the data was collected, it was first checked for accuracy and integrity by filtering incomplete responses and contradictory results that might also indicate bias. The data was first scrubbed for any discrepancies, errors, and omissions. A total of 361 surveys were delivered, out of which 254 qualified responses were used for analysis as N. The goal to attain 250 total responses was achieved. There were less than 0.5% instances of ‘no response’ or missing data for all qualified quantitative responses, which were also bias checked by inverse questioning and attentiveness. There were 107 responses disqualified based on completion and attentiveness by not following the instructions in the question, such as picking a predetermined response to see if respondents are actually reading the survey questions. Among the disqualified from the total were those participants that either ignored the survey invitation or did not pass the attentiveness checks. Those disqualified responses were removed from the recorded data. This process put the response rate at 70%. The pool of potential recipients used by the market research firm for sampling matched the target population comprising technology managers at USA-based companies with $10 million or more in annual revenue. Detailed demographic data is also available at the ProQuest link given above.
The other bias checks, except for one, all leaned heavily towards the negatively worded opposite survey item. The one bias check that did not meet significant opposite responses was regarding companies that forbid involvement in open-source technology projects. This question might have been too confusingly worded, or perhaps companies have certain policies regarding certain technology needs and the question was too broadly worded, since both open- and closed-source technology can coexist together. Qualitative responses had less than 5% instances of blank or no responses except for the last question, Q25, which had a 23% no response rate.
The qualitative data was then segmented into the relevant themes according to the question responses. The themes, based on participant perceptions and values, were determined by the open-ended responses and then coded into the NVivo qualitative analysis software for thematic analysis. After the data was organized and analyzed, the data was then interpreted using all of the information gathered in a way related to the research problem in order to attempt to conclusively answer the research questions.
For the quantitative data received, a 95% confidence interval (p < .05) was used for statistical analysis. This was applied to all of the quantitative analysis on the data. Basic descriptive statistics, crosstabulations, chi square, Cronbach’s alpha, and Spearman’s correlation tests were the main statistical tests conducted. Cross-tabulation analysis was used to check for frequencies among and between these groups, such as particular attitudes, behaviors, or demographics. Cronbach’s alpha was used to check for internal validity. Ordinal regression was attempted as well, but there were too many caveats and violated assumptions to be considered reliable enough for inclusion in the analysis.
The qualitative data analysis involved an inductive and deductive process, which is typical of qualitative research. According to Creswell and Creswell (2018), qualitative researchers work inductively by building patterns, categories, and themes from a bottom-up review of the data and forming a meaningful organization within the abstract units of information. The process went back and forth between the themes and the data until a comprehensive set of themes could be established. The deductive process then took place after themes were established by looking back through the data based on the themes to discover any additional evidence that could support each theme or if additional data gathering was needed. These processes were concurrent and played an important role in determining the forward progress of the research project (Creswell & Creswell, 2018).
Qualitative analysis began by devising a coding framework to construct thematic networks among the sub-themes for each open-ended question separately (Attride-Stirling, 2001). The global theme deduced was already known as adopting open-source methodology for improving business processes and public trust. Figure 1 below shows a visual mapping of the themes found from the data that was collected.
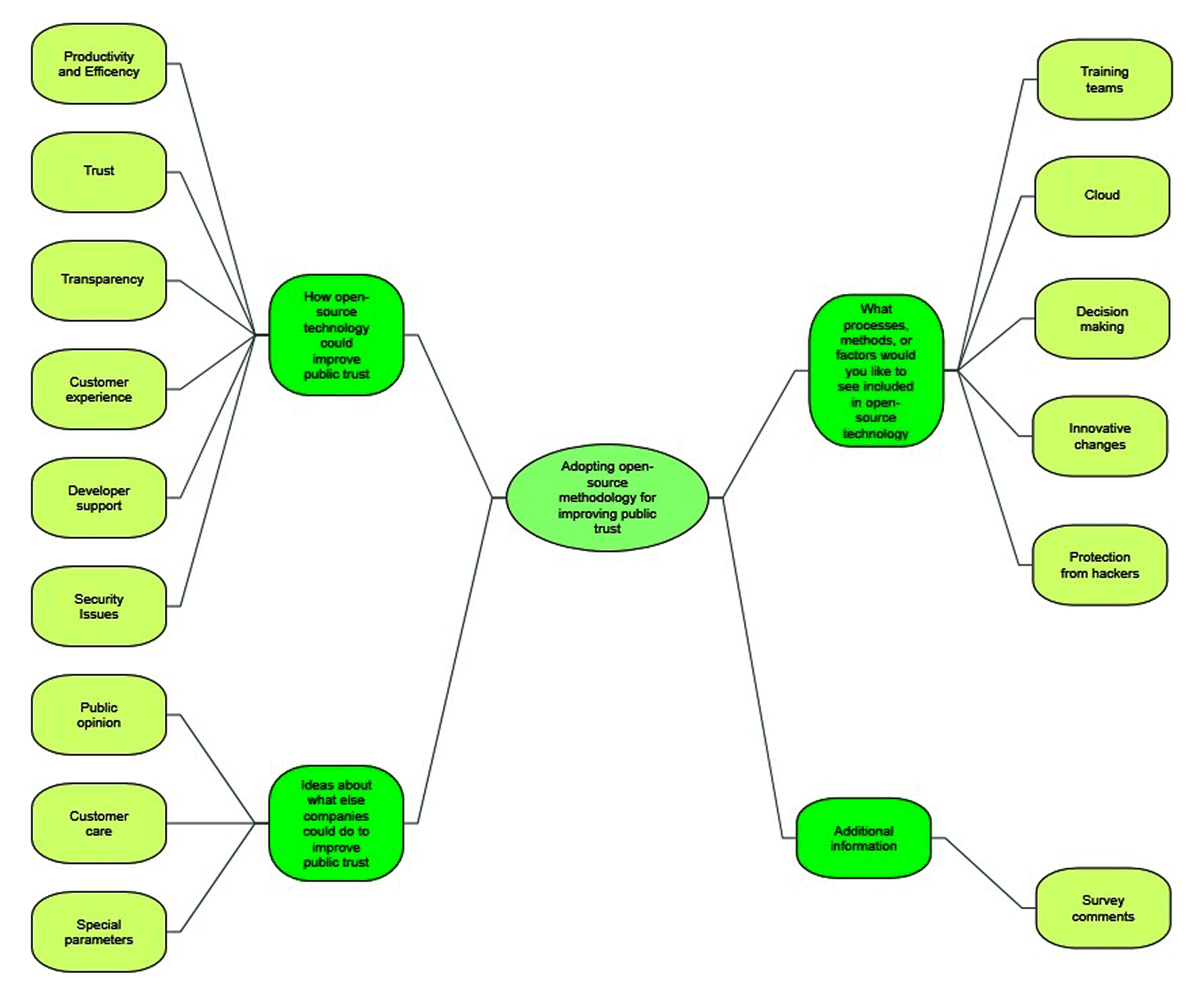
Figure 1
Mind Map Diagram for Qualitative Themes.
The first theme formulated was for Question 4, asking how open-source technology could improve public trust. Productivity and efficiency were found to be useful as the first sub-theme, with the key words of comfortable, improve, service-oriented, easy to use, and standard testing being used as codes. The second sub-theme was trustworthiness, with trust, secure, public trust, gain trust, and service being used as codes. The third sub-theme was found to be transparency, with transparency, best service, multiple-level transparency, good in explaining, and business practice being used as codes. The fourth sub-theme was found to be customer experience, with freedom, flexibility, unique, better customer service, and high quality being used as codes. The fifth sub-theme was found to be developer support, with making codes, involvement, wider developers, and product being used as codes. The sixth sub-theme was found to be security, issues with protection, security, safe, secure, and reliability being used as codes.
The second theme formulated was for Question 9, asking what processes, methods, or factors one would like to see included in open-source technology. The cloud was found to be useful as the first sub-theme, with the key words of private clouds, cloud technology, cloud storage, and Google cloud being used as codes. The second sub-theme was found to be decision making, with enough, decision making, management, change, update, and useful being used as codes. The third sub-theme was found to be innovative change, with speeding, reduce, efficiency, versioning, and privacy concern being used as codes. The third sub-theme was found to be training teams, with training team, review, and capability being used as codes. The fourth sub-theme was found to be protection from hackers, with protect, security, reports, bug spam, virus, and hacking being used as codes.
The third theme formulated was for Question 20, asking for ideas about what else companies could do to improve public trust. Public opinion was found to be useful as the first sub-theme, with the key words of public opinion, reviews from customers, independent review, comments, and service being used as codes. The second sub-theme was found to be customer care, with great product, strong relationship, testimonials, reputation, privacy, and trust being used as codes. The third sub-theme was found to be special parameters, with saving, helpful, reliable, parameters, and transparent being used as codes.
The fourth and final individual theme formulated was for Question 25, asking for additional information from respondents about any topic discussed on the survey. Happy with the survey process was found to be useful as the first sub-theme, with the key words of nice, great, excellent, nothing, good, and interesting being used as codes. This was the only sub-theme found for this theme among the data, as the responses for this question were the least insightful among the others. Most respondents used the space to offer praise about the survey and the topic of open-source methodology adoption for improving public trust.
Additional qualitative thematic analysis was performed on the response data combined together for the four open-ended questions as a whole to see what kind of cumulative themes would arise. The results were informative, particularly with the word counts showing commonly referenced subjects, although not as useful as the previous themes because all of the words were the same for each theme and the context was not defined as much. This overall combined analysis found four additional themes to be relevant overall among all of the four open-ended question responses combined. The first theme found was the ethical dimensions of open-source methodology. The second theme found was the social dimensions of open-source methodology. The third theme found was exploring opportunities for improvements. The fourth theme found was the future of open-source methodology.
Discussion
Upon first looking at the data from the survey there were a few obvious insights that stood out obtrusively to the reader. The most obvious of which was the overwhelming support for open-source technology and related methodology as described in the preceding sections of this article. While these clearly supportive results, over 50% agreement for most items, were important to keep in mind for the study, there were also some deeper elements that are discussed here as well to provide some nuanced granularity as appropriate. Also, it is worthy to note the heavily segmented demographic data that represented much of the results, which was not seemingly out of the ordinary considering the target population and current workforce conditions within technology. A large amount of the results from the survey represented companies based in technology as well as younger to middle-age respondents.
Most of the respondents, at 73.2%, reported to have familiarity with using open-source technology. Lesser amounts, below 50%, reported customizing their open-source technology, and even fewer contribute towards the open-source technology communities; both can be considered as subsets of familiarity through usage. Even fewer of the respondents, at 3.9%, reported to have no usage of open-source technology. When considering the high amount of usage of open-source technology reported, along with those that customize and contribute, it is safe to say that the sample is very familiar with the way that open-source technology works in general.
Furthering on the previous statistics, 51.1% of respondents reported that 60% to 89% of the technology used within the company was open-source technology. This constitutes a simple majority, and the amount increases when including all of the respondents reporting over 50% of the technology being open-source, which comes to 67.8% of respondents where open-source technology comprises at least 50% of their company technology solutions. At the same time, a majority of the respondents report that they were familiar with open-source processes and their company listens to them about open-source related decisions. This together would indicate that a majority of the respondents were not only familiar but also knowledgeable about open-source technology and work with it as a part of their employment responsibilities. Furthermore, there was a large amount of agreement support on an item asking if proprietary technology can be trusted as much as open-source technology.
Multiple survey items relating to open-source way characteristics (Whitehurst, 2015) as well as transparency, community-oriented collaboration, and information sharing showed a majority of agreement with responses. There was a majority of agreement among respondents when asked if companies keep too many secrets from the public. There was also a majority of agreement that companies should allow and encourage involvement in open-source, which contrasts in some ways with the majority of support that there are too many secrets being kept from the public. At the same time, technology managers responded in agreement that the public can influence their company. There was also a very large majority of agreement for critical systems, such as data storage, operating systems, and network infrastructure, being open-source in the future even if there is a decrease in profit. This confluence could point to the need for more transparency among business units particularly with public support. Public participation and support along with management decision making would be complementary and influential according to the responses for developing an open-source methodology adoption model.
Licensing options were favored throughout the data and show large agreement support for the freedom that comes with open-source licensing. There was little concern about any restrictiveness regarding open-source licensing and most liked the ease that comes with using open-source licensing. In fact, the respondents agree that proprietary licensing can hinder development, which lends credence to the quality being reported about open-source technology particularly with standard architecture, performance, and interoperability. Bug reports, reviews, and versioning were among the highest favored agreements to verify the quality of open-source technology. Quality was a leading concept being mentioned in the qualitative portion of the survey as well.
Respondents further indicated that community collaboration, transparency, and technical support were the elements they most agree with that allows them to trust the quality of the final result regarding open-source technology. These elements, particularly community collaboration and transparency, and how they relate to perceptions were a part of the core components of open-source methodology being examined in this study. The costs of open-source technology were additional elements that respondents shown to have a high amount of agreement support. The respondents have made it known that the elements are important and also provide reason to choose open-source technology over commercial alternatives.
Choosing open-source over proprietary commercial products seems related to improving public trust as both are related to elements within the quality categorical constructs. Again, respondents were in heavy agreement that improving public trust is possible through open-source technology. They also were in heavy agreement that sharing more internal company information with the public will improve their company’s image. Improving the public trust, while central to the study, was not the only concern. Respondents were also in heavy agreement that continuing to improve the quality of open-source technology was important as well.
The general attitude around open-source technology was also favorable among the colleagues of these technology managers that participated. Attitude scores from the data are mostly above 50% and range around 60% to 70% on average. The same goes for the level of importance of the general attitude among colleagues, which was right around 60% to 70%. Furthermore, regarding the attitude towards future open-source adoption among colleagues, the score was mainly around 70% as recorded from respondents.
Perhaps related to the high general attitude scores was the 51.6% that reported on daily work facilitation from better software as being very important. Over 50% reported this gain to happen much of the time in the future as well. Many again also reported that open-source will replace proprietary technology and also improve their company image in the future. The repetition of supportive agreement throughout the survey data showed the high regard that open-source technology has among respondents, and this attitude may also be spreading around to their colleagues as well. Perceptions and attitudes from successful integration like with a well-oiled machine can be infectious, especially if it makes the work life easier and more enjoyable for others, as we see in the next set of data.
The majority of respondents had supportive agreement in offering their personal contribution towards the success of open-source technology. A majority of them also felt belonging within the open-source communities and they indicated in multiple places that the success of open-source was important to them. Respondents in the majority reported open-source usage reasons as being fun and enjoyable as well as because they need to ensure the technology matches unique and specific needs. Supportive agreement regarding the ease of accessing information about open-source technology and understanding of the decision-making process within open-source communities, as a majority of respondents have reported, likely contributed to these favorable sentiments as well.
The demographic data was also concentrated in some areas. The majority of representation regarding the education level of respondents on the survey was 46.5% with a four-year degree. The next highest level of educational representation at 36.2% came from those with a master’s degree. This shows us that a large majority of respondents are college educated. In contrast only 1.2% of respondents reported having certifications as their highest level of education. While technology-based certifications typically suffice for gaining employment in the technology field, the managerial level seems to still prefer a university education. This might not be so surprising as the technological certifications are more suited for the technical side of the industry rather than the management tasks. At the same time, it is beneficial for a person to have a deeper understanding about the technology being supported by management. Therefore, it might be beneficial for managers to also have specific certifications on the technology they are managing as a complimentary piece of education.
Most of the representation was reported in the 35–44 age range, then the 25–34 age range was the next largest group. This is not so surprising, with those being the prime employment age. The managerial level could be from low-level supervisory all the way up to executive level, which we were not able to directly query due to IRB restrictions that would have made identifying respondents easier to do from their responses. This age range also represents the younger generations, which demonstrates their acceptance and willingness to share information. The younger generations already share large parts of their life through services such as social media for sharing their daily activities and thoughts, Uber for sharing their vehicles, and AirBnB for sharing their living spaces, and so on with other social applications that are readily accessible through smartphones. These sharing services are ubiquitous in modern times and were not nearly as prevalent in the past, which may also influence whether people want to share more information in an open-source community style of collaboration.
Given that the survey was targeting technology managers, it is also not surprising to see that the majority of respondents, and half of the total, are from the Electronics/Communications/Technology (ECT) industry, since technology-minded personnel are more likely to respond and have familiarity with open-source technology. Also, this industry category ranked among the top in the USA for gross domestic product and size according to the Bureau of Economic Analysis (2023) and the United States Economic Census (2022), albeit spread out over multiple listed sectors within the supersector group of professional and business services. Economic research statistics also indicated that there has been a growing shift towards outsourcing technology-related services, which could also mean a decrease in internal technology staff across other industries and therefore less representation in those industries (Foresi, 2020; Panko, 2019; Reynolds, 2019). Manufacturing, health and medical, and finance, to demonstrate, comprise the next highest industries being represented, which together was at less than half of ECT. After these industries, there was a more even amount of representation, although it was towards the low end for counting purposes. The annual revenues were also more evenly represented across all levels with the most coming from $500 to $999 million at 22.8% and then $100 to $499 million at 22.4% for the second most represented revenue. Over $25 billion in annual revenue was the lowest represented, at 5.1% reported.
Most of the thematic analysis can be summed up much the same as the quantitative analysis with a large lean towards supporting and adopting more open-source methodology. Multiple themes were found, supporting the usage, efficiency, trustworthiness, transparency, customer experience, development, training, security concerns, and overall ethics and future work of open-source methodology, which is discussed more in the following sections. The qualitative portion helped to answer the research questions more while the quantitative section provided sound foundational support. The support for open-source methodology has shown to be profound enough to continue with adoption and further study, even with approximately 12% of neutral responses reported per survey item. The quantitative and open-ended qualitative data together helped to provide reasoning to develop an open-source adoption model that can be used by companies, consultants, technology manager, or policy makers for future adoption efforts.
Once a foundation is developed for an open-source adoption model, case studies at diverse types of business environments could address nuances. Some of the key components of an open-source adoption model include the following derived from the data:
Support from both the public and related open-source technology communities:
make source code and other contentious information available;
invite participants from the local public and global communities;
create strong relationships with customers and query for suggestions;
accept community contributions and discuss improvements;
use a peer review process for integrating and disclosing information; and
take the community in which they operate into account when making decisions.
Training programs for those involved
initiate programs, seminars, and conferences for public participation;
use old-fashioned in-person team collaboration as well as virtual meetings;
teach using videos and virtual courses;
engage in mentorship with major players in the community; and
allow time for employees to participate.
Standardized platforms, including:
versioning history and chain of development;
change logs and improvement notes;
auditability;
cloud integration;
decentralized structures and open architectures; and
balanced trade-offs with safety, security, and sensitive information.
Comprehensive security testing, including:
penetration testing;
fuzz testing;
source code scanning; and
standard testing rating system for real-world production cases
Publicized updates and successes that:
showcase customer reviews and testimonials;
demonstrate company values;
create and widely distribute high-quality informative documentation;
constantly communicate updates such as a newsletter or website;
demonstrate compliance evidence; and
forefront of company advertising.
Conclusions
Businesses were utilizing open-source methods in a wide number of ways. Many respondents reported involvement in the community and are active in developing open-source technology either for their company or for the community. Progress was reported to be hindered by proprietary closed-source business models but there were no specific reasons given outside of the need for more transparency and honesty from businesses. Qualitative reports indicate that the secrecy often associated with business practices, such as trade secrets and customer experiences, can be damaging for public trust. Many respondents also reported that a fully transparent society would be ideal. Expectations and desires for expansion of open-source methods were reported by most of the responses. Most of the responses indicate that they use open-source technology in some way and there was much desire to expand upon the usage as well as the cultural aspects of transparency, collaboration, and information sharing for their company. Considering that there was a large majority of support for expanding the adoption of open-source methodology to improve business processes and public trust, key components were identified to develop an adoption model as well as a set of standards to integrate with the consumer sphere. For example, respondents reported the need for more transparency and sharing of information internally such as from a webpage, mobile app, or other publicly accessible format.
Open-source methodology is ripe for more adoption in this digital age, particularly with the growth of artificial intelligence and the fears that come with sentience. This is all the more reason to make all artificial intelligence source code open-source that can be scrutinized and modifiable by all parties affected. Financial institutions were also represented in the survey where respondents mentioned cryptocurrencies as a possible open-source solution with publicly viewable, decentralized, and distributed ledgers known as blockchains where all financial transactions can be viewed and scrutinized to reduce corrupt monetary transactions.
While there were some hints of cynicism, the respondents made clear that they desire a trustworthy, open, and honest business sphere where they can find information about company activity and behaviors. Finding the balance between public information and private information will be a part of the ongoing debate as releasing too much information too quickly can also hinder progress by causing confusion and contributing towards information overload while information without proper context can also be interpreted differently depending on ideology.
The results of this study were highly supportive for adopting open-source methodology and therefore important to note that there is now modern scholarly foundational support in the record of knowledge to build upon. Collaboration was highlighted as an important aspect of open-source methodology adoption and even more so than competition and profiting in some instances. These responses seem to corroborate with reports in the Free and Open-Source Software and Technology for Sustainable Development report where the non-rival properties of open-source licensing imply that adopters can cooperate together in providing enhancements and patches to common technical needs while also being competitors in other areas of the market (Daffara, 2012). Nobel Prize in Economics laureate Elinor Ostrom of the Bloomington School of Economics also hinted on open-source methodology, particularly community collaboration and information sharing, to solve the tragedy of the commons regarding resource management (Ostrom, 1990). Therefore, research suggests it is economically sensible to cooperate on critical shared resources that will reduce development and maintenance costs even among competitors that compete on different elements. Adopting open-source methodology could be a powerful solution as technology further advances considering the results of this study were largely positive and supportive of open-source methodology for improving business processes and public trust.
Notes
[2] Follow this link to be taken to the preview https://www.proquest.com/openview/3eb64437c246b2fe14f0a688d2b62d3f where access is granted with proper login credentials.
Competing Interests
LB completed this research project as a doctoral dissertation that was independently funded through student loans and fellowships. There was no funding received by any parties directly for purposes of this research. While the review process was blind, DB is a member of the editorial board for the Journal of Technology Studies, which is on a voluntary basis. All other authors have no competing interests.