
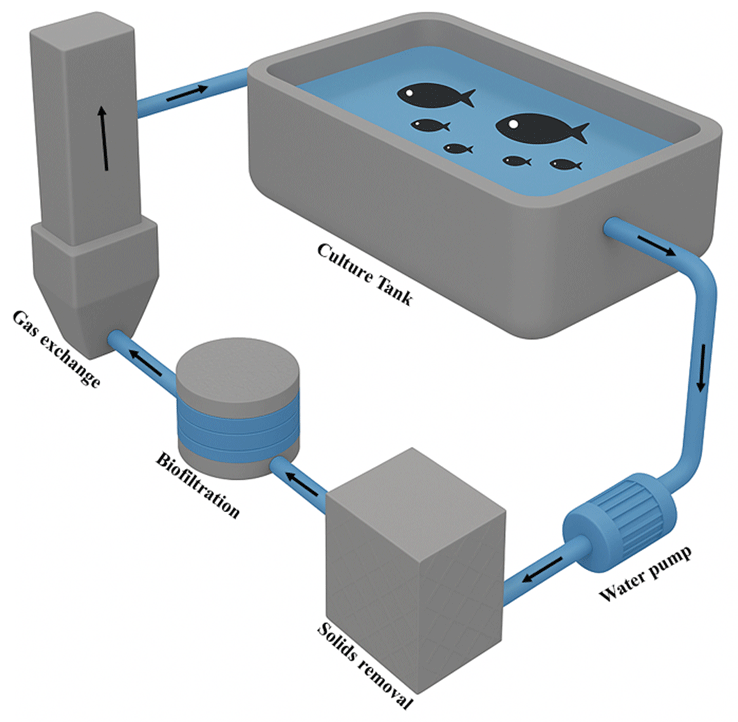
Figure 1
The typical RAS system consists of a culture unit, a mechanical filtration unit for solid capture, and a biofiltration unit.
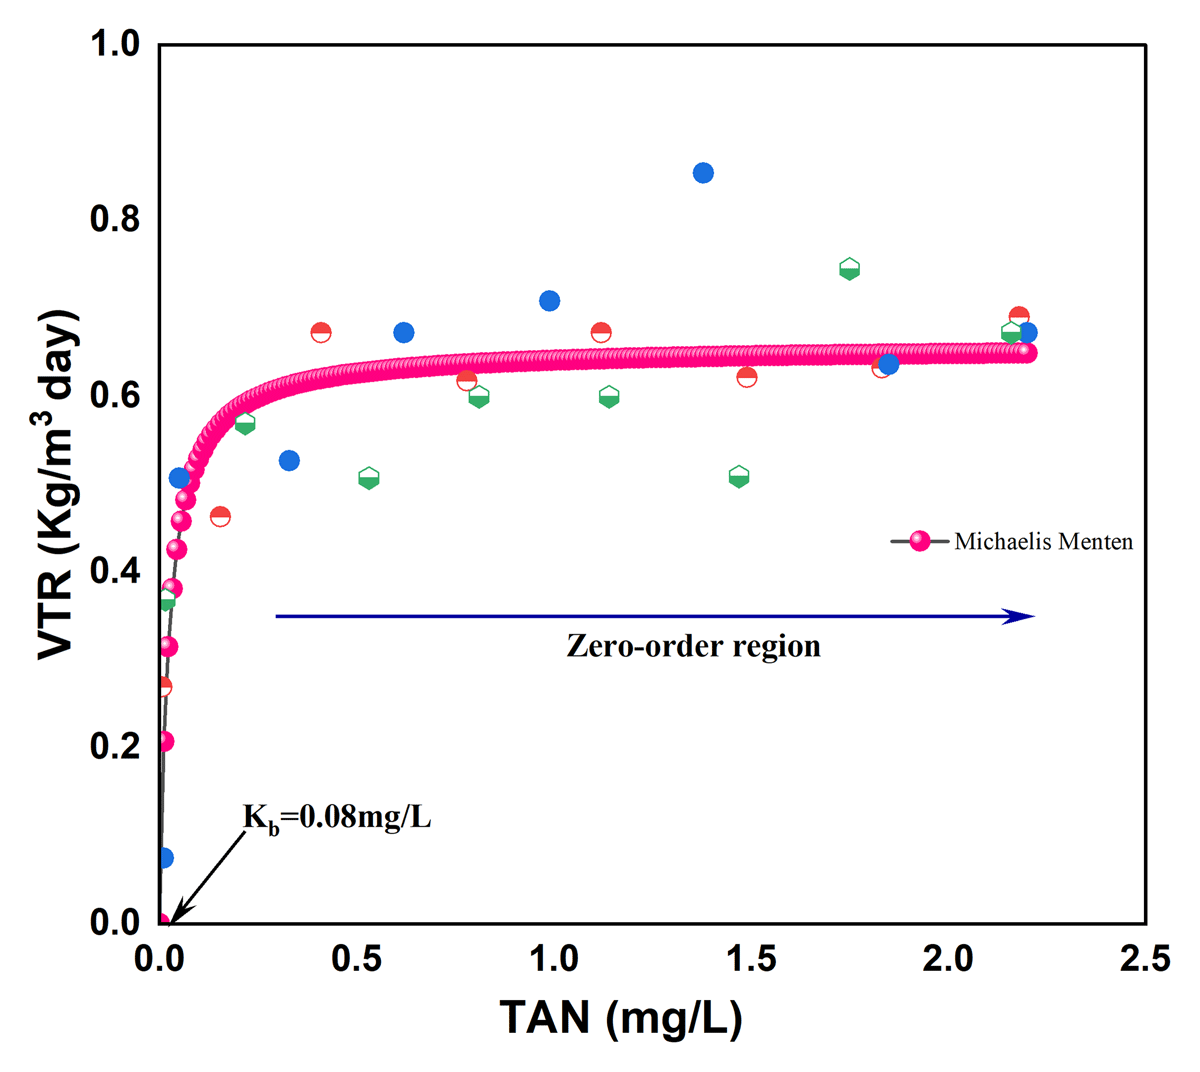
Figure 2
The aerobic assimilation of ammonia into biofilms on PHB pellets is well represented by hyperbolic kinetics and is dominated by zero-order kinetics with TAN levels above 0.5 mg/L (Fahandezhsadi 2014).
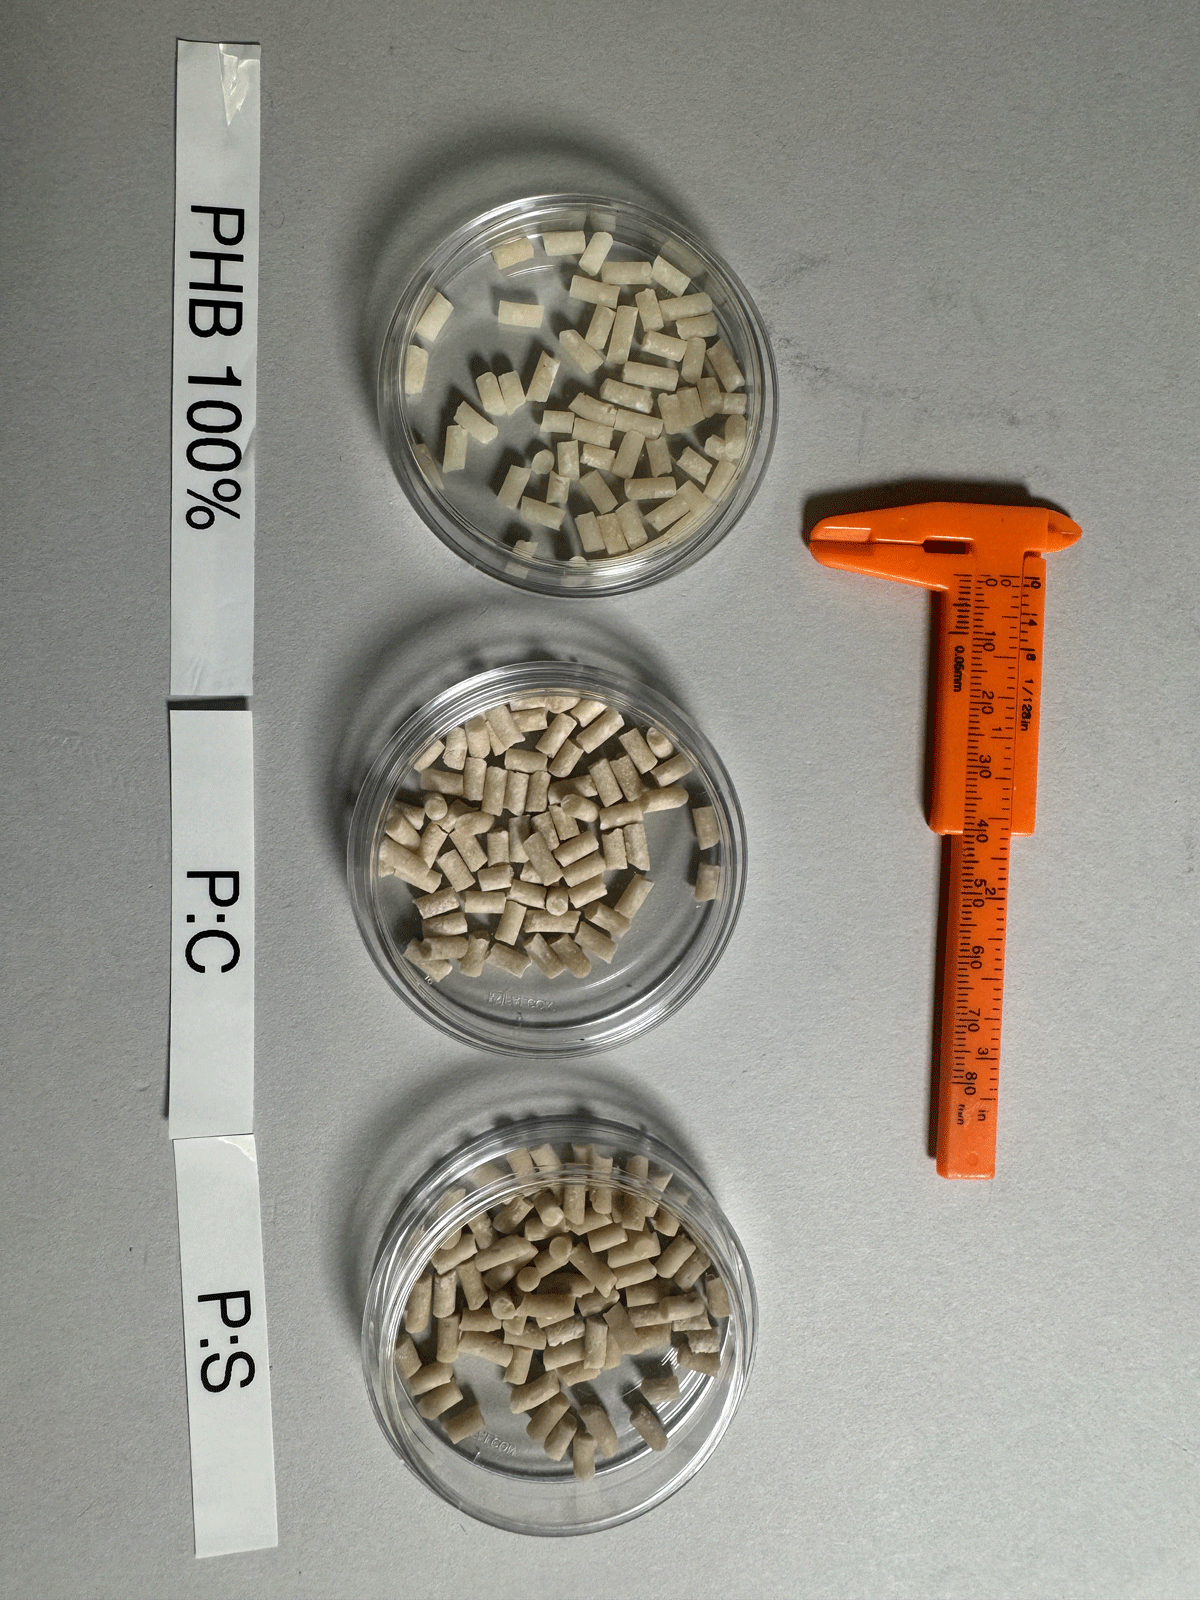
Figure 3
Biopellets of pure PHB, PHB/cellulose (P:C), and PHB/starch (P:S) blends produced for ammonia assimilation experiments. A caliper is shown for scale.
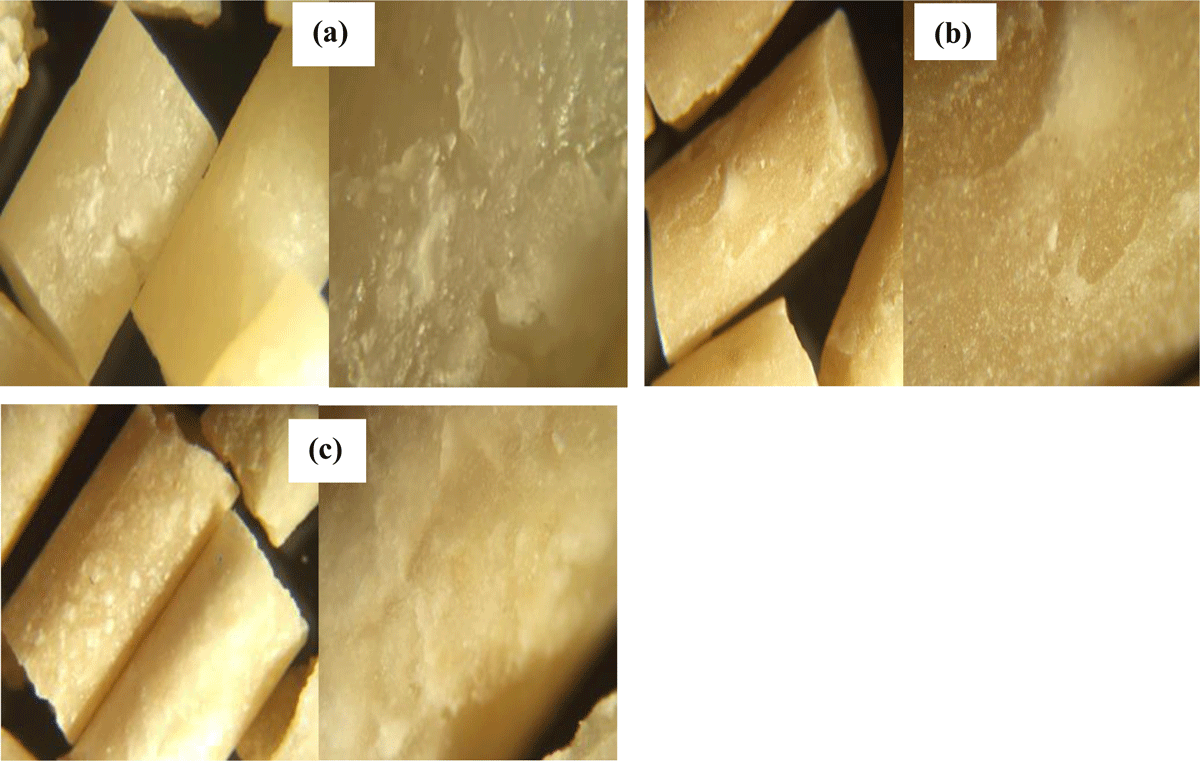
Figure 4
Image capture of prepared beads as observed under a light microscope with a magnification of 3.4 × 10: (a) pure PHB beads (b) PHB/cellulose beads (c) PHB/starch beads textures.
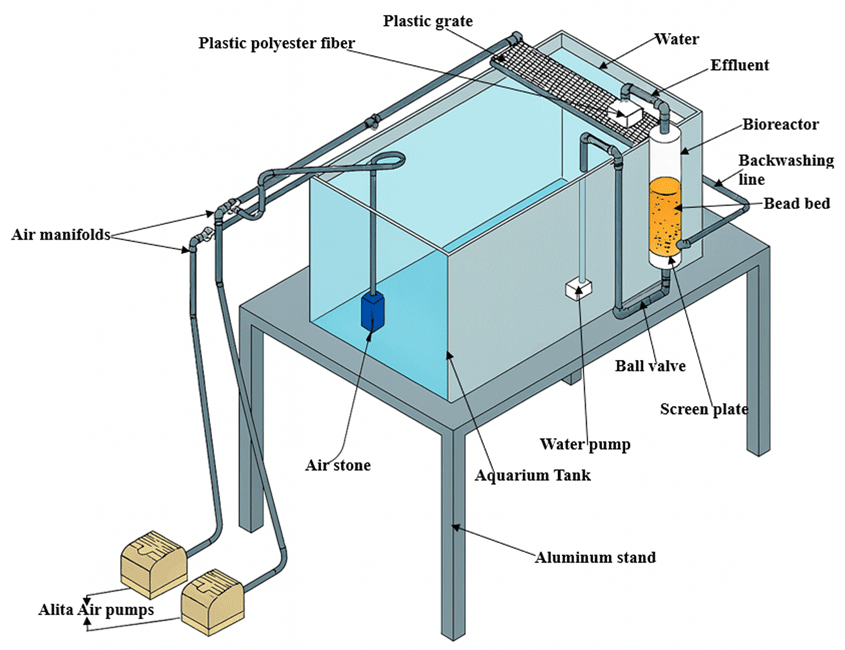
Figure 5
One of the seven systems configured for aerobic ammonia removal treatments.
Table 1
Nitrite (NO2–N) and nitrate (NO3–N) concentrations at the end of the experiment remained very low across all PHB blend treatments (n = 3).
| TREATMENT | INITIAL NO2–N (mg/L) | FINAL NO2–-N (mg/L) AVG ± SD | INITIAL NO3–N (mg/L) | FINAL NO3–-N (mg/L) AVG ± SD |
|---|---|---|---|---|
| PHB | 0.0 | 0.015 ± 0.009a | 0.0 | 0.143 ± 0.046a |
| PHB:C = 80:20 | 0.0 | 0.018 ± 0.002a | 0.0 | 0.172 ± 0.026a |
| PHB:C = 70:30 | 0.0 | 0.015 ± 0.01a | 0.0 | 0.158 ± 0.012a |
| PHB:C = 60:40 | 0.0 | 0.016 ± 0.012a | 0.0 | 0.140 ± 0.022a |
| PHB:S = 80:20 | 0.0 | 0.009 ± 0.042a | 0.0 | 0.153 ± 0.037a |
| PHB:S = 70:30 | 0.0 | 0.030 ± 0.002b | 0.0 | 0.176 ± 0.013a |
| PHB:S = 60:40 | 0.0 | 0.051 ± 0.007c | 0.0 | 0.123 ± 0.061a |
[i] Different superscript letters within the same column indicate statistically significant differences (p < 0.05).
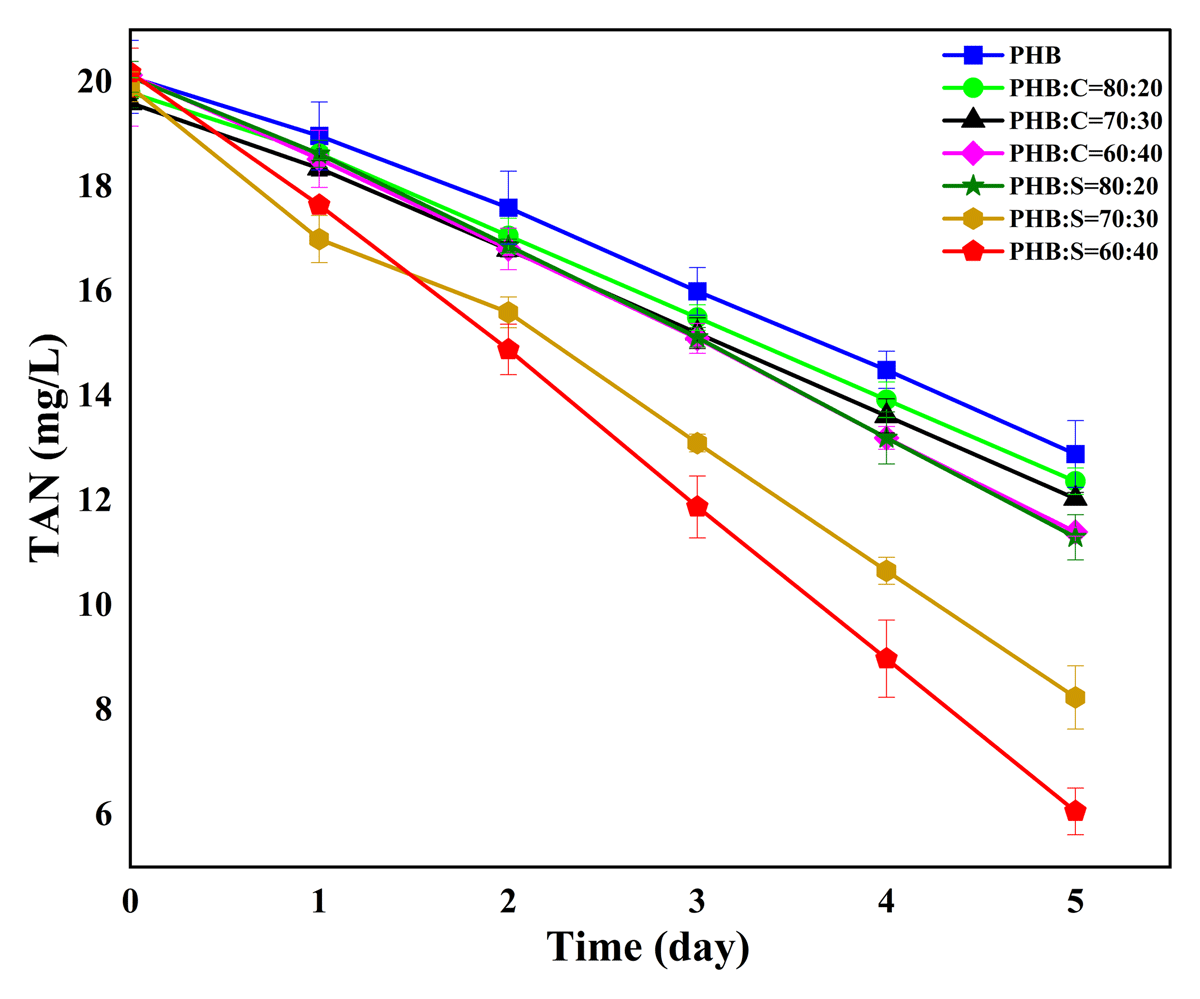
Figure 6
Decline in average TAN concentrations in reservoirs treated with PHB and blends containing varying ratios of PHB, starch (S), and cellulose (C).
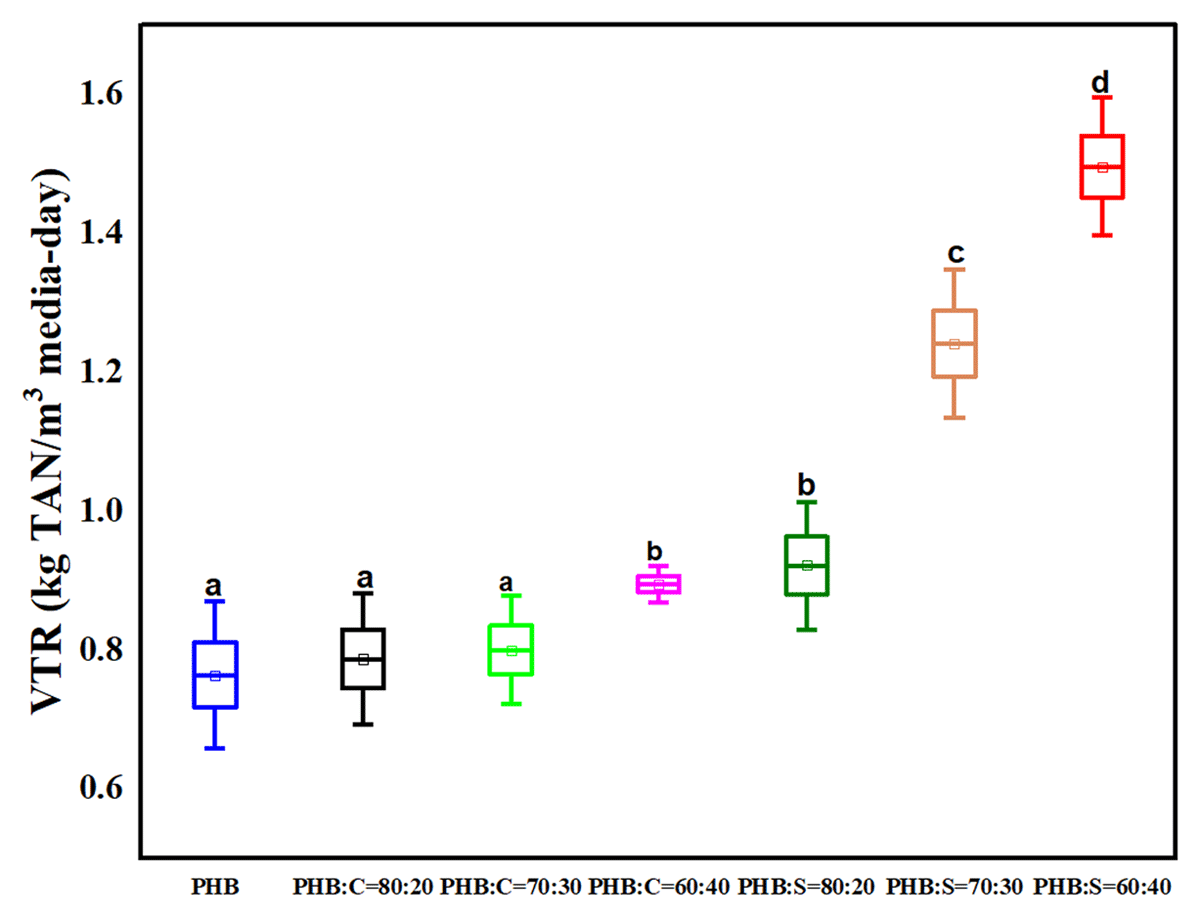
Figure 7
Volumetric TAN removal rates of PHB and PHB-blends. PHB:S blends exhibited higher VTRs compared to PHB and PHB:C blends, likely due to increased carbon release from starch solubility under aerobic conditions. Different letters on the boxes show statistical difference (p < 0.05).
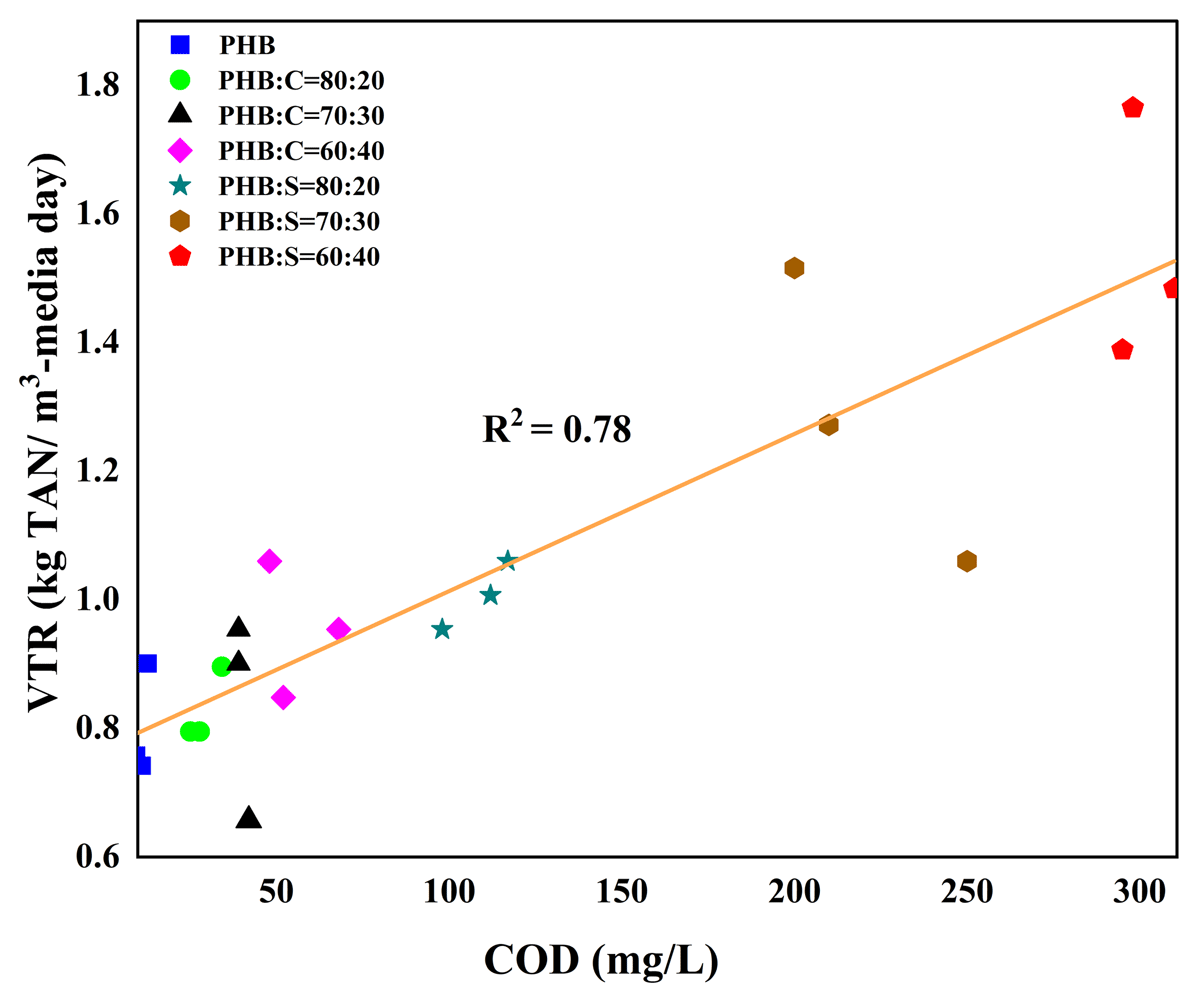
Figure 8
Linear regression analysis shows the relationship between COD accumulation and the volumetric TAN removal rate (VTR) across all PHB and PHB blends. COD release influenced ammonia conversion capacities (R² = 0.78).
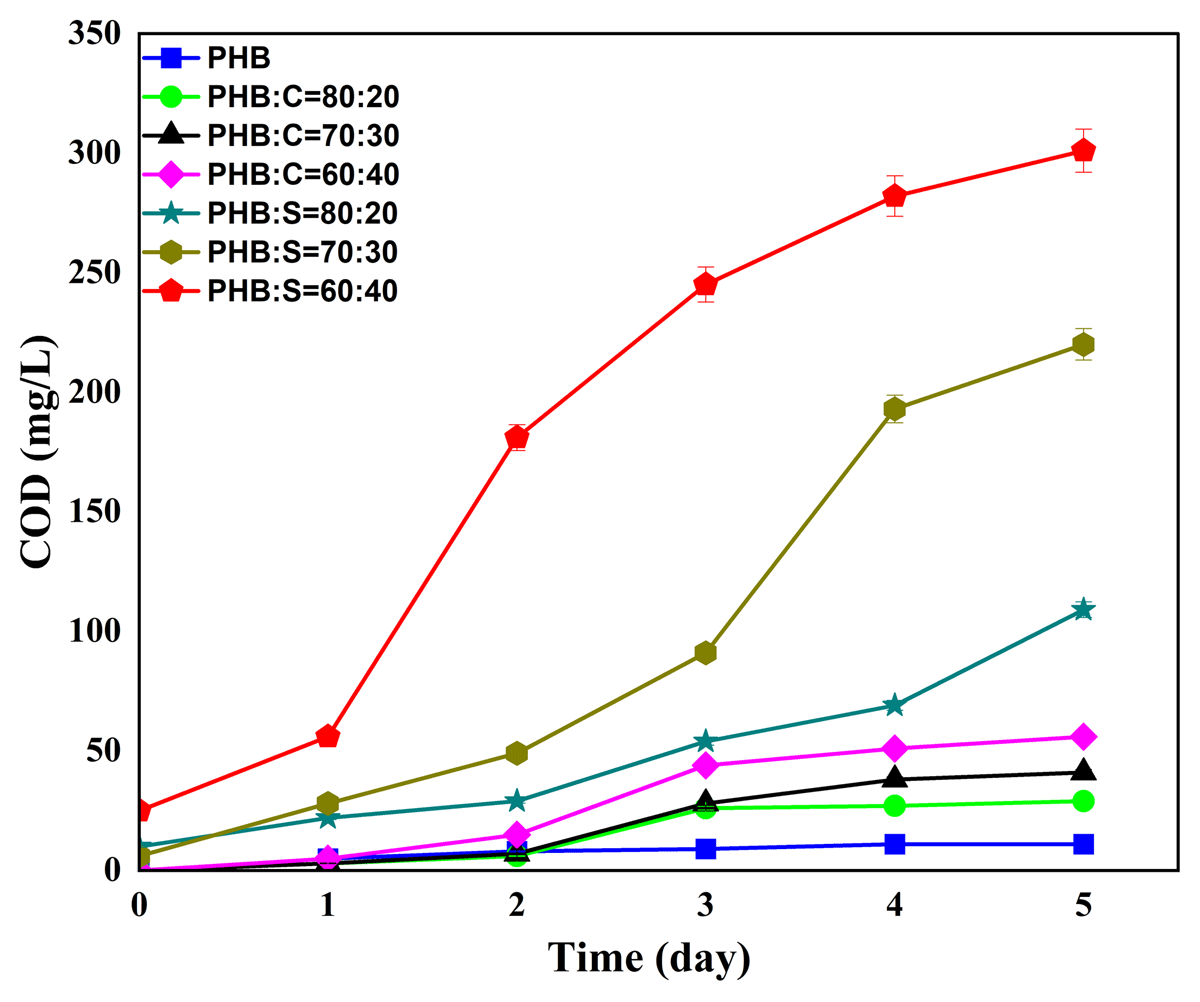
Figure 9
COD concentrations in the water reservoirs during the rate performance test for different PHB-based blend formulations. Results indicate that pure PHB is largely insoluble, whereas PHB:S blends exhibit high solubility and significant organic carbon release.
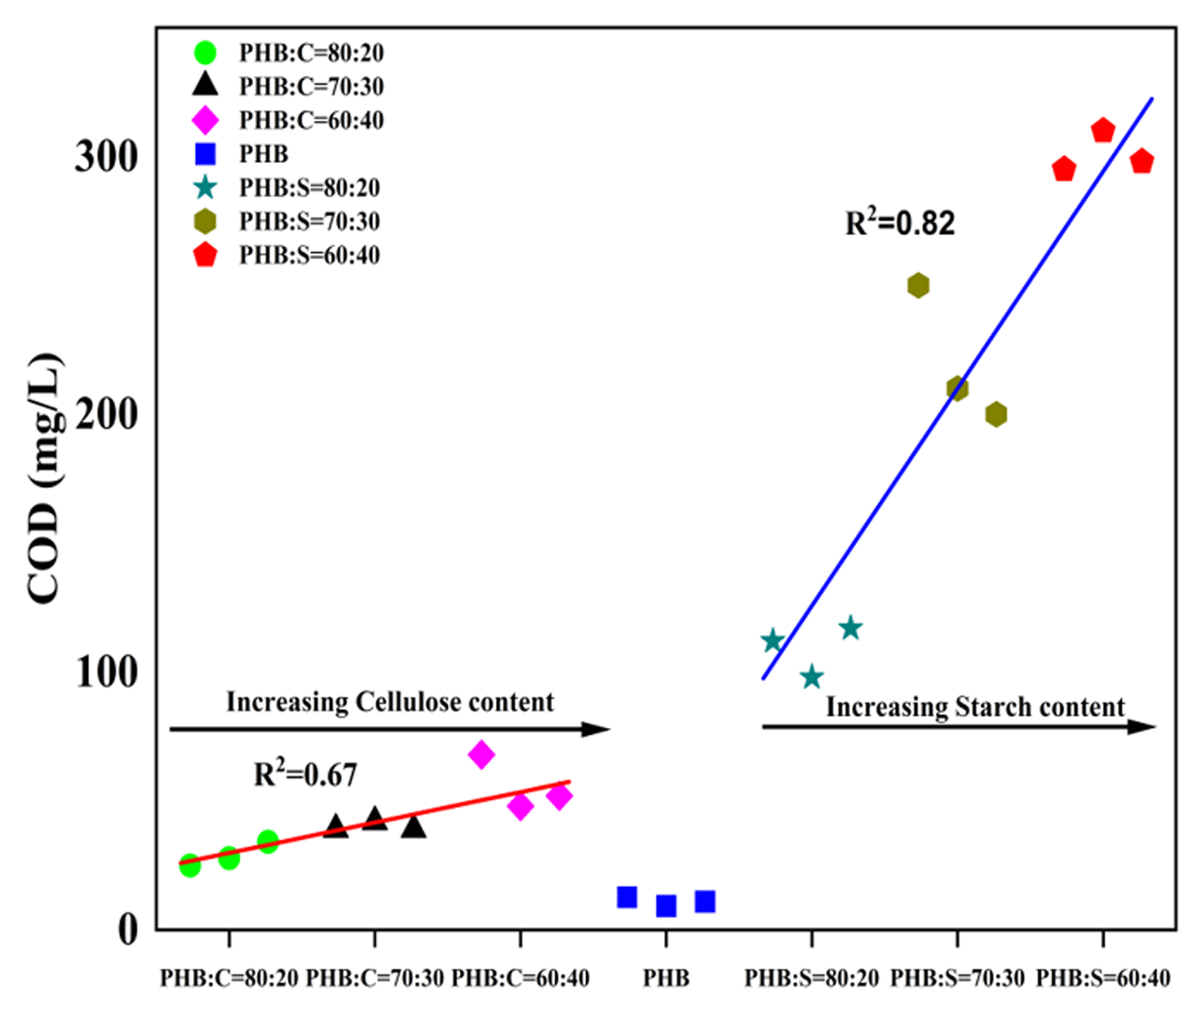
Figure 10
Effect of increasing cellulose and starch content in PHB-based blends on COD accumulation in the reservoirs. Cellulose addition showed a moderate increase in COD (R² = 0.67), while starch addition resulted in a sharp increase (R² = 0.82), indicating significantly higher organic carbon leaching.
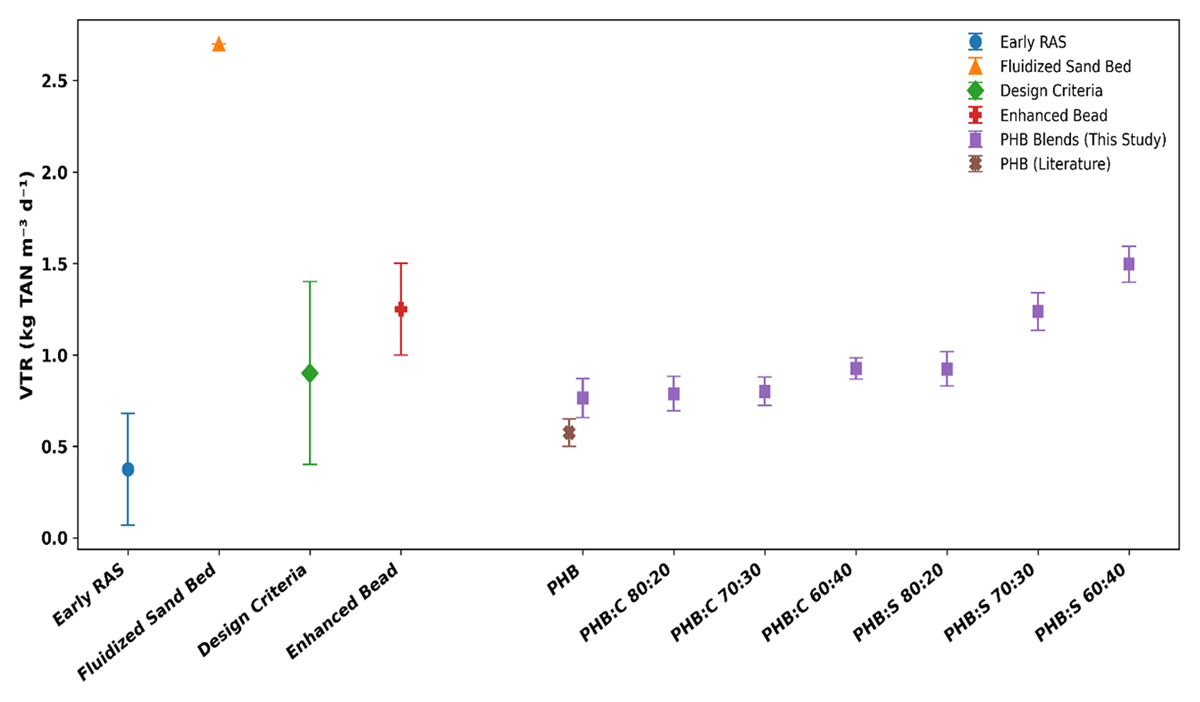
Figure 11
Volumetric TAN removal rates of conventional RAS biofilters reported in the literature and PHB-based blends investigated in this study. Error bars indicate reported ranges (literature) and standard deviations (experimental data).