Figure 1
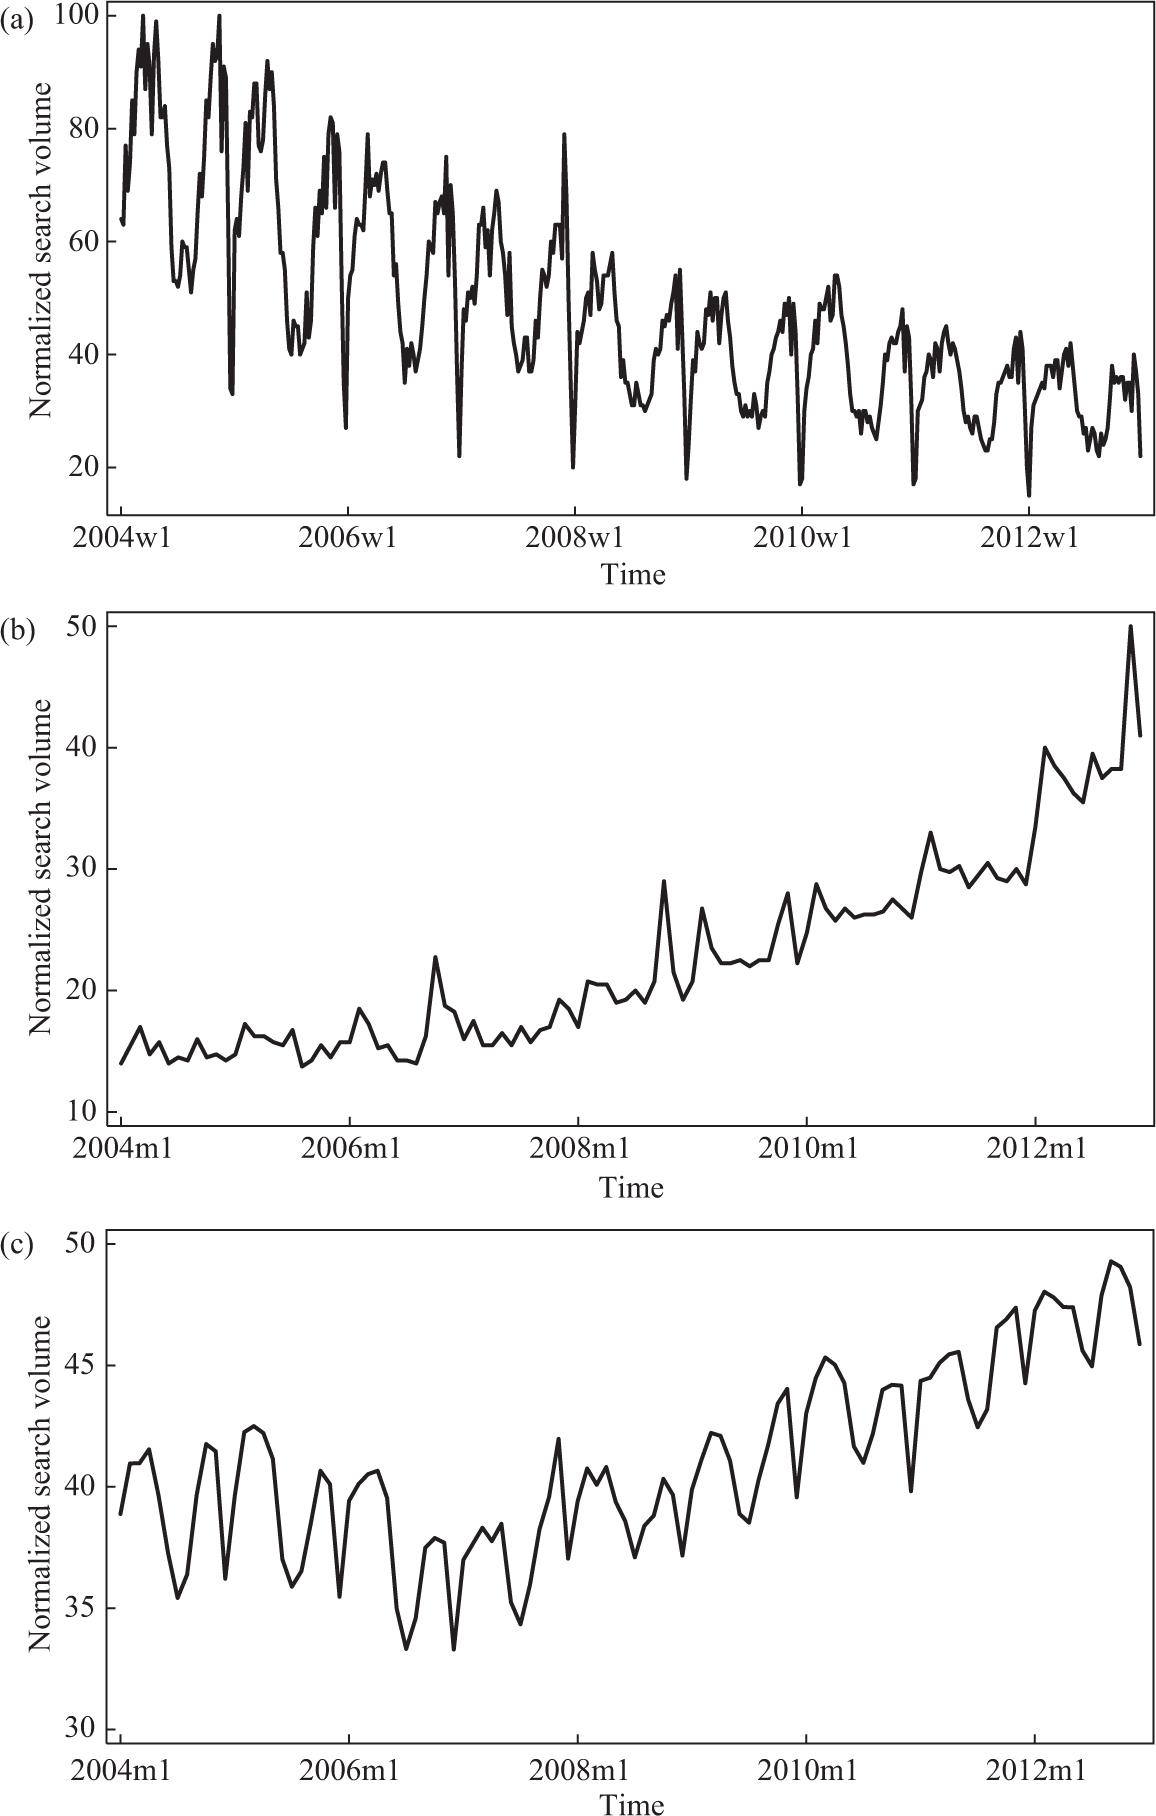
Figure 2
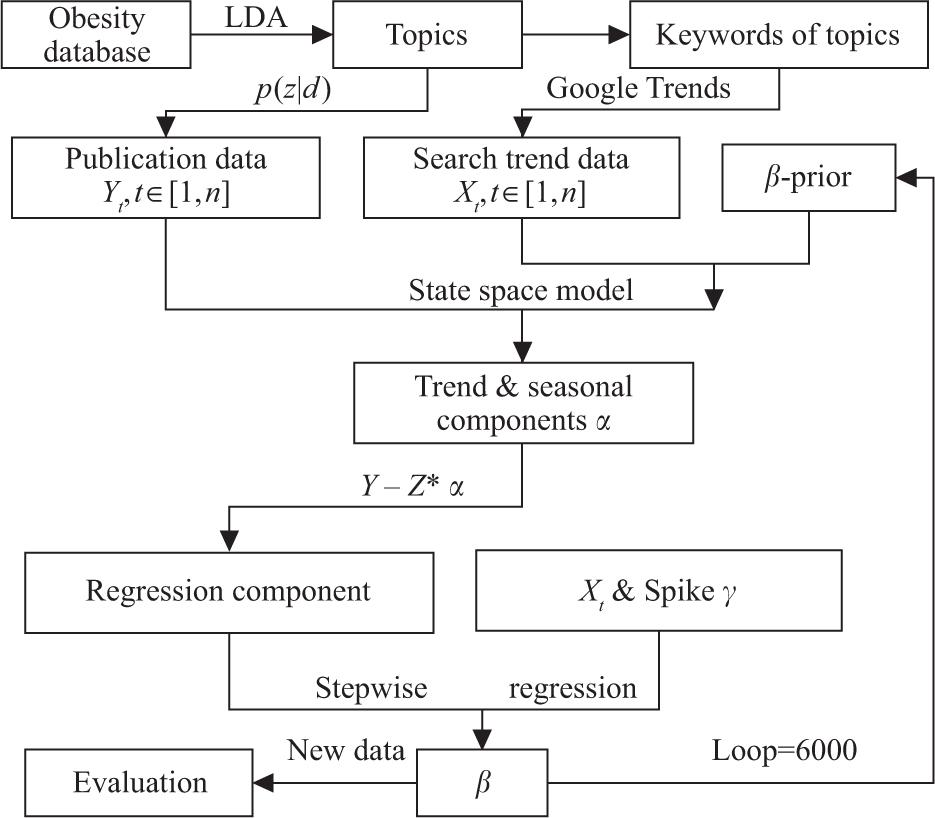
Figure 3
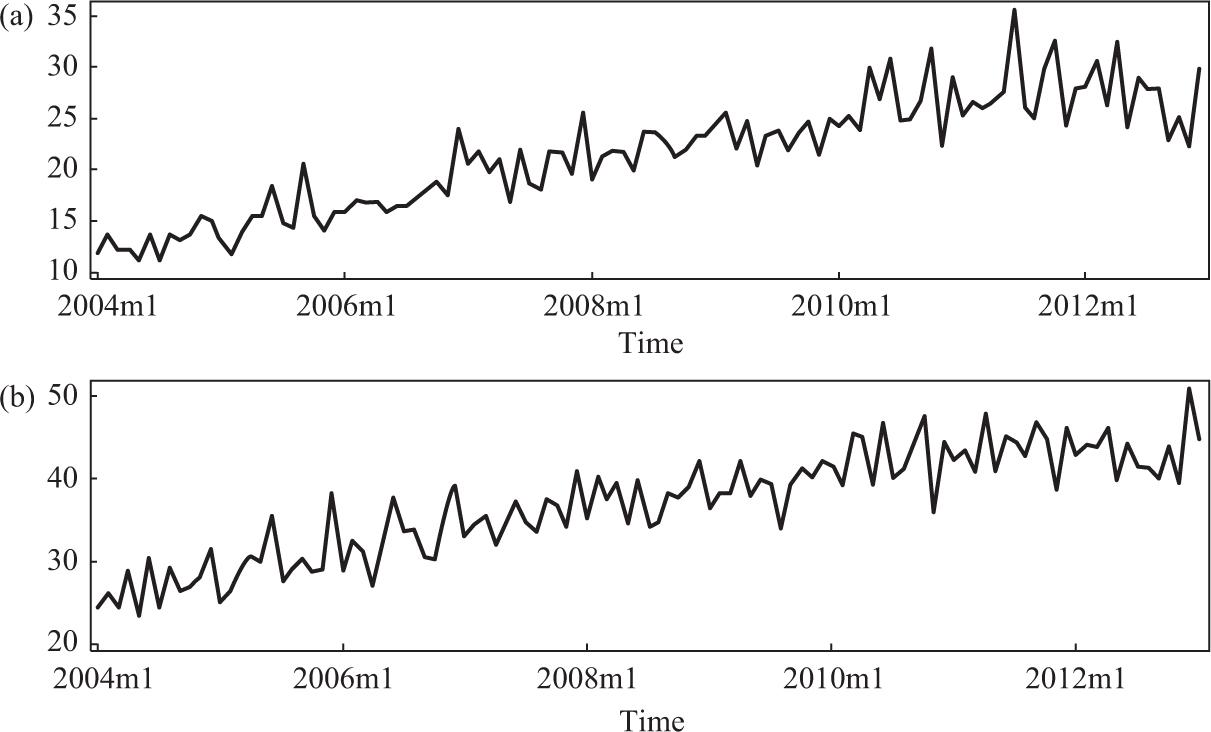
Figure 4
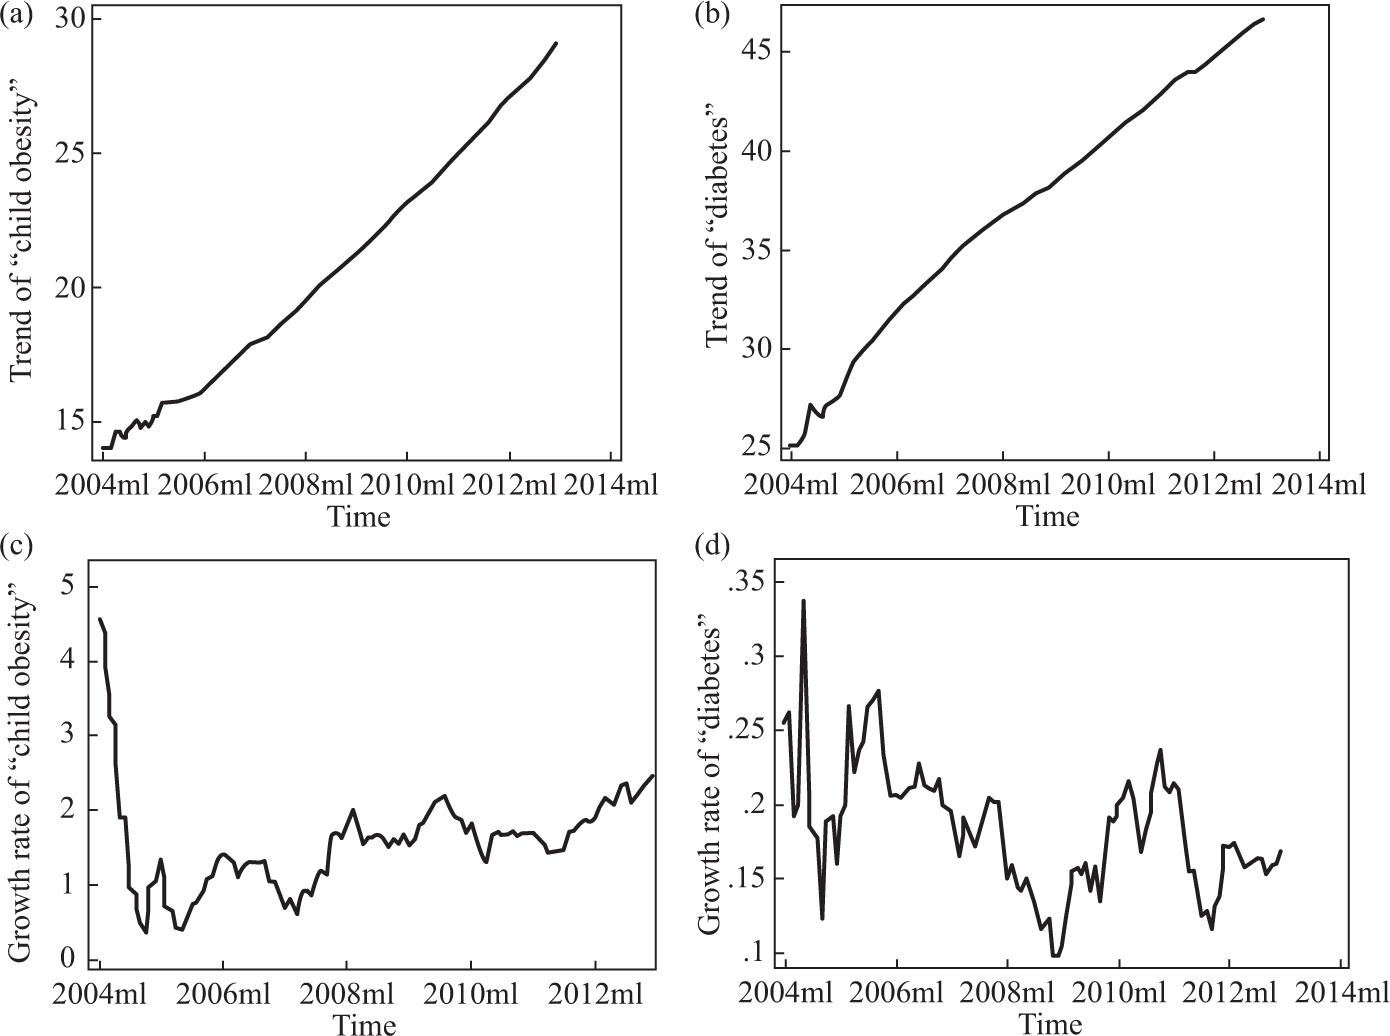
Figure 5
Figure 6

© 2017 Xianlei Dong, Jian Xu, Ying Ding, Chenwei Zhang, Kunpeng Zhang, Min Song, published by Chinese Academy of Sciences, National Science Library
This work is licensed under the Creative Commons Attribution-NonCommercial-NoDerivatives 4.0 License.