
Table 1:
Three groups of the design principles for CPR self-governance institutions.
| DP Group | DP | Description |
|---|---|---|
| DPG1: Rules | 1A | Clearly defined user boundaries |
| 1B | Clearly defined resource boundaries | |
| 2A | Congruence between local ecological and social conditions | |
| 2B | Congruence between provision and appropriation conditions | |
| DPG2: Rule enforcement | 4A | Effective monitoring users by other accountable users |
| 4B | Effective monitoring resources by accountable users | |
| 5 | Graduated sanctions for users who disobey the collective rules | |
| 6 | Effective and low-cost mechanism of conflict resolution | |
| DPG3: Rule-making arena | 3 | Participation of users in collective decision-making |
| 7 | Minimal recognition of rights to self-governance | |
| 8 | Multiple layers of nested enterprises |
Source: Based on Ostrom (1990) and Cox et al. (2010).

Figure 1:
Organization structure of the HIA.

Figure 2:
Theoretical framework.
Note: Based on Ostrom (2005, 15) and Clement (2010).
Table 2:
Measurements of outcome dimensions and descriptive statistics.
| Dimension | Survey questions (5 points: 1=absolutely no; 5=very yes) | Mean | S.D. |
|---|---|---|---|
| Provision – infrastructure | The status of irrigation infrastructure is good | 3.48 | 1.28 |
| The status of irrigation infrastructure is constantly improving | 3.73 | 1.38 | |
| Appropriation – sufficiency | The water use is adequate to me | 3.33 | 1.39 |
| The rule of water allocation can be complied efficiently | 3.58 | 1.37 | |
| Appropriation – equity | The process of water allocation is fair to me | 3.77 | 1.44 |
| There are few disputes related to water use | 4.06 | 1.39 | |
| The water use is usually timely for my irrigation needs | 4.20 | 1.27 |
Table 3:
Variables of the DPs, descriptive statistics and the results of Barnard’s test.
| DPG | DP | Variable | Definition | N | % of Present cases | P | AS | AE |
|---|---|---|---|---|---|---|---|---|
| DPG1 rules | DP1A clear user boundary | DP1A | The group of users is according to a traditional village (0=no; 1=yes) | 9 | 67% | n | ||
| (4 DPs, 8 Var.) | DP1B clear resource boundary | DP1B | The resource boundary is according to statistics of basin area (0=administrative; 1=hydraulic) | 9 | 44% | p | ||
| DP2A social-ecological fit | DP2A1 | The WUA was established by whom (0=top-down pushed; 1=made by user-selves) | 9 | 44% | ||||
| DP2A2 | Plans of water allocation and crops are made by whom (0=intervened or made by top-down authorities; 1=made by user-selves) | 9 | 67% | |||||
| DP2A3 | Plans of maintenance are made by whom (0=intervened or made by top-down authorities; 1=made by users themselves) | 9 | 56% | |||||
| DP2B cost-benefit fits | DP2B1 | The tasks of management are assigned by whom (0=intervened or made by top-down authorities; 1=made by user-selves) | 9 | 56% | ||||
| DP2B2 | The rules of service fees for users are made by whom (0=intervened or made by top-down authorities; 1=made by user-selves) | 9 | 56% | p | ||||
| DP2B3 | The rules of mainly financial issues for the whole WUA are made by whom (0=intervened or made by top-down authorities; 1=made by users themselves) | 9 | 33% | p | p | |||
| DPG2 rule enforce-ment | DP4A good resource monitoring | DP4A | There is monitoring on irrigated lands in accordance with bases of water pricing (0=no; 1=yes) | 9 | 33% | |||
| (4 DPs, 6 Var.) | DP4B good user monitoring | DP4B1 | Water payments are announced to WUA users (0=no; 1=yes) | 9 | 100% | – | – | – |
| DP4B2 | The WUA is self-monitored by internal monitors (0=no; 1=yes) | 9 | 56% | |||||
| DP5 graduated sanctions | DP51 | There are sanction measurements for water theft or interruption (0=non; 1=exist) | 9 | 44% | p | n | ||
| DP52 | There are compulsory measurements for collecting water payments (0=non; 1=exist) | 9 | 22% | n | ||||
| DP6 low-cost conflict solution | DP6 | There is a final mechanism for solving conflicts (0=non; 1=exist) | 9 | 100% | – | – | – | |
| DPG3 local rule-making arenas | DP3 collectively rule making | DP31 | The leader of the WUA was elected by (0=administrative appointment; 1=voting) | 9 | 78% | |||
| (3 DPs, 5 Var.) | DP32 | A total users conference was organized when the WUA was established (0=no; 1=yes) | 9 | 78% | ||||
| DP7 external recognition | DP7 | How long is the work duration for the WUA staff (0=shorter; 1=longer) | 9 | 67% | p | p | ||
| DP8 nested multiple governance | DP81 | The water supply contract is made with external water supply organization (0=no; 1=yes) | 9 | 56% | p | |||
| DP82 | There is collaboration with other organizations (0=no; 1=yes) | 9 | 11% | |||||
| DPG1 | Average presence of DPG1 | 9 | 56% | |||||
| DPG2 | Average presence of DPG2 | 9 | 56% | |||||
| DPG3 | Average presence of DPG3 | 9 | 67% |
Note: The columns of P, AS and AE are the results of the one-tail Barnard’s test (1945) between the DP variable presence and successful outcome dimensions, where “P” stands for “Provision”; “AS” stands for “Appropriation – Sufficiency”; “AE” stands for “Appropriation – Equity”; the p-values of the Barnard’s test (p<0.1) are marked there; “p” means significant positive correlation, while “n” means significant negative correlation. The full results of tests on the relations between each DP variable and outcomes can be found in Table A4.
Table 4:
Variables of the context, descriptive statistics and the results of Barnard’s test.
| Context | Variable | Definition | N | % of Present cases | P | AS | AE | |
|---|---|---|---|---|---|---|---|---|
| Biophysical attributes | Water scarcity | C1WS | Water resource conditions are good in the WUA (0=no; 1=yes) | 9 | 67% | |||
| Community attributes | Group size | C2GS | The number of users in the WUA is relatively small (0=no; 1=yes) | 9 | 44% | |||
| Agricultural dependency | C2AD | The agricultural income of farmers in the WUA has a higher percentage in the total income (0=no; 1=yes) | * | 44% | n | |||
| Authoritarianism | Resource intervention | C3RF | The WUA has financial support from government (0=no; 1=yes) | 9 | 33% | n | n | |
| C3RP | The property of infrastructure belongs to the government or the HIA (0=no; 1=yes) | 9 | 56% | n | ||||
| C3RW | The place of working is provided by the government or the HIA (0=no; 1=yes) | 9 | 56% | |||||
| C3R | There is resource input externally. (0=no; 1=yes) | 9 | 67% | n | ||||
| Leadership intervention | C3L | The identity of the leader of the WUA is the farmer or the cadre (0=farmer; 1=cadre) | 9 | 44% | p | p |
Note: The columns of P, AS and AE are the results of the one-tail Barnard’s test (1945) between the DP variable presences and successful outcome dimensions, where “P” stands for “Provision”; “AS” stands for “Appropriation – Sufficiency”; “AE” stands for “Appropriation – Equity”; the p-values of the Barnard’s test (p<0.1) are marked there; “p” means significant positive correlation, while “n” means significant negative correlation. The full results of tests on the relations between each DP variable and outcomes can be found in Table A4.
*The data are calculated from the 332-user questionnaire surveys. They were asked of their agricultural income and the total income. Then, the agricultural dependency of the 9 WUAs averaged the user data by each WUA, came to divide the two and it is transferred into binary one, assigning as 1 when the value is larger than the average and as 0 when smaller.

Figure 3:
The Outcomes (Rotated Factor Scores) and the DPGs of the WUAs.
Note: “P” stands for “Provision”; “AS” stands for “Appropriation – Sufficiency”; “AE” stands for “Appropriation – Equity”; “DPG” stands for “design principle group”.
Table 5:
Difference in success rating depending on outcome dimensions and number of DPs.
| Provision – Infrastructure | Appropriation – Sufficiency | Appropriation – Equity | |
|---|---|---|---|
| Less than 6 | 0.00% | 20.00% | 0.00% |
| More than 8 | 100.00% | 60.00% | 80.00% |
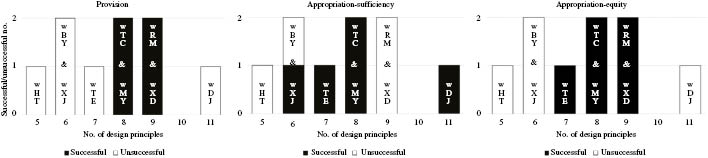
Figure 4:
Number of successful and unsuccessful cases by number of DPs, and by outcome dimension.
Table 6:
Percentage of present cases contributing to the significance by authoritarian interventions.
| Total | R | L | B | R | L | B | R | L | B | R | L | B | ||
|---|---|---|---|---|---|---|---|---|---|---|---|---|---|---|
| DP1A | 67 | 60 | 100 | 0 | Success | – | – | – | 33 | 100 | 0 | – | – | – |
| Failure | – | – | – | 100 | 100 | – | – | – | – | |||||
| DP1B | 44 | 40 | 67 | 0 | Success | 100 | 67 | 0 | – | – | – | – | – | – |
| Failure | 25 | – | 0 | – | – | – | – | – | – | |||||
| DP2B2 | 56 | 40 | 67 | 100 | Success | – | – | – | 67 | 100 | 100 | – | – | – |
| Failure | – | – | – | 0 | 50 | – | – | – | – | |||||
| DP2B3 | 33 | 0 | 100 | 0 | Success | 0 | 100 | 0 | – | – | – | 0 | 100 | 0 |
| Failure | 0 | – | 0 | – | – | – | 0 | – | – | |||||
| DP51 | 44 | 40 | 67 | 0 | Success | 100 | 67 | 0 | 33 | 0 | 0 | – | – | – |
| Failure | 25 | – | 0 | 50 | 100 | – | – | – | – | |||||
| DP52 | 22 | 40 | 0 | 0 | Success | – | – | – | – | – | – | 0 | 0 | 0 |
| Failure | – | – | – | – | – | – | 50 | – | – | |||||
| DP7 | 67 | 40 | 100 | 100 | Success | 100 | 100 | 0 | – | – | – | 100 | 100 | 100 |
| Failure | 25 | – | 0 | – | – | – | 25 | – | – | |||||
| DP81 | 56 | 60 | 33 | 100 | Success | – | – | – | 100 | 33 | 100 | – | – | – |
| Failure | – | – | – | 0 | 0 | – | – | – | – |
Note: (1) The variable definitions, the direction and the significances of the Barnard’s test can be found in Tables 3 and 4 and Table A4. (2) The “P”, “AS”, “AE”, “R”, “L” and “B” stand respectively for “Provision”, “Appropriation – Sufficiency”, “Appropriation – Equity”, “Resource Intervention”, “Leadership Intervention” and “Both”. (3) WUAs intervened by resource interventions are wTC, wXJ, wDJ, wBY and wHT, by leadership interventions are wRM, wXD and wMY. The WUA of wTE is intervened by both. (4) The variables of highlight blanks are significantly negative related to the outcome; others are significantly positive to the outcome. (5) The % of present cases contributing to the significance is counted based on the original data in Table A2; For each significant DP variable, the value is the number of DP present and success/failure cases divided by the number of total success/failure cases under the intervention.
Table 7:
Success configurations for each outcome dimension by interventions.
| Interventions | Provision | Appropriation – Sufficiency | Appropriation – Equity |
|---|---|---|---|
| Only resource | Non-self-crafting rules | (1) Non-self-crafting rules | Non-self-crafting rules |
| AND | AND | AND | |
| Internal rule enforcement | Internal rule enforcement | Internal rule enforcement | |
| AND | AND | AND | |
| Nested autonomous rule-making arena | Nested autonomous rule-making arena | Nested autonomous rule-making arena | |
| OR | |||
| (2) Self-crafting rules | |||
| AND | |||
| Nested autonomous rule-making arena | |||
| Only leadership | (1) Self-crafting rules | Self-crafting rules | (1) Self-crafting rules |
| AND | AND | AND | |
| Non-internal rule enforcement | Non-internal rule enforcement | Non-internal rule enforcement | |
| AND | AND | AND | |
| Loose autonomous rule-making arena | Loose autonomous rule-making arena | Loose autonomous rule-making arena | |
| (2) Internal rule enforcement mechanisms | (2) Internal rule enforcement mechanisms | ||
| AND | AND | ||
| Nested autonomous rule-making arena | Nested autonomous rule-making arena | ||
| Both | – | Non-self-crafting rules | Non-self-crafting rules |
| AND | AND | ||
| Non-internal rule enforcement | Nested autonomous rule-making arena | ||
| AND | |||
| Nested autonomous rule-making arena |
Table A1:
Information of the case WUAs and related users.
| County | Town | Admin. station | WUA | Number of users | Admin. village | Number of sampled users | Date of field researches | |
|---|---|---|---|---|---|---|---|---|
| W | XGZ | aZH | wRM | 2915 | YL | 4 | 4 | A.M., July 22, 2015 |
| TEH | aFJ | wTE | 4702 | CG | 14 | 14 | P.M., July 22, 2015 | |
| L | WLTK | aYG | wXJ | 5467 | DX | 22 | 31 | A.M., July 23, 2015 |
| XG | 9 | A.M., July 23, 2015 | ||||||
| WLTK | wDJ | 2974 | XM | 23 | 23 | P.M., July 23, 2015 | ||
| WLTK & XH | aYJ | wTC | 2704 | LS& LQ | 94 | 94 | ALL, July 24, 2015 | |
| XH | wMY | 2385 | LS | 13 | 13 | A.M., July 24, 2015 | ||
| D | DK | aDF | wXD | 3165 | XD | 21 | 48 | A.M., July 25, 2015 |
| YS | 27 | A.M., July 25, 2015 | ||||||
| LSH | wHT | 2850 | HTTH | 33 | 61 | P.M., July 25, 2015 | ||
| XC | 6 | P.M., July 25, 2015 | ||||||
| HZY | 14 | P.M., July 25, 2015 | ||||||
| HQ | 8 | P.M., July 25, 2015 | ||||||
| SJTH | aWS | wBY | 3416 | BYMD | 44 | 44 | A.M., July 26, 2015 | |
| 3 Counties | 7 Towns | 6 Stations | 9 WUAs | 14 Villages | 332 Users | |||
Note: (1) The dataset includes 332 questionnaires of farming households and 9 questionnaires of WUA leaders along with in-depth interview transcripts of 9 WUA leaders and 6 administrators. (2) They were collected by China Institute for Rural Studies (CIRS) of Tsinghua University at the Hetao Irrigated Area (HIA) in Inner Mongolia province in July 2015. (3) The source of the number of users of each WUA was provided by the HIA in 2015.
Table A2:
Rotated factor loadings for the outcomes of the WUAs.
| N=332 | Mean | S.D. | Infrastructure | Sufficiency | Equity |
|---|---|---|---|---|---|
| The status of irrigation infrastructures is good. | 3.48 | 1.28 | 0.815 | ||
| The status of irrigation infrastructures is constantly improved. | 3.73 | 1.38 | 0.851 | ||
| The water using is adequate to me. | 3.33 | 1.39 | 0.800 | ||
| The rule of water allocation can be complied efficiently. | 3.58 | 1.37 | 0.780 | ||
| The processes of water allocation are fair to me. | 3.77 | 1.44 | 0.761 | ||
| There are few disputes in water using. | 4.06 | 1.39 | 0.698 | ||
| The water using are usually timely for my irrigation needs. | 4.20 | 1.27 | 0.551 | ||
| Cronbach’s alpha (internal consistency) | α0.609 | α0.458 | α0.409 | ||
| Variance explained (total: 60%) | 30% | 13% | 17% |
Note: Bartlett test of the sphericity=199.534, p=0.000, Kaiser-Meyer-Olkin (KMO) statistic=0.674.
Extraction method: principal component analysis. Rotation method: varimax with Kaiser normalization.
Table A3:
Crisp-set values of all the authoritarian context, the DPs and the outcomes.
| Dimension | Variable | wTC | wXJ | wDJ | wBY | wHT | wTE | wRM | wXD | wMY |
|---|---|---|---|---|---|---|---|---|---|---|
| Outcomes (rotated factor scores) | ||||||||||
| Provision | P | 1.44 | 0.64 | 0.71 | 0.95 | 0.65 | 0.33 | 1.82 | 1.24 | 1.19 |
| Appropriation | AS | 1.17 | 1.29 | 1.24 | 0.46 | 0.98 | 1.57 | 0.87 | 0.89 | 1.25 |
| AE | 1.04 | 0.76 | 0.77 | 0.59 | 0.82 | 1.33 | 1.67 | 1.37 | 1.36 | |
| Outcomes (transferred to crisp sets) | ||||||||||
| Provision | Pcs | 1 | 0 | 0 | 0 | 0 | 0 | 1 | 1 | 1 |
| Appropriation | AScs | 1 | 1 | 1 | 0 | 0 | 1 | 0 | 0 | 1 |
| AEcs | 1 | 0 | 0 | 0 | 0 | 1 | 1 | 1 | 1 | |
| DPs | ||||||||||
| Rules | DP1A | 0 | 0 | 1 | 1 | 1 | 0 | 1 | 1 | 1 |
| DP1B | 1 | 0 | 1 | 0 | 0 | 0 | 0 | 1 | 1 | |
| DP2A1 | 1 | 1 | 0 | 0 | 1 | 1 | 0 | 0 | 0 | |
| DP2A2 | 0 | 1 | 1 | 0 | 0 | 1 | 1 | 1 | 1 | |
| DP2A3 | 0 | 1 | 1 | 0 | 0 | 0 | 1 | 1 | 1 | |
| DP2B1 | 0 | 1 | 1 | 0 | 0 | 0 | 1 | 1 | 1 | |
| DP2B2 | 0 | 1 | 1 | 0 | 0 | 1 | 0 | 1 | 1 | |
| DP2B3 | 0 | 0 | 0 | 0 | 0 | 0 | 1 | 1 | 1 | |
| Rule enforcement | DP4A | 0 | 0 | 1 | 1 | 0 | 0 | 1 | 0 | 0 |
| DP4B1 | 1 | 1 | 1 | 1 | 1 | 1 | 1 | 1 | 1 | |
| DP4B2 | 1 | 1 | 0 | 0 | 1 | 0 | 0 | 1 | 0 | |
| DP51 | 1 | 0 | 0 | 1 | 0 | 0 | 1 | 1 | 0 | |
| DP52 | 0 | 0 | 1 | 1 | 0 | 0 | 0 | 0 | 0 | |
| DP6 | 1 | 1 | 1 | 1 | 1 | 1 | 1 | 1 | 1 | |
| Local rule-making arena | DP31 | 1 | 1 | 1 | 1 | 0/1 | 1 | 1 | 1 | 0 |
| DP32 | 1 | 1 | 1 | 1 | 1 | 0 | 1 | 1 | 0 | |
| DP7 | 1 | 0 | 1 | 0 | 0 | 1 | 1 | 1 | 1 | |
| DP81 | 1 | 1 | 1 | 0 | 0 | 1 | 0 | 0 | 1 | |
| DP82 | 1 | 0 | 0 | 0 | 0 | 0 | 0 | 0 | 0 | |
| No. of DP presence | 8 | 6 | 11 | 6 | 5 | 7 | 9 | 9 | 8 | |
| DPs’ grouping | ||||||||||
| DPG1R | 0.25 | 0.63 | 0.75 | 0.13 | 0.25 | 0.38 | 0.63 | 0.75 | 0.88 | |
| DPG2RE | 0.67 | 0.50 | 0.83 | 0.83 | 0.50 | 0.33 | 0.67 | 0.67 | 0.33 | |
| DPG3LRA | 1.00 | 0.60 | 0.80 | 0.40 | 0.20 | 0.60 | 0.60 | 0.60 | 0.40 | |
| DPs’ grouping (transferred to crisp sets) | ||||||||||
| DPG1 | 0 | 1 | 1 | 0 | 0 | 0 | 1 | 1 | 1 | |
| DPG2 | 1 | 0 | 1 | 1 | 0 | 0 | 1 | 1 | 0 | |
| DPG3 | 1 | 1 | 1 | 0 | 0 | 1 | 1 | 1 | 0 | |
| Context | ||||||||||
| Biophysical | C1WS | 1 | 1 | 1 | 0 | 1 | 0 | 0 | 1 | 1 |
| Community | C2GS | 1 | 0 | 1 | 0 | 1 | 0 | 0 | 0 | 1 |
| C2AD | 1 | 0 | 0 | 1 | 1 | 0 | 0 | 1 | 0 | |
| Authoritarianism | C3RF | 0 | 1 | 0 | 1 | 1 | 0 | 0 | 0 | 0 |
| C3RP | 1 | 1 | 0 | 1 | 1 | 1 | 0 | 0 | 0 | |
| C3RW | 1 | 1 | 1 | 1 | 0 | 0 | 0 | 0 | 0 | |
| C3R | 1 | 1 | 1 | 1 | 1 | 1 | 0 | 0 | 0 | |
| C3L | 0 | 0 | 0 | 0 | 0 | 1 | 1 | 1 | 1 | |
Table A4:
Relation between each DP, DPG, context and outcome in the cases analyzed.
| 1 | 0 | 1 | 0 | 1 | 0 | |||||||||||
|---|---|---|---|---|---|---|---|---|---|---|---|---|---|---|---|---|
| DP1A | Success | 3 | 1 | 0.39 | 56% | 1.3 | 2 | 3 | 0.04* | 22% | 0.3 | 3 | 2 | 0.41 | 44% | 0.8 |
| Failure | 3 | 2 | 4 | 0 | 3 | 1 | ||||||||||
| DP1B | Success | 3 | 1 | 0.09* | 78% | 3.5 | 3 | 2 | 0.20 | 67% | 2.0 | 3 | 2 | 0.20 | 67% | 2.0 |
| Failure | 1 | 4 | 1 | 3 | 1 | 3 | ||||||||||
| DP2A1 | Success | 1 | 3 | 0.20 | 33% | 0.5 | 3 | 2 | 0.20 | 67% | 2.0 | 2 | 3 | 0.46 | 44% | 0.8 |
| Failure | 3 | 2 | 1 | 3 | 2 | 2 | ||||||||||
| DP2A2 | Success | 3 | 1 | 0.39 | 56% | 1.3 | 4 | 1 | 0.25 | 67% | 2.0 | 4 | 1 | 0.25 | 67% | 2.0 |
| Failure | 3 | 2 | 2 | 2 | 2 | 2 | ||||||||||
| DP2A3 | Success | 3 | 1 | 0.20 | 67% | 2.0 | 3 | 2 | 0.46 | 56% | 1.3 | 3 | 2 | 0.46 | 56% | 1.3 |
| Failure | 2 | 3 | 2 | 2 | 2 | 2 | ||||||||||
| DP2B1 | Success | 3 | 1 | 0.20 | 67% | 2.0 | 3 | 2 | 0.46 | 56% | 1.3 | 3 | 2 | 0.46 | 56% | 1.3 |
| Failure | 2 | 3 | 2 | 2 | 2 | 2 | ||||||||||
| DP2B2 | Success | 2 | 2 | 0.46 | 44% | 0.8 | 4 | 1 | 0.09* | 78% | 3.5 | 3 | 2 | 0.46 | 56% | 1.3 |
| Failure | 3 | 2 | 1 | 3 | 2 | 2 | ||||||||||
| DP2B3 | Success | 3 | 1 | 0.01* | 89% | 8.0 | 1 | 4 | 0.25 | 33% | 0.5 | 3 | 2 | 0.04* | 78% | 3.5 |
| Failure | 0 | 5 | 2 | 2 | 0 | 4 | ||||||||||
| DP4A | Success | 1 | 3 | 0.39 | 44% | 0.8 | 1 | 4 | 0.25 | 33% | 0.5 | 1 | 4 | 0.25 | 33% | 0.5 |
| Failure | 2 | 3 | 2 | 2 | 2 | 2 | ||||||||||
| DP4B1 | Success | 4 | 0 | 0.50 | 44% | 0.8 | 5 | 0 | 0.50 | 56% | 1.3 | 5 | 0 | 0.50 | 56% | 1.3 |
| Failure | 5 | 0 | 4 | 0 | 4 | 0 | ||||||||||
| DP4B2 | Success | 2 | 2 | 0.46 | 56% | 1.3 | 2 | 3 | 0.46 | 44% | 0.8 | 2 | 3 | 0.46 | 44% | 0.8 |
| Failure | 2 | 3 | 2 | 2 | 2 | 2 | ||||||||||
| DP51 | Success | 3 | 1 | 0.09* | 78% | 3.5 | 1 | 4 | 0.09* | 22% | 0.3 | 3 | 2 | 0.20 | 67% | 2.0 |
| Failure | 1 | 4 | 3 | 1 | 1 | 3 | ||||||||||
| DP52 | Success | 0 | 4 | 0.50 | 56% | 1.3 | 1 | 4 | 0.50 | 44% | 0.8 | 0 | 5 | 0.06* | 22% | 0.3 |
| Failure | 0 | 5 | 1 | 3 | 2 | 2 | ||||||||||
| DP6 | Success | 4 | 0 | 0.50 | 44% | 0.8 | 5 | 0 | 0.50 | 56% | 1.3 | 5 | 0 | 0.50 | 56% | 1.3 |
| Failure | 5 | 0 | 4 | 0 | 4 | 0 | ||||||||||
| DP31 | Success | 3 | 1 | 0.46 | 44% | 0.8 | 4 | 1 | 0.50 | 56% | 1.3 | 4 | 1 | 0.50 | 56% | 1.3 |
| Failure | 4 | 1 | 3 | 1 | 3 | 1 | ||||||||||
| DP32 | Success | 3 | 1 | 0.46 | 44% | 0.8 | 3 | 2 | 0.13 | 33% | 0.5 | 3 | 2 | 0.13 | 33% | 0.5 |
| Failure | 4 | 1 | 4 | 0 | 4 | 0 | ||||||||||
| DP7 | Success | 4 | 0 | 0.05* | 78% | 3.5 | 4 | 1 | 0.25 | 67% | 2.0 | 5 | 0 | 0.01* | 89% | 8.0 |
| Failure | 2 | 3 | 2 | 2 | 1 | 3 | ||||||||||
| DP81 | Success | 2 | 2 | 0.46 | 44% | 0.8 | 5 | 0 | 0.00* | 100% | – | 3 | 2 | 0.46 | 56% | 1.3 |
| Failure | 3 | 2 | 0 | 4 | 2 | 2 | ||||||||||
| DP82 | Success | 1 | 3 | 0.18 | 67% | 2.0 | 1 | 4 | 0.32 | 56% | 1.3 | 1 | 4 | 0.32 | 56% | 1.3 |
| Failure | 0 | 5 | 0 | 4 | 0 | 4 | ||||||||||
| DPG1 | Success | 3 | 1 | 0.20 | 67% | 2 | 3 | 2 | 0.46 | 56% | 1.25 | 3 | 2 | 0.17 | 56% | 1.25 |
| Failure | 2 | 3 | 2 | 2 | 2 | 2 | ||||||||||
| DPG2 | Success | 3 | 1 | 0.20 | 67% | 2 | 2 | 3 | 0.20 | 33% | 0.5 | 3 | 2 | 0.17 | 56% | 1.25 |
| Failure | 2 | 3 | 3 | 1 | 2 | 2 | ||||||||||
| DPG3 | Success | 3 | 1 | 0.39 | 56% | 1.25 | 4 | 1 | 0.25 | 67% | 2 | 4 | 1 | 0.05 | 67% | 2 |
| Failure | 3 | 2 | 2 | 2 | 2 | 2 |
| 1 | 0 | 1 | 0 | 1 | 0 | |||||
|---|---|---|---|---|---|---|---|---|---|---|
| C1WS | Success | 3 | 1 | 0.39 | 4 | 1 | 0.25 | 3 | 2 | 0.46 |
| Failure | 3 | 2 | 2 | 2 | 3 | 1 | ||||
| C2GS | Success | 2 | 2 | 0.46 | 3 | 2 | 0.20 | 2 | 3 | 0.46 |
| Failure | 2 | 3 | 1 | 3 | 2 | 2 | ||||
| C2AD | Success | 2 | 2 | 0.46 | 1 | 4 | 0.09* | 2 | 3 | 0.25 |
| Failure | 2 | 3 | 3 | 1 | 2 | 2 | ||||
| C3RF | Success | 0 | 4 | 0.05* | 1 | 4 | 0.25 | 0 | 5 | 0.41 |
| Failure | 3 | 2 | 2 | 2 | 3 | 1 | ||||
| C3RP | Success | 1 | 3 | 0.09 | 3 | 2 | 0.46 | 2 | 3 | 0.46 |
| Failure | 4 | 1 | 2 | 2 | 3 | 1 | ||||
| C3RW | Success | 1 | 3 | 0.20* | 3 | 2 | 0.20 | 1 | 4 | 0.46 |
| Failure | 3 | 2 | 1 | 3 | 3 | 1 | ||||
| C3R | Success | 1 | 3 | 0.01* | 4 | 1 | 0.25 | 2 | 3 | 0.01* |
| Failure | 5 | 0 | 2 | 2 | 4 | 1 | ||||
| C3L | Success | 3 | 1 | 0.09* | 2 | 3 | 0.46 | 4 | 1 | 0.20 |
| Failure | 1 | 4 | 2 | 2 | 0 | 4 |
Note: (1) The “DP” stands for “design principle”, whose variables were formulated following the of Cox et al. (2010) and the contents of the variables can be found on Tables 3 and 4 of the main text. (2) the column of “p-values” is one-tail Barnard’s test (1945) between the DP variable presences and successful outcome dimensions and “*” is marked as “p<0.1”; the p-values are produced by an online calculator (https://scistatcalc.blogspot.com/2013/11/barnards-test-calculator.html). (3) The “Conformity” means the ratio of supportive case number (main diagonal) to the total case size (9 case WUAs) according to the DP theory. (4) The “ratio” means the number of supportive cases (main diagonal) to unsupportive cases (off-diagonal).
Table A5:
Truth table (1).
| DPG1 | DPG2 | DPG3 | P | AS | AE | ||||
| 1 | DPGsÔP | ||||||||
| 1 | 1 | 1 | 3 | C | 0.667 | wRM, [wDJ], wXD | |||
| 1 | 0 | 1 | 1 | 0 | 0.000 | wXJ | |||
| 1 | 0 | 0 | 1 | 1 | 1.000 | wMY | |||
| 0 | 1 | 1 | 1 | 1 | 1.000 | wTC | |||
| 0 | 1 | 0 | 1 | 0 | 0.000 | wBY | |||
| 0 | 0 | 1 | 1 | 0 | 0.000 | wTE | |||
| 0 | 0 | 0 | 1 | 0 | 0.000 | wHT | |||
| 2 | DPGsÔAS | ||||||||
| 1 | 1 | 1 | 3 | C | 0.333 | [wRM], wDJ, [wXD] | |||
| 1 | 0 | 1 | 1 | 1 | 1.000 | wXJ | |||
| 1 | 0 | 0 | 1 | 1 | 1.000 | wMY | |||
| 0 | 1 | 1 | 1 | 1 | 1.000 | wTC | |||
| 0 | 1 | 0 | 1 | 0 | 0.000 | wBY | |||
| 0 | 0 | 1 | 1 | 1 | 0.000 | wTE | |||
| 0 | 0 | 0 | 1 | 0 | 0.000 | wHT | |||
| 3 | DPGsÔAE | ||||||||
| 1 | 1 | 1 | 3 | C | 0.667 | wRM, [wDJ], wXD | |||
| 1 | 0 | 1 | 1 | 0 | 0.000 | wXJ | |||
| 1 | 0 | 0 | 1 | 1 | 1.000 | wMY | |||
| 0 | 1 | 1 | 1 | 1 | 1.000 | wTC | |||
| 0 | 1 | 0 | 1 | 0 | 0.000 | wBY | |||
| 0 | 0 | 1 | 1 | 1 | 0.000 | wTE | |||
| 0 | 0 | 0 | 1 | 0 | 0.000 | wHT | |||
Note: The square brackets in the column of cases stands for that the outcome of the case is 0, and “C” in the column of outcomes means a contradictory configuration.
Table A6:
Truth table (2).
| DPG1 | DPG2 | DPG3 | C3R | C3L | P | AS | AE | ||
|---|---|---|---|---|---|---|---|---|---|
| 1 | 0 | 0 | 0 | 1 | 1 | 1 | 1 | 1 | wMY |
| 1 | 1 | 1 | 0 | 1 | 2 | 1 | 0 | 1 | wRM, wXD |
| 1 | 1 | 1 | 1 | 0 | 1 | 0 | 1 | 0 | wDJ |
| 0 | 1 | 1 | 1 | 0 | 1 | 1 | 1 | 1 | wTC |
| 0 | 0 | 1 | 1 | 1 | 1 | 0 | 1 | 1 | wTE |
| 1 | 0 | 1 | 1 | 0 | 1 | 0 | 1 | 0 | wXJ |
| 0 | 1 | 0 | 1 | 0 | 1 | 0 | 0 | 0 | wBY |
| 0 | 0 | 0 | 1 | 0 | 1 | 0 | 0 | 0 | wHT |
Note: All the consistency of the configural conditions are 1.
Table A7:
Configurations leading to the outcomes.
| P1 | P2 | P3 | AS1 | AS2 | AS3 | AS4 | AE1 | AE2 | AE3 | AE4 | |
|---|---|---|---|---|---|---|---|---|---|---|---|
| DPG1 | ⊗ | ● | ● | ● | ⊗ | ⊗ | ● | ● | ⊗ | ||
| DPG2 | ● | ● | ⊗ | ● | ⊗ | ⊗ | ● | ● | ⊗ | ||
| DPG3 | ● | ● | ⊗ | ● | ● | ⊗ | ● | ● | ● | ⊗ | ● |
| C3R | ⊗ | ⊗ | ● | ● | ⊗ | ● | ● | ⊗ | ⊗ | ● | |
| C3L | ● | ● | ⊗ | ⊗ | ● | ● | ● | ● | ● | ||
| Solution formulas | P← | AS← | AE← | ||||||||
| dpg1*DPG2*DPG3 | DPG2*DPG3*C3R *c3l | dpg1*DPG2*DPG3*C3R | |||||||||
| +DPG2*DPG3 | +DPG1*DPG3*C3R *c3l | +DPG1*DPG2*DPG3 | |||||||||
| *c3r *C3L | +DPG1*dpg2*dpg3 *c3r | *c3r *C3L+DPG1*dpg2* | |||||||||
| +DPG1*dpg2* | *C3L+dpg1*dpg2*DPG3 | dpg3*c3r *C3L+dpg1*DPG3 | |||||||||
| dpg3*c3r *C3L | *C3R *C3L | *C3R *C3L | |||||||||
| Number of Cases | 1 | 2 | 1 | 2 | 2 | 1 | 1 | 1 | 2 | 1 | 1 |
| Cases | wTC | wRM | wMY | wTC | wXJ | wMY | wTE | wTC | wRM | wMY | wTE |
| wXD | wDJ | wDJ | wXD | ||||||||
| Consistency | 1 | 1 | 1 | 1 | 1 | 1 | 1 | 1 | 1 | 1 | 1 |
| Raw coverage | 0.25 | 0.5 | 0.25 | 0.4 | 0.4 | 0.2 | 0.2 | 0.2 | 0.4 | 0.2 | 0.2 |
| Unique coverage | 0.25 | 0.5 | 0.25 | 0.2 | 0.2 | 0.2 | 0.2 | 0.2 | 0.4 | 0.2 | 0.2 |
| Overall solution consistency | 1 | 1 | 1 | ||||||||
| Overall solution coverage | 1 | 1 | 1 |
Note: (1) ● indicate the presence of a condition, and ⊗ indicate its absence. Blank spaces indicate “don’t care”. (2) On the solution header, “P”, “AS” and “AE” stands respectively for the outcome dimensions: “Provision”, “Appropriation – Sufficiency” and “Appropriation – Equity”; the numbers stand for the number of solutions for each outcome dimension. (3) On the row header, “DPG” stands for “design principle groups”; “C3R” and “C3L” stands for resource and leadership interventions. (4) This form reports the intermediate solutions. (5) conditions shown by lowercase means “absent” while by uppercase means “present”.