
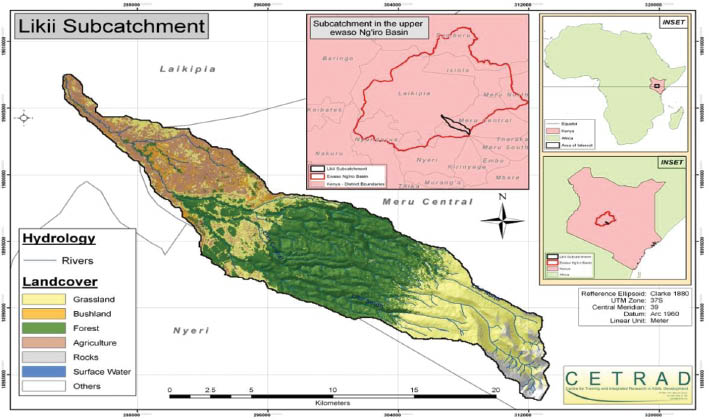
Figure 1
A nested map of Likii catchment with its position in the Upper Ewaso Ngíro North Basin, Kenya and Africa (CETRAD 2010).
Table 1
Details of the nine water user groups established in Likii catchment as well as the large scale water users (source: WRMA archives).
| Year established | Initial members | Current members | Estimated command area (Ha) | Average plot size per user (Ha) | Year of provisional water right | |
|---|---|---|---|---|---|---|
| Name Water User Group | ||||||
| Mukuria | 1978 | 190 | 500 | 320 | 0.6 | 1979 |
| Miarage A | 1979 | 160 | 120 | 320 | 2.0 | 1987 |
| Nkando | 2002 | 200 | 200 | 162 | 0.8 | 2010 |
| Nturukuma | 1987 | 150 | 640 | 1700 | 2.4 | 1991 |
| Mukima | 1992 | 50 | 158 | 2000 | 12.1 | 2004 |
| Miarage B | 2000 | 250 | 300 | Unknown | Unknown | 2004 |
| Jikaze | 2001 | 39 | 38 | 32 | Unknown | Not yet |
| Murimi | 1999 | 105 | 280 | Unknown | Unknown | 2004 |
| Kiranga | 1992 | 190 | 326 | 360 | 1.0 | 1993 |
| Large scale users | ||||||
| Likii River Farm (Flower Farm) | 1989 | 1 | 1 | 37 | 36.8 | 1994 |
| Countrywide Connections (Flower Farm) | 2001 | 1 | 1 | 26 | 25.9 | 2002 |
| Mt Kenya Wildlife Conservancy | 2000 | 1 | 1 | 223 | 223.0 | 2003 |
| Water Utility | 2008 | 1 | 1 | n/a | n/a | Not yet |
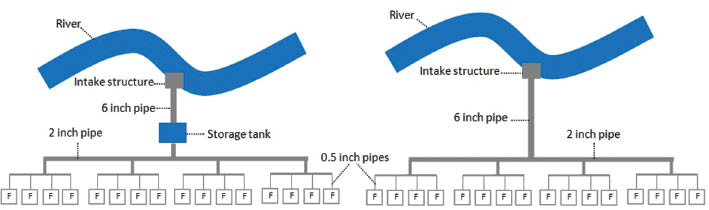
Figure 2
Sketch irrigation systems with (left) and without (right) central storage tank.
Table 2
Category system for granting water permits and charging fees as applied in the Upper Ewaso Ngíro North Basin (Republic of Kenya 2007) (exchange rate August 2011: 1000 Ksh=7.50 euro).
| Assessment of application | Renewal of permit | Recommends | Approval authority | Domestic/livestock | Irrigation/commercial | |||
|---|---|---|---|---|---|---|---|---|
| A | Water use activity deemed by virtue of its scale to have a low risk of impacting the water resource | <50 | 1000 | Nil | WRUA | Local | Nil | Nil |
| B | Water use activity deemed by virtue of its scale to have the potential to make a significant impact on the water resource | 50<−500 | 5000 | 7500 | WRUA | Regional | 0.5 | 0.5<300 m3/day 0.75>300 m3/day |
| C | Water use activity deemed by virtue of its scale to have a significant impact on the water resources | 500–5000 | 20,000 | 25,000 | WRUA | Regional | 0.5 | 0.5<300 m3/day 0.75>300 m3/day |
| D | Water use activity which involves either two different catchment areas, or is of a large scale or complexity and which is deemed by virtue of its scale to have a measurable impact on the water resource | >5000 | 40,000 | 50,000 | WRUA | National | 0.5 | 0.5<300 m3/day 0.75>300 m3/day |
Table 3
Subdivision of the Likii river with mean flows, users and initial division of positions within the WRUA management committee including the ratio between positions occupied by representatives from the commercial farmers (c) and representatives from the small-scale farmers (s) (WRMA archives 2011).
| River section | Mean river flow (m3/s) | Large-scale users | # WUAs | # users represented | # management positions allocated (c/s) |
|---|---|---|---|---|---|
| Likii north | 0.593 | Flower farm | 5 | 873 | 3 (1/2) |
| Likii central | 0.479 | Public water utility | 0 | 1 | 1 |
| Likii south | 0.328 | Mt Kenya wildlife conservancyMt Kenya Safari Club | 0 | 2 | 2 |
| Likii main | 0.140 | Flower farm | 4 | 337 | 4 (1/3) |