
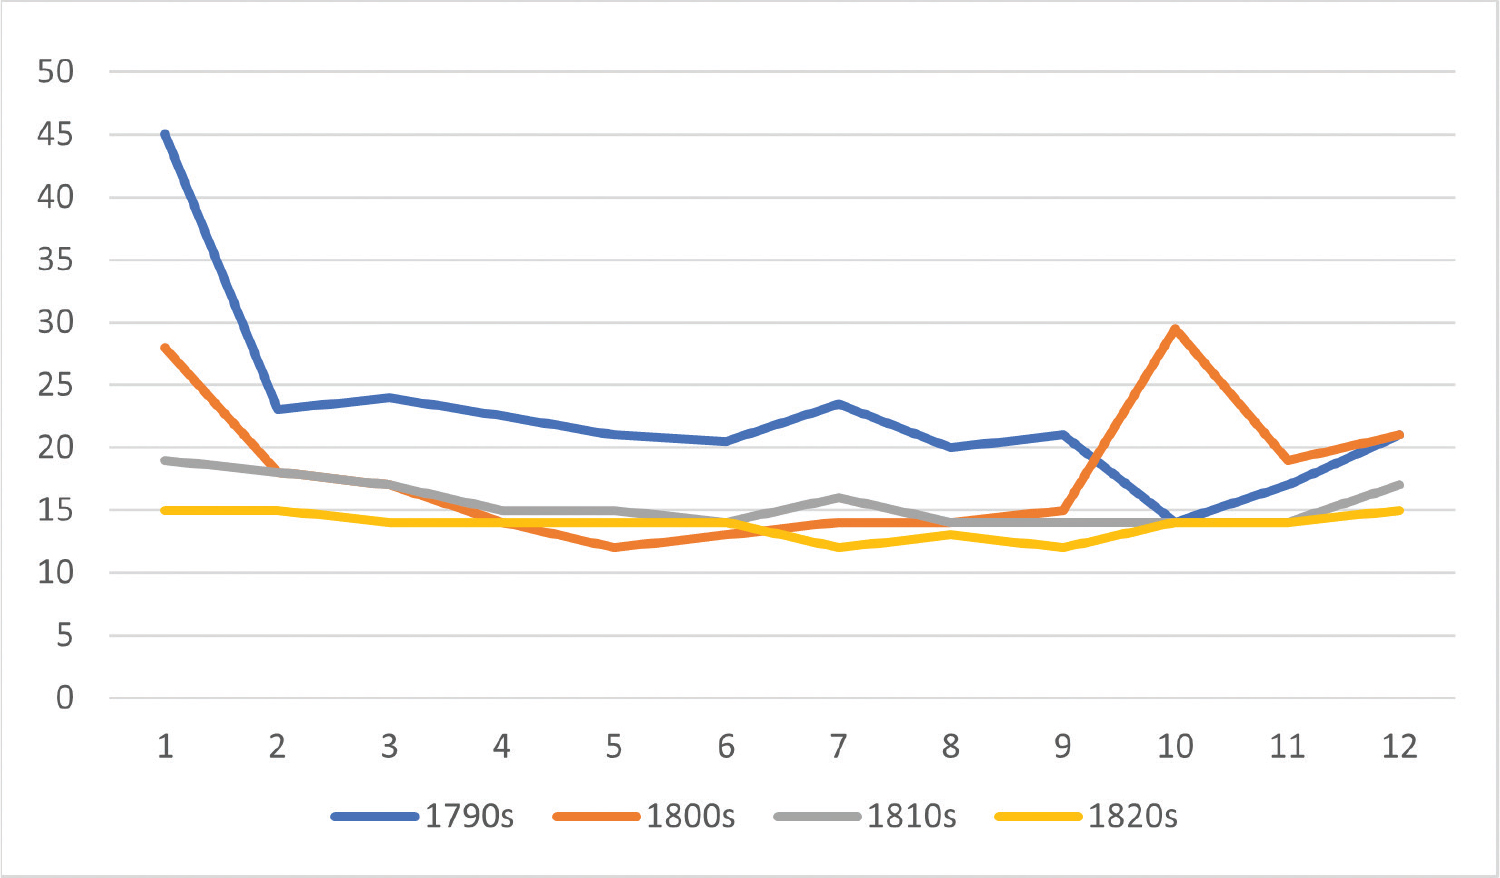
Figure 1
The median circulation time in days of reprinted texts each month based on the last instance of publication. Source: textreuse.sls.fi.
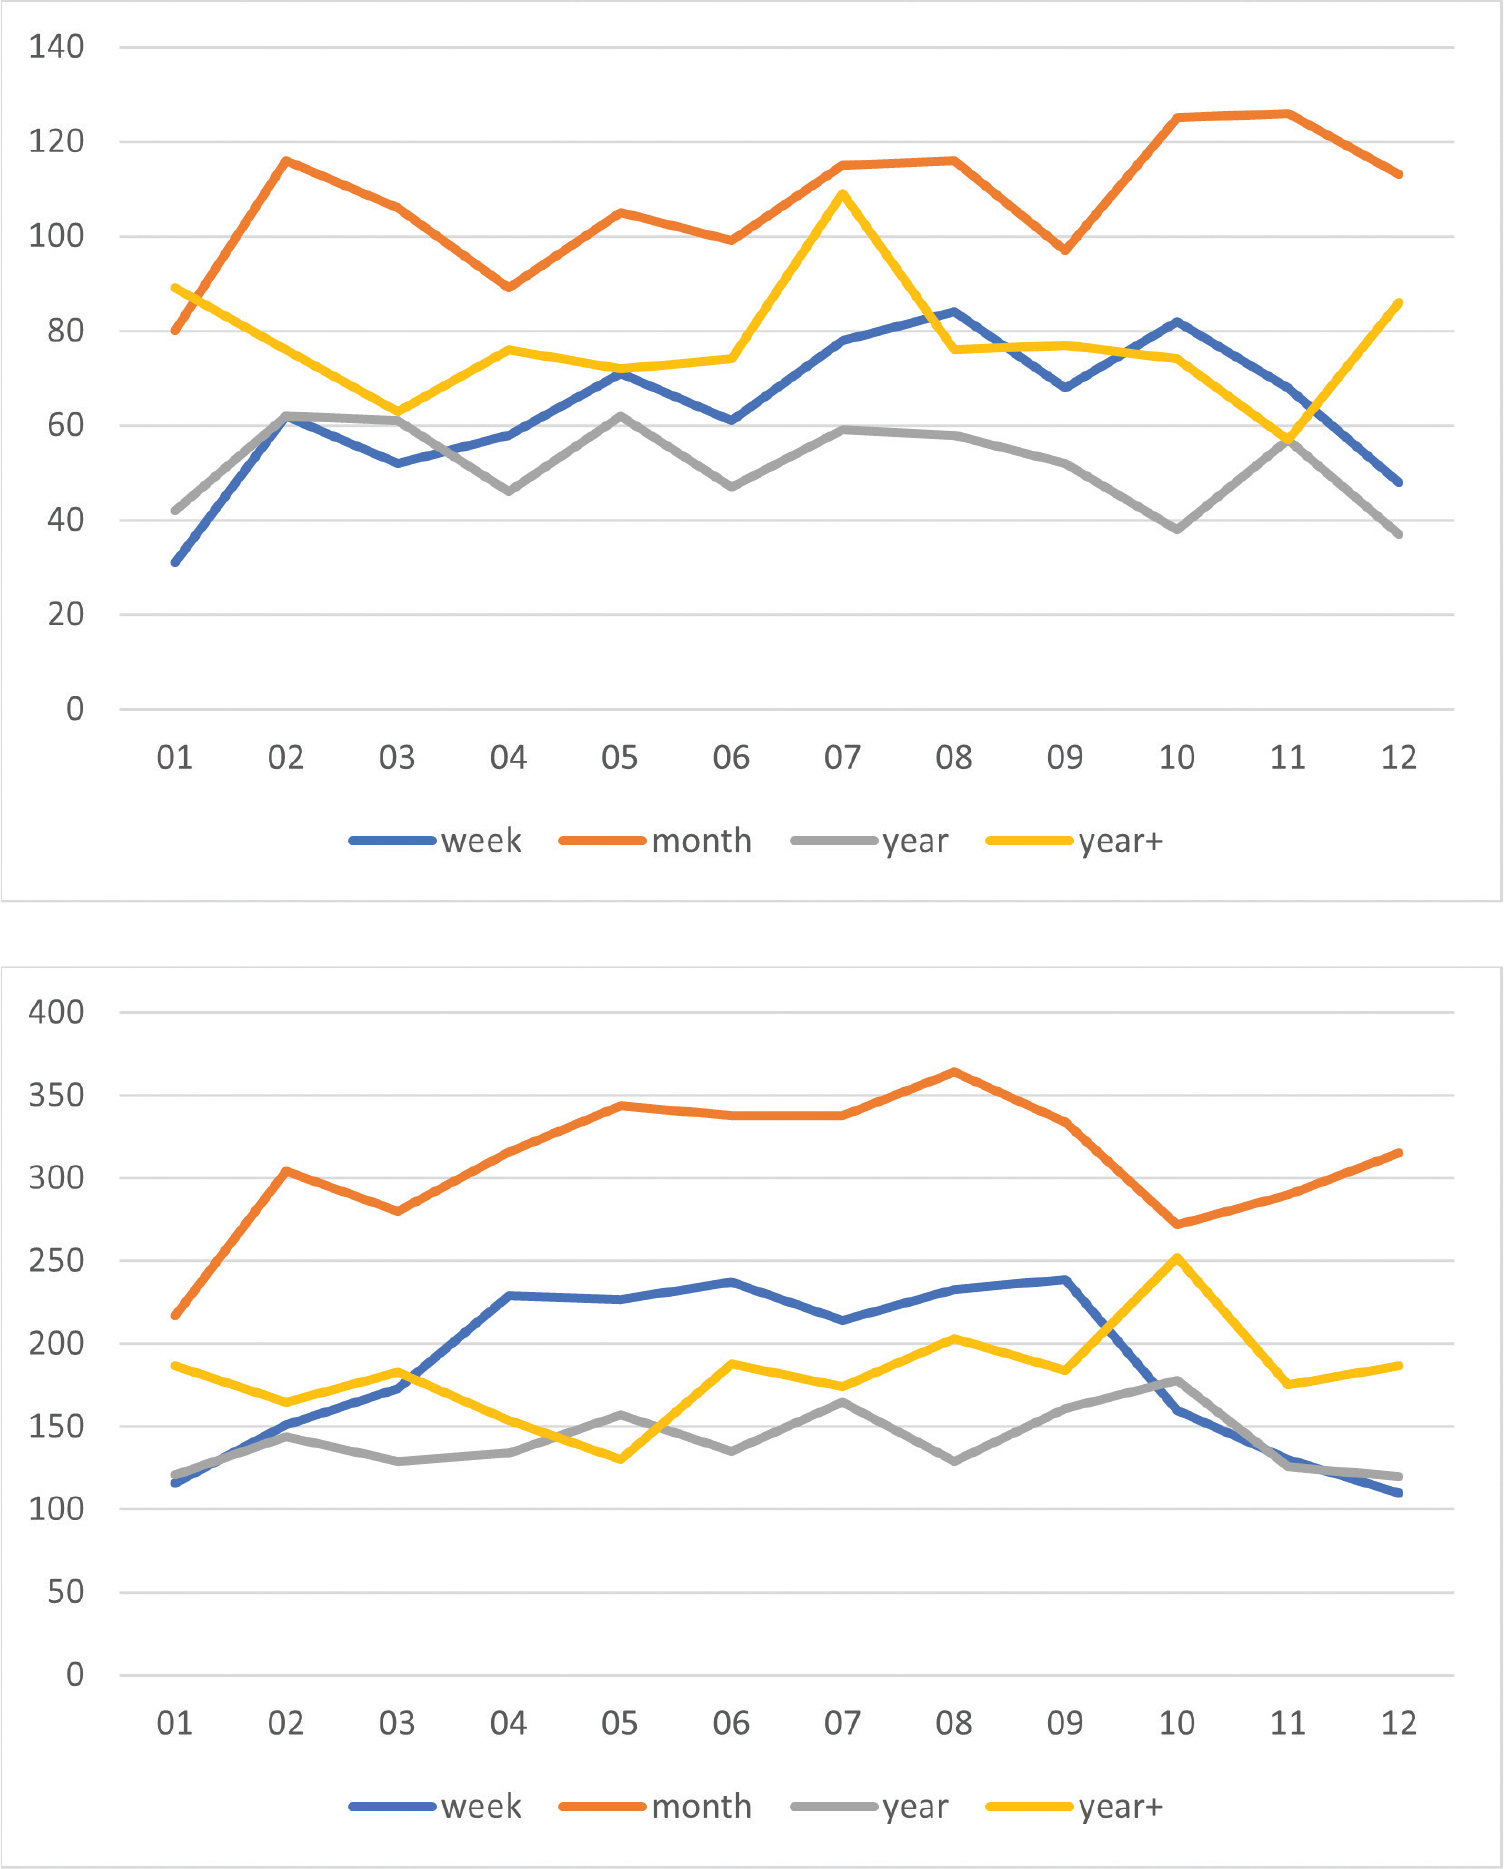
Figures 2 and 3
The number of text clusters in four different duration categories during the 1790s (top) and the 1800s (bottom), calculated based on the last printing date for each cluster. Source: textreuse.sls.fi.
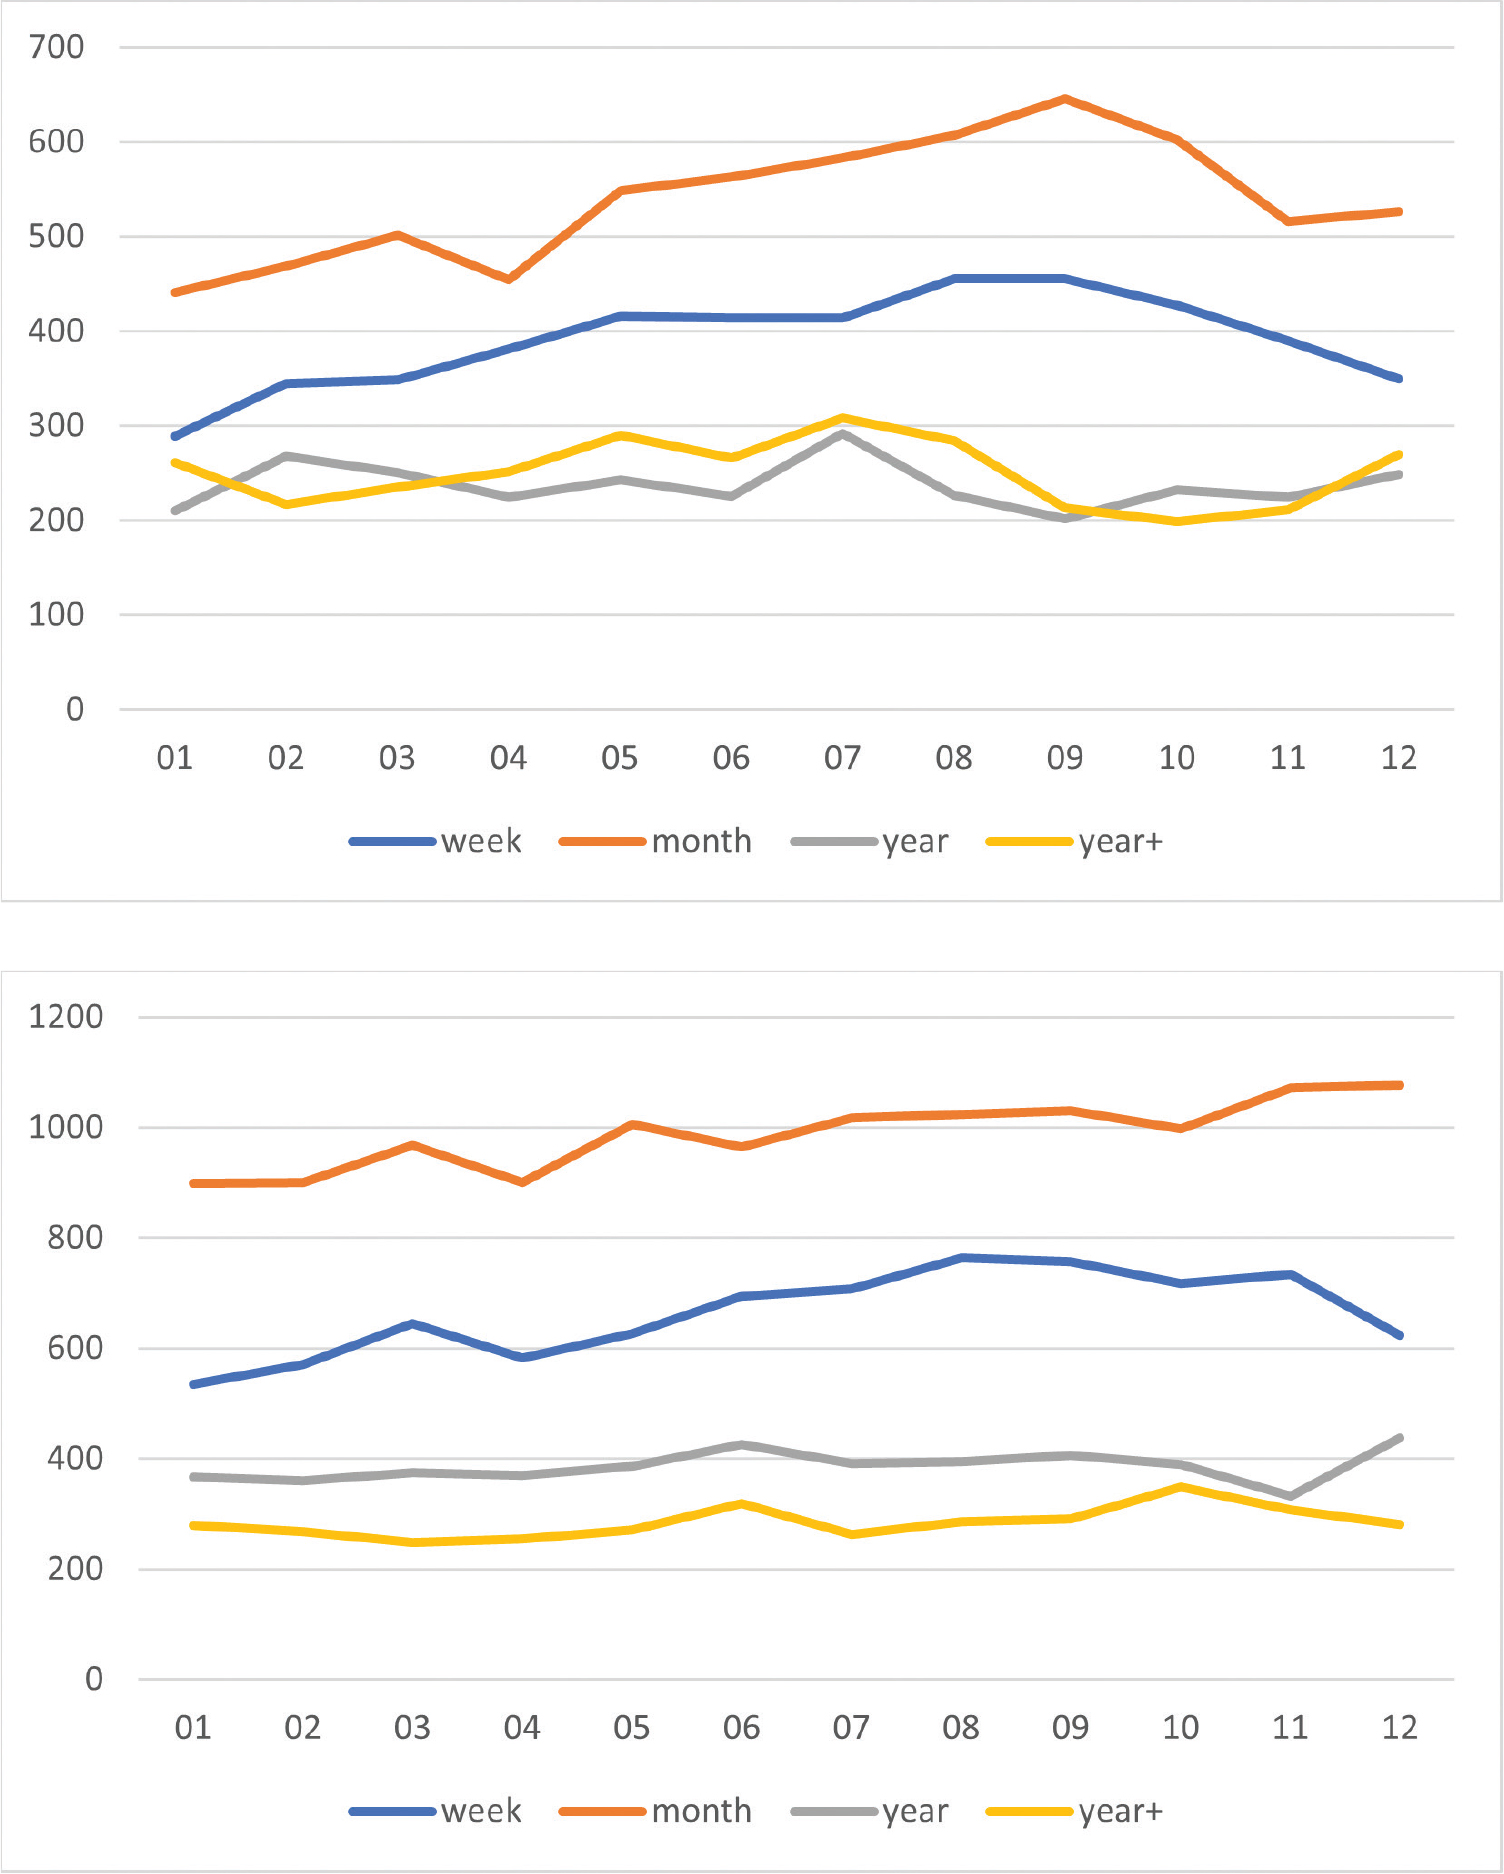
Figures 4 and 5
The number of text clusters in four different duration categories during the 1810s (top) and 1820s (bottom), calculated based on the last printing date for each cluster. Source: textreuse.sls.fi.
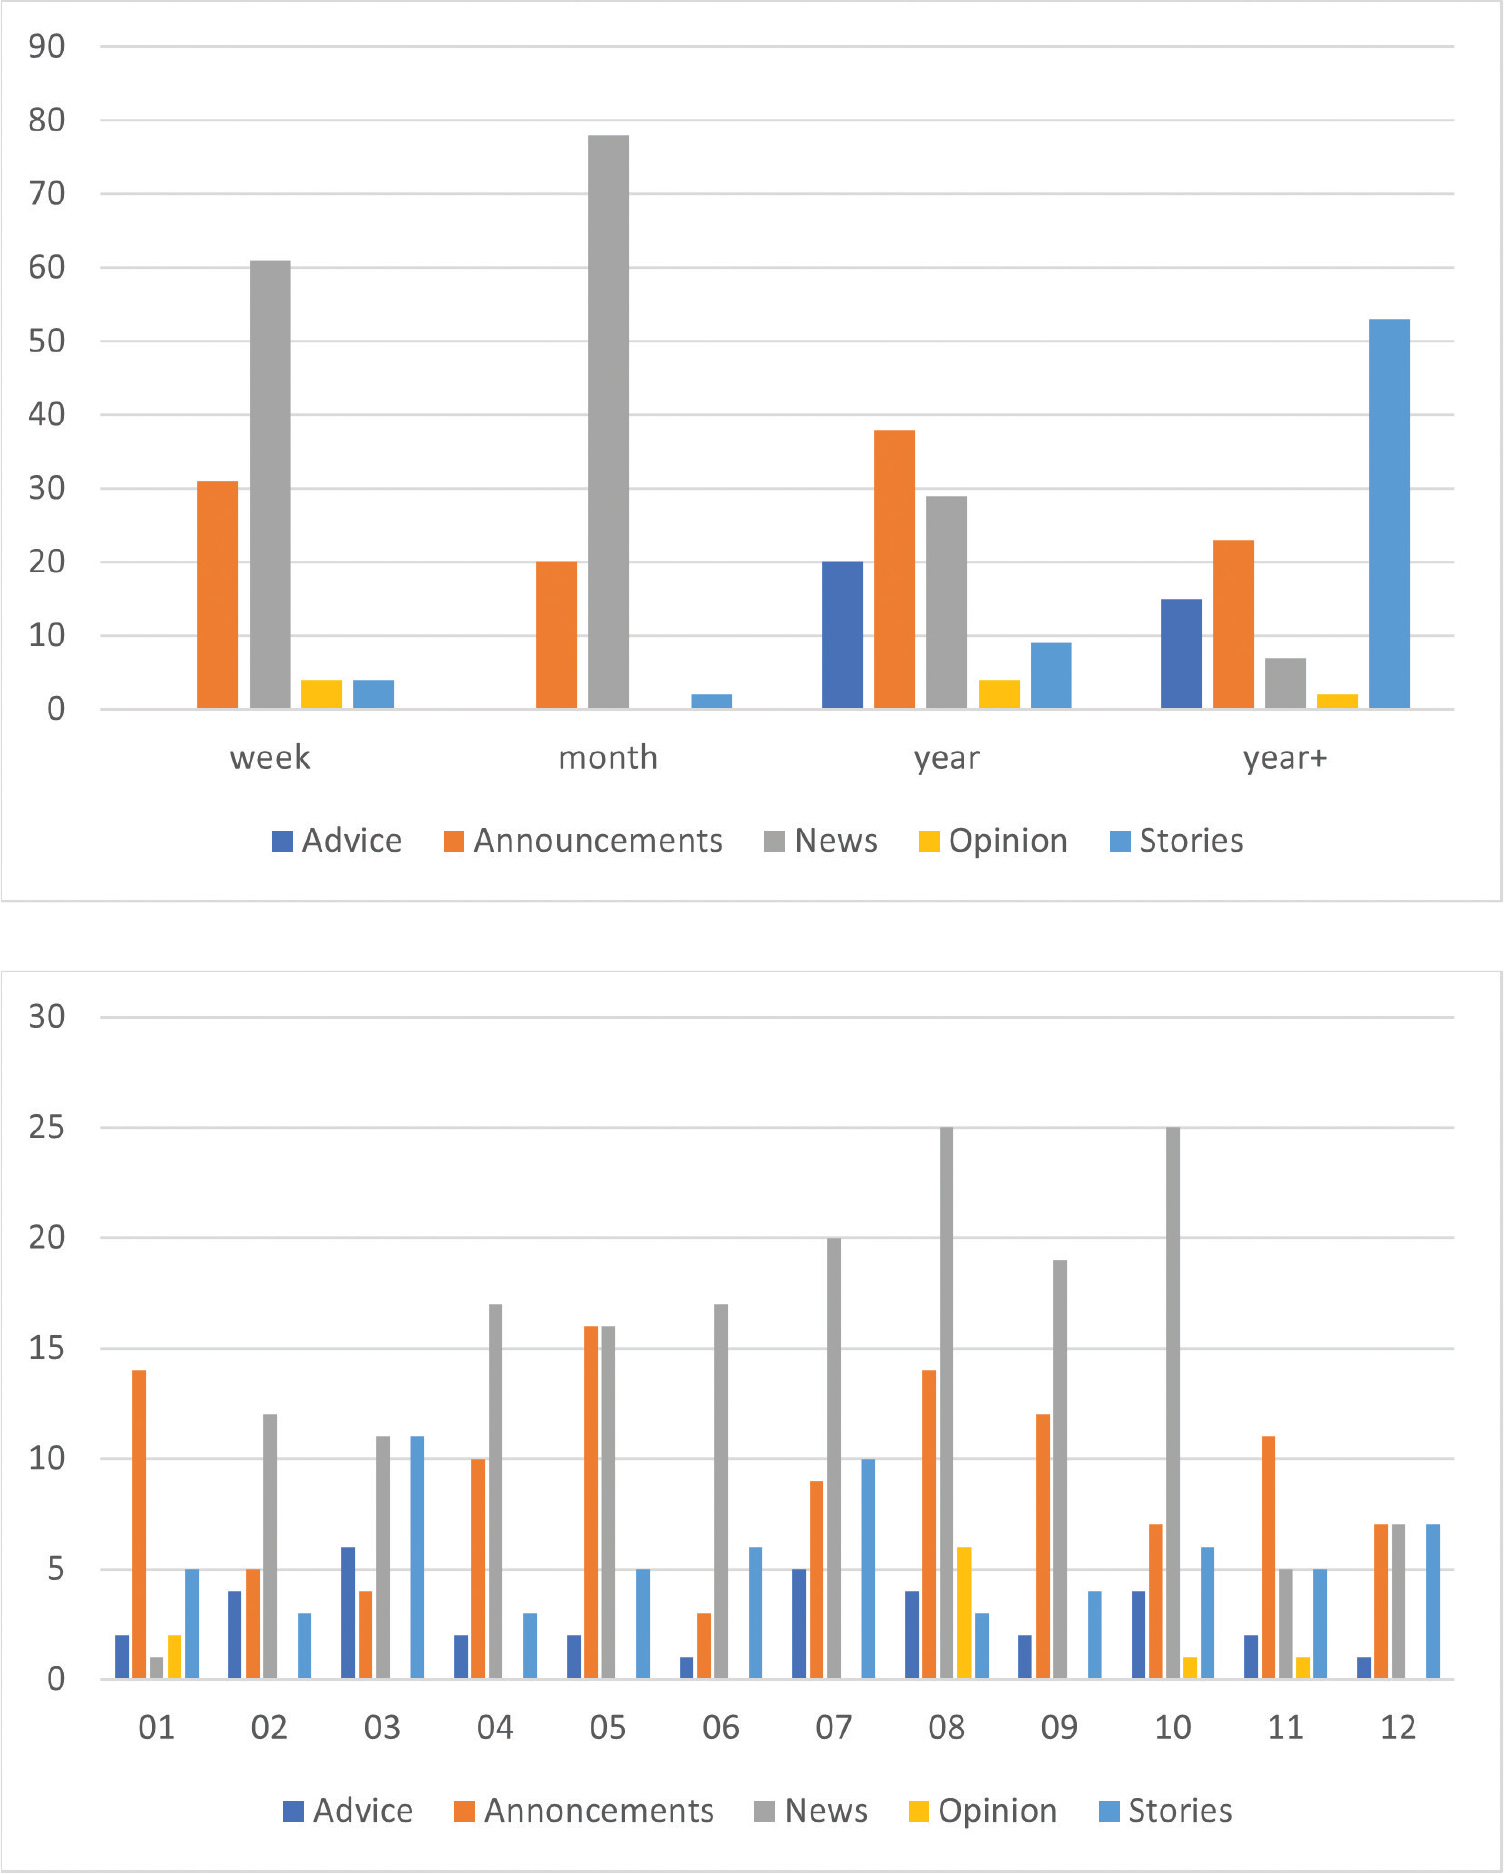
Figures 6 and 7
Proportion of labelled clusters per duration category and number of labelled text clusters per end-month, respectively, from the 1790s. Source: textreuse.sls.fi.
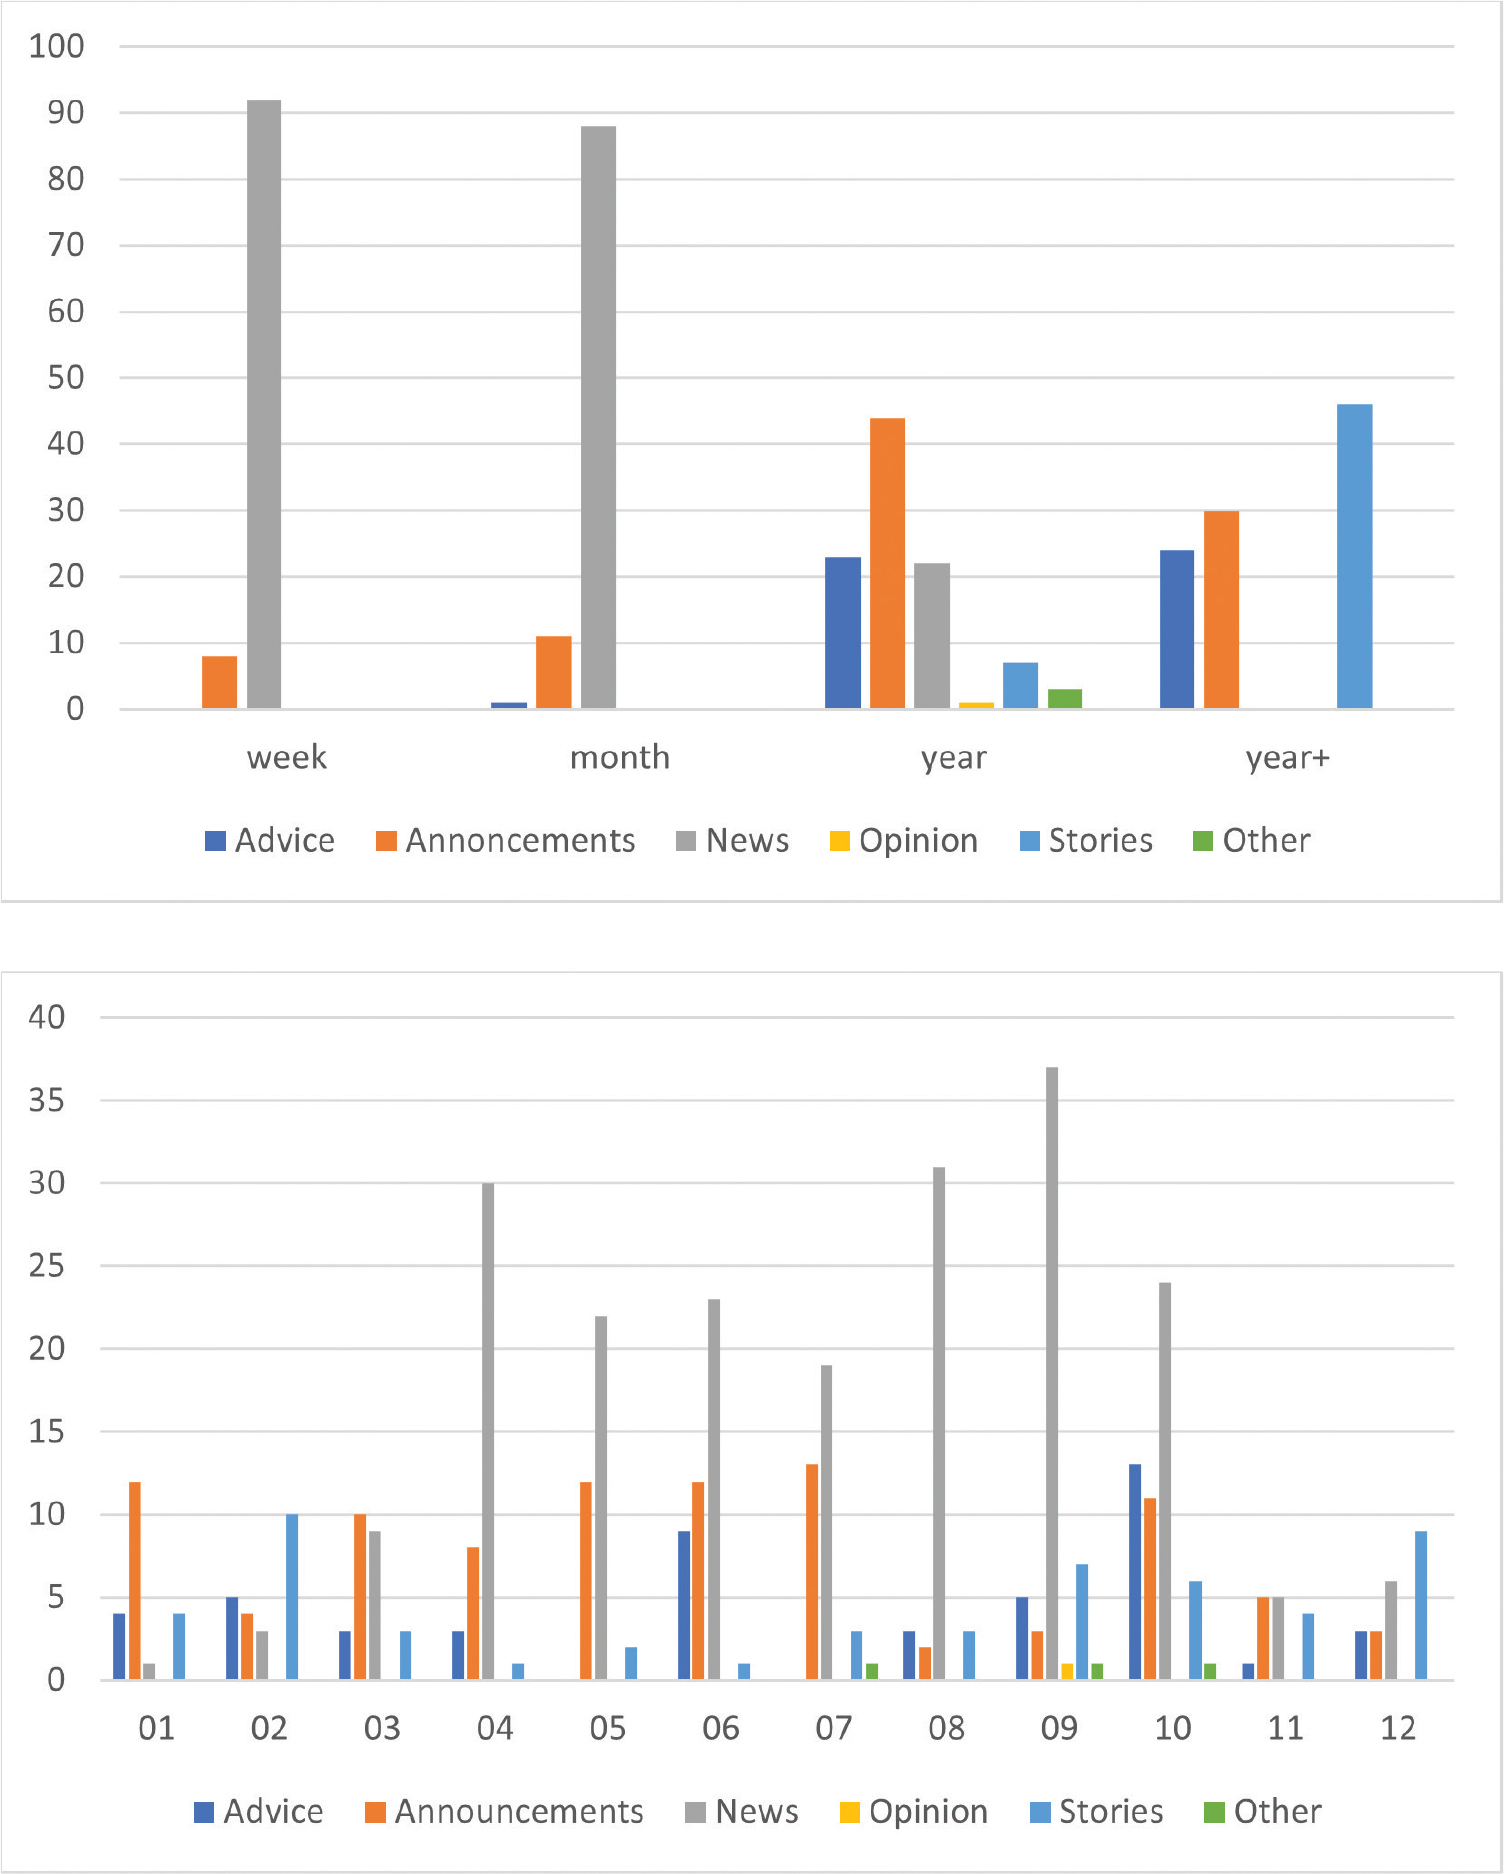
Figures 8 and 9
Proportion of labelled clusters per duration category and number of labelled text clusters per end-month, respectively, from the 1800s. Source: textreuse.sls.fi.
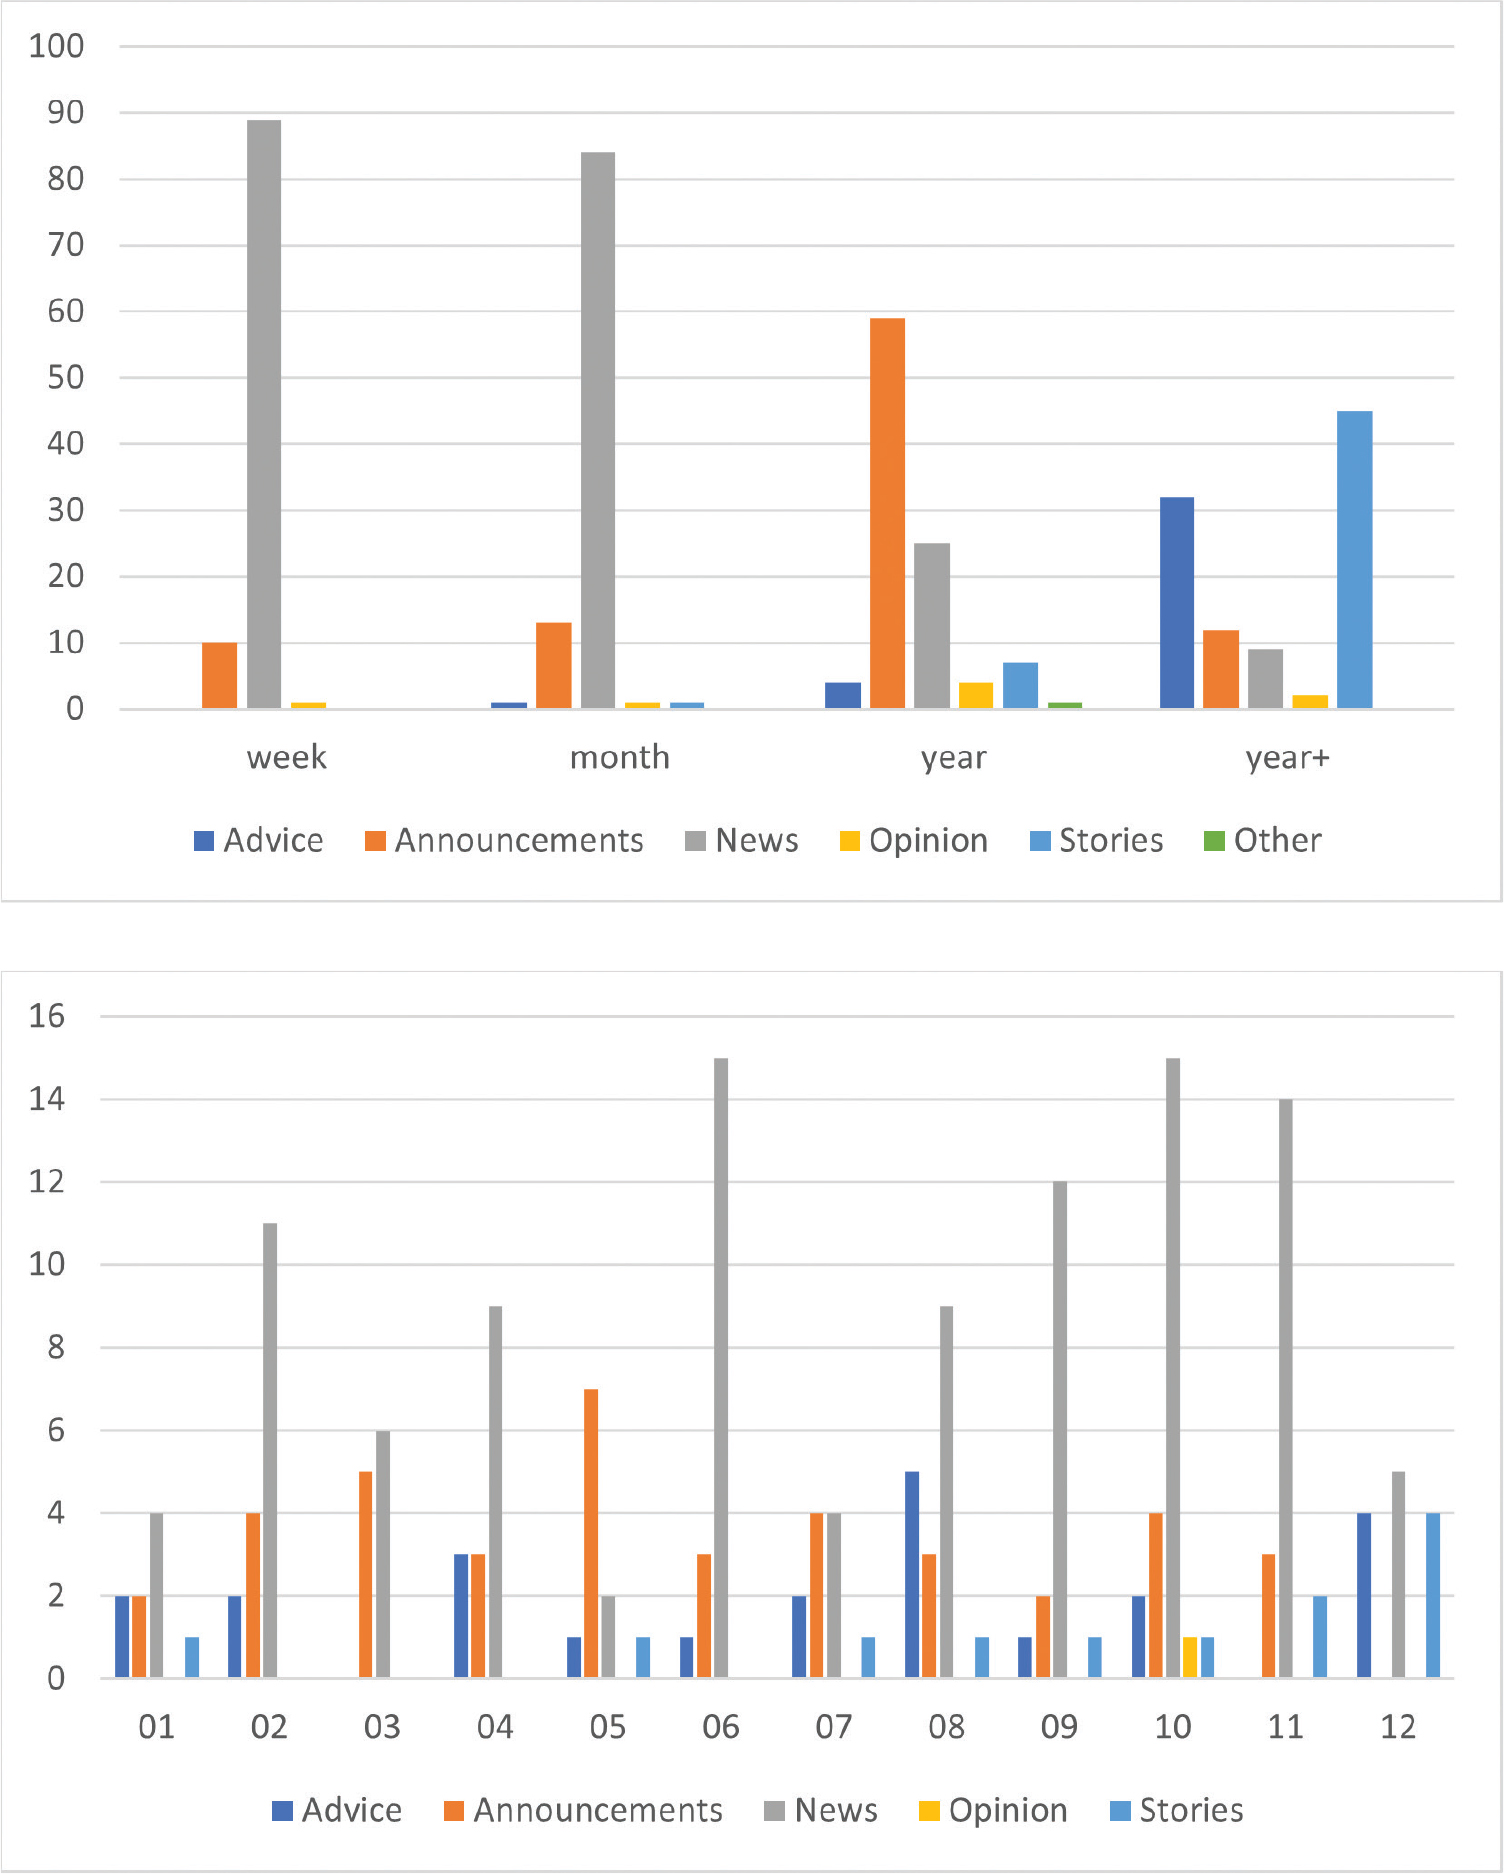
Figures 10 and 11
Proportion of labelled clusters per duration category and number of labelled text clusters per end-month, respectively, from the 1810s. Source: textreuse.sls.fi.
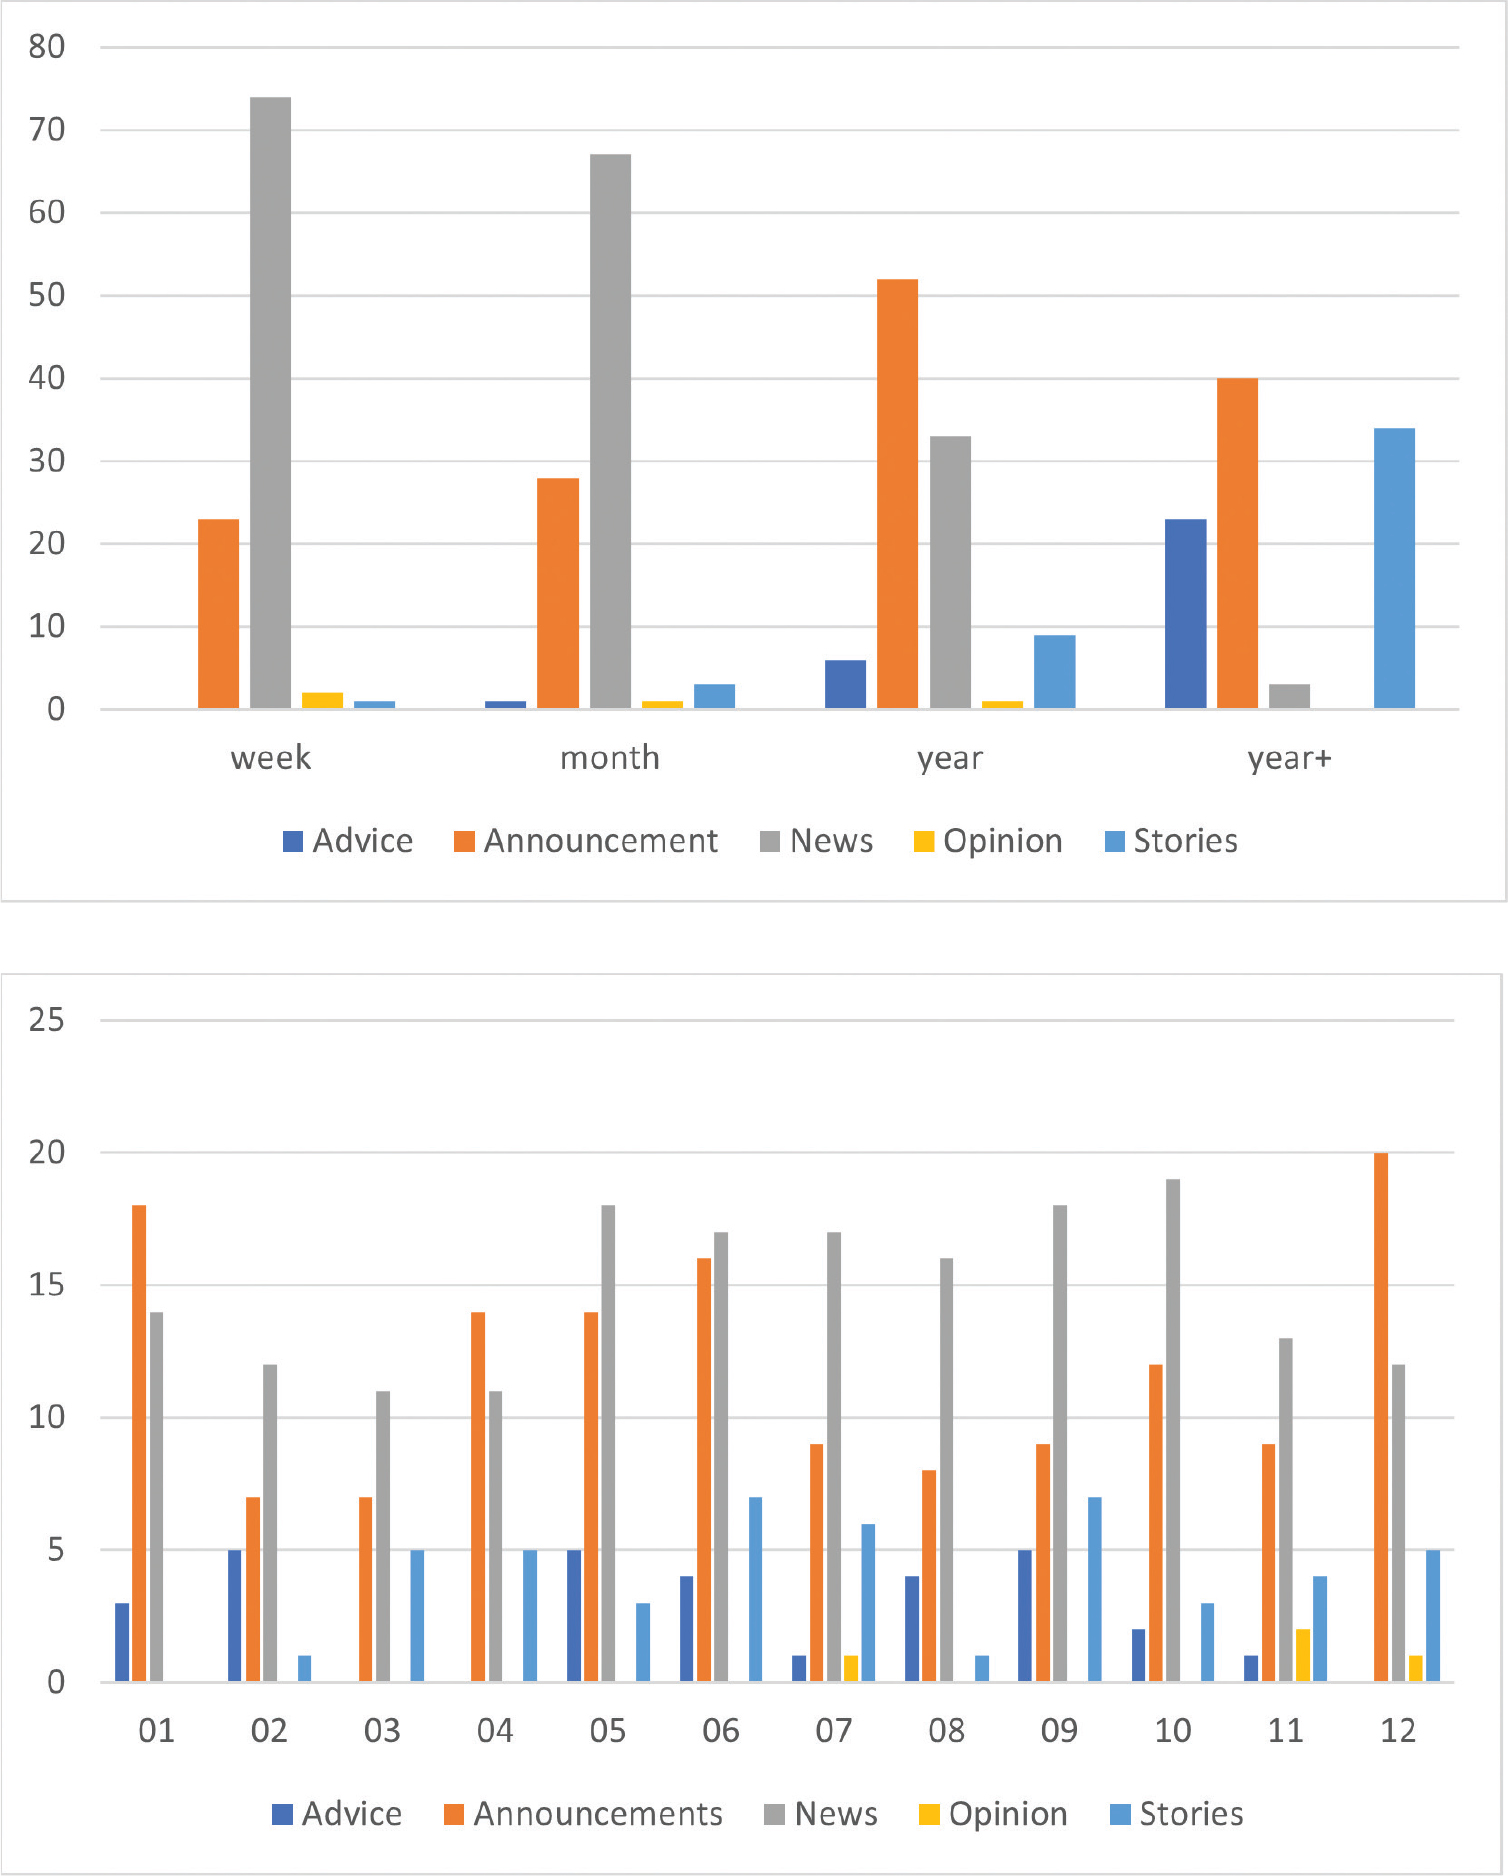
Figures 12 and 13
Proportion of labelled clusters per duration category and number of labelled text clusters per end-month, respectively, from the 1820s. Source: textreuse.sls.fi.
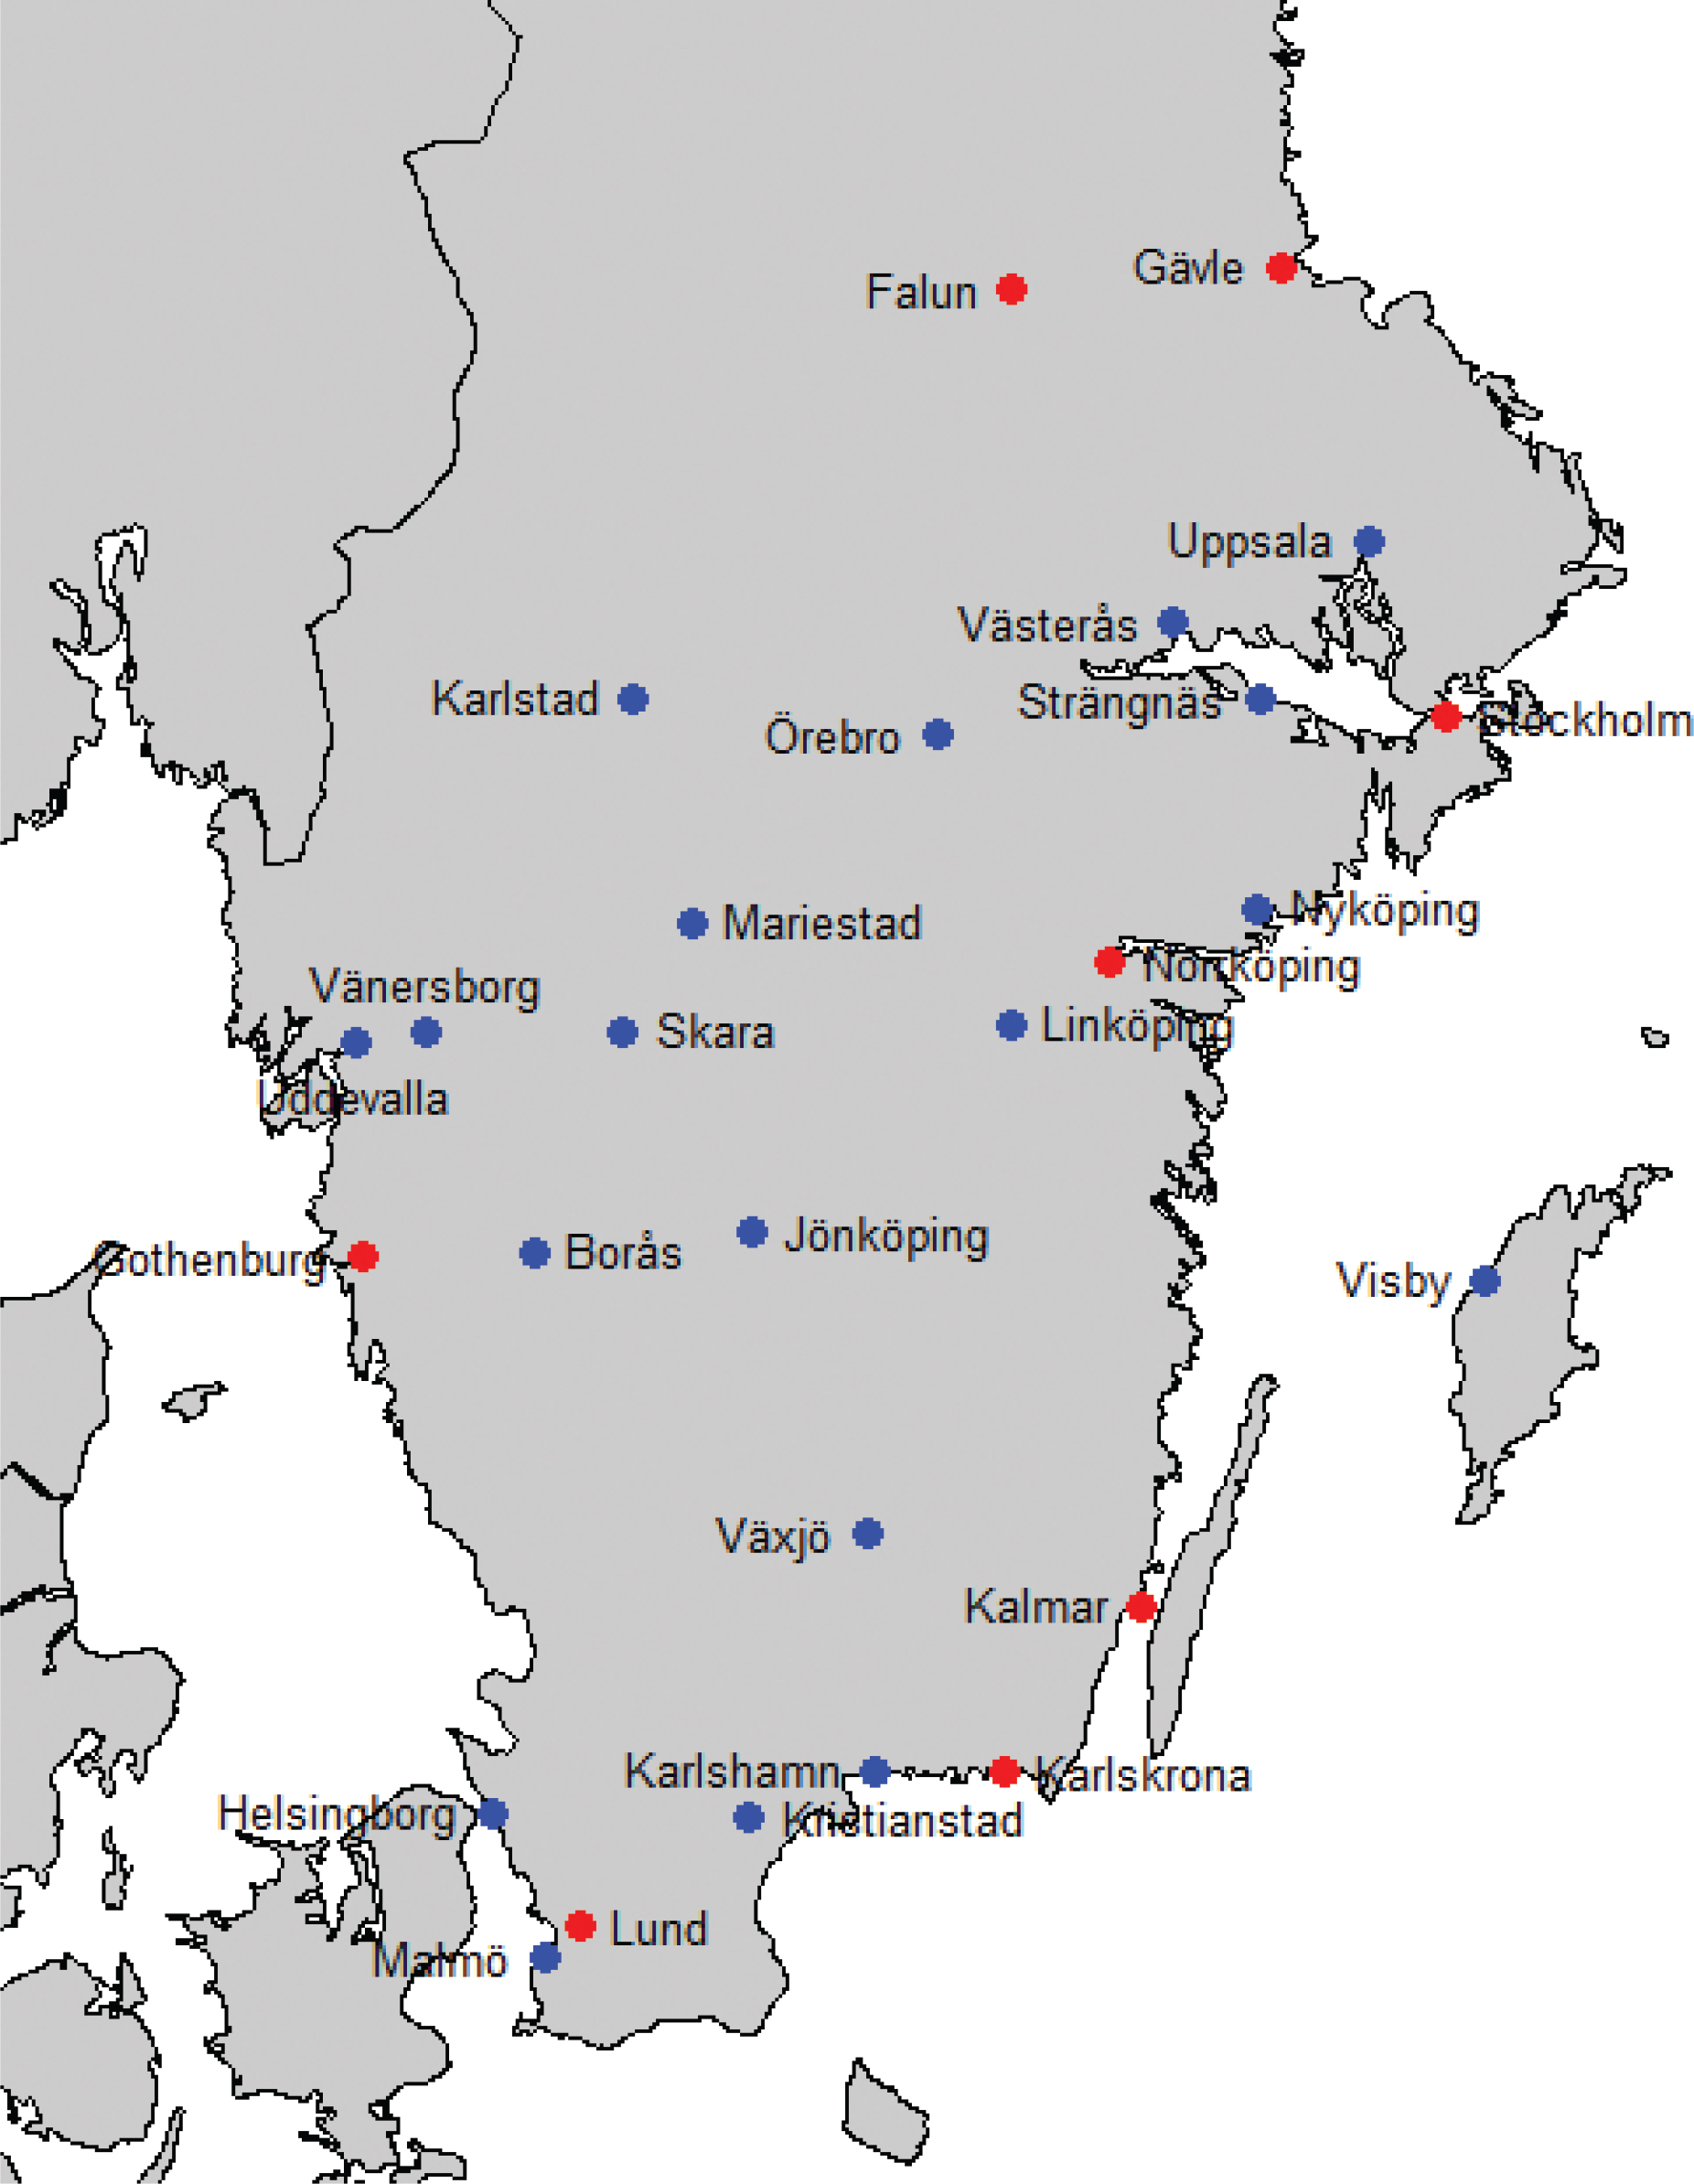
Figure 14
The geographical locations of newspapers published in 1790 (red) and the locations of additional titles published in 1829 (blue). Map generated using R Core Team (2024).