
Table 1.
Variable description for determinants of non-farm livelihood diversification
| S/No. | Variable | Description and measurement | A priori expectation |
|---|---|---|---|
| Dependent variable | |||
| 1 | NON-FARM | Non-farm livelihood diversification, 1 = household head or spouse of household head is engaged in any non-farm work, 0 = otherwise | |
| Independent variables | |||
| 1 | FSIZE (X1) | Farm size, measured in hectares | + |
| 2 | FBO (X2) | Membership of a farmer-based organisation, 1 = Yes, 0 = otherwise | + |
| 3 | CREDIT (X3) | Access to credit, 1 = farmer obtained credit over the last two production periods, 0 = otherwise | + |
| 4 | AGE (X4) | Age of household head in years | ± |
| 5 | EDUHEAD (X5) | Educational level of household head, in years of formal education | + |
| 6 | EDUSPOUSE (X6) | Educational status of spouse, in years of formal education | + |
| 7 | HHSIZE (X7) | Household size, measured in adult equivalence | ± |
| 8 | TLU (X8) | Livestock ownership, measured in number of Tropical Livestock Units (TLU) | + |
| 9 | SEX (X9) | Sex of household head, male = 1, female = 0 | ± |
| 10 | AID (X10) | Safety net aid, 1 = household has received any form of monetary or in-kind support from the government or NGOs in the recent past, 0 = otherwise | + |
| 11 | EXP (X11) | Farming experience, in number of years of farming | ± |
| 12 | LAND (X12) | Mode of land access; 1 = personal ownership, 0 = otherwise | + |
| 13 | DIST (X13) | Distance to market, in minutes, using the predominant means of transport | - |
| 14 | SHOCK (X14) | Shock, 1 = household experienced any shock in the 12 months before the time the survey was conducted, 0 = otherwise | ± |
| 15 | EXT (X15) | Extension contact, 1 = farmer has had at least 1 extension contact in the past three production season, 0 = otherwise | + |
| 16 | FINCOME (X16) | Gross margin of different farm outputs during the 2018/2019 production season | ± |
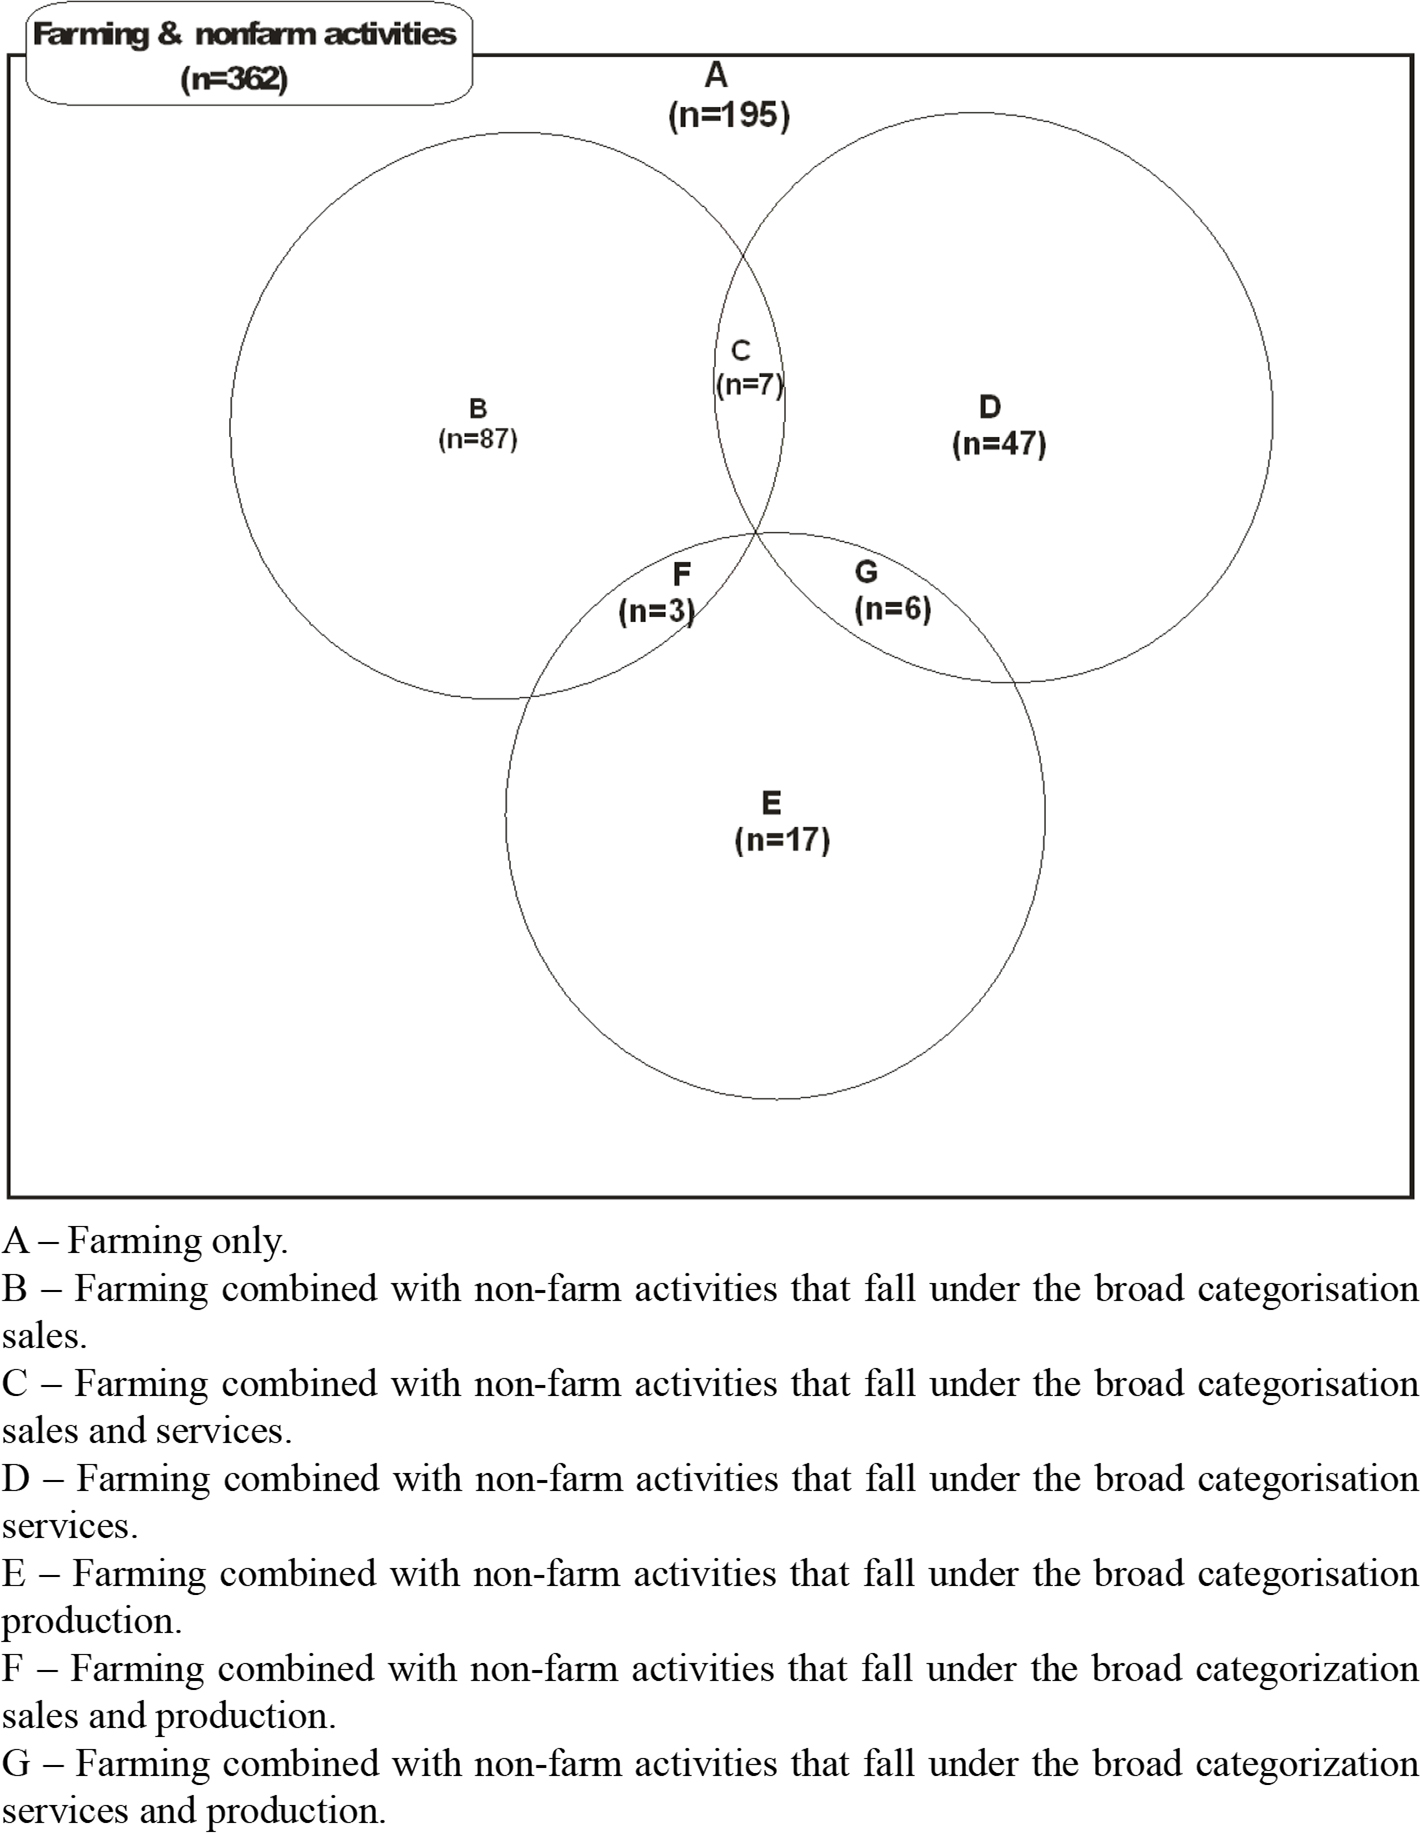
Fig. 1.
Farm households’ engagement in non-farm activities
Source: survey results, 2019.
Table 2.
Determinants of farm households’ engagement in non-farm activities
| Variables | Coefficient | Std. error | Z value | P > z | Marginal effect |
|---|---|---|---|---|---|
| Age | 0.0723687 | 0.0516166 | 1.40 | 0.161 | 0.0286148 |
| Age squared | –0.000852* | 0.0005023 | –1.70 | 0.090 | –0.0003369 |
| Gender | 0.2715034* | 0.1656078 | 1.64 | 0.101 | 0.107631 |
| Household size | 0.0733389* | 0.0384773 | 1.91 | 0.057 | 0.0289985 |
| Farm income | –0.0812477 | 0.0575791 | –1.41 | 0.158 | –0.0321257 |
| Membership of FBO | 0.3433911** | 0.1604857 | 2.14 | 0.032 | 0.1353513 |
| Farm size | –9.01e-07*** | 3.47e–07 | –2.59 | 0.010 | –3.56e-07 |
| Access to credit | –0.3426819 | 0.3421639 | –1.00 | 0.317 | –0.1306134 |
| Education (head) | 0.0131946 | 0.0176553 | 0.75 | 0.455 | 0.0052172 |
| Education (spouse) | 0.0011869 | 0.0192113 | 0.06 | 0.951 | 0.0004692 |
| Tropical livestock unit (TLU) | 0.0081887*** | 0.0031531 | 2.60 | 0.009 | 0.0032378 |
| Shock | 0.1774353 | 0.2432628 | 0.73 | 0.466 | 0.0694663 |
| Experience | 0.0043255 | 0.0081248 | 0.53 | 0.594 | 0.0017103 |
| Land ownership | 0.4419264** | 0.1984667 | 2.23 | 0.026 | 0.1748762 |
| Market access | 0.0041019 | 0.0046809 | 0.88 | 0.381 | 0.0016219 |
| Access to extension | 0.220912 | 0.1534165 | 1.44 | 0.150 | 0.086825 |
| Safety net aid | 0.2847079* | 0.1675845 | 1.70 | 0.089 | 0.1113634 |
| Constant | –2.949758** | 1.337113 | –2.21 | 0.027 | |
| Number of obs= 362 | |||||
| LR chi2 (16) = 81.27 | |||||
| Prob > chi2 = 0.0000 | |||||
| Pseudo R2 = 0.1627 | |||||
| Log Likelihood=209.1992 |