
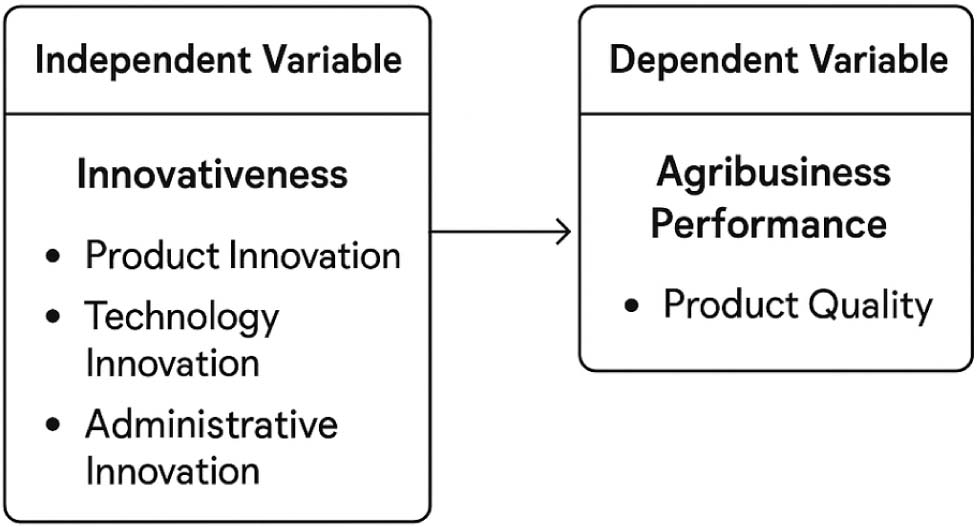
Fig. 1.
Researcher’s conceptual framework
Source: own elaboration.
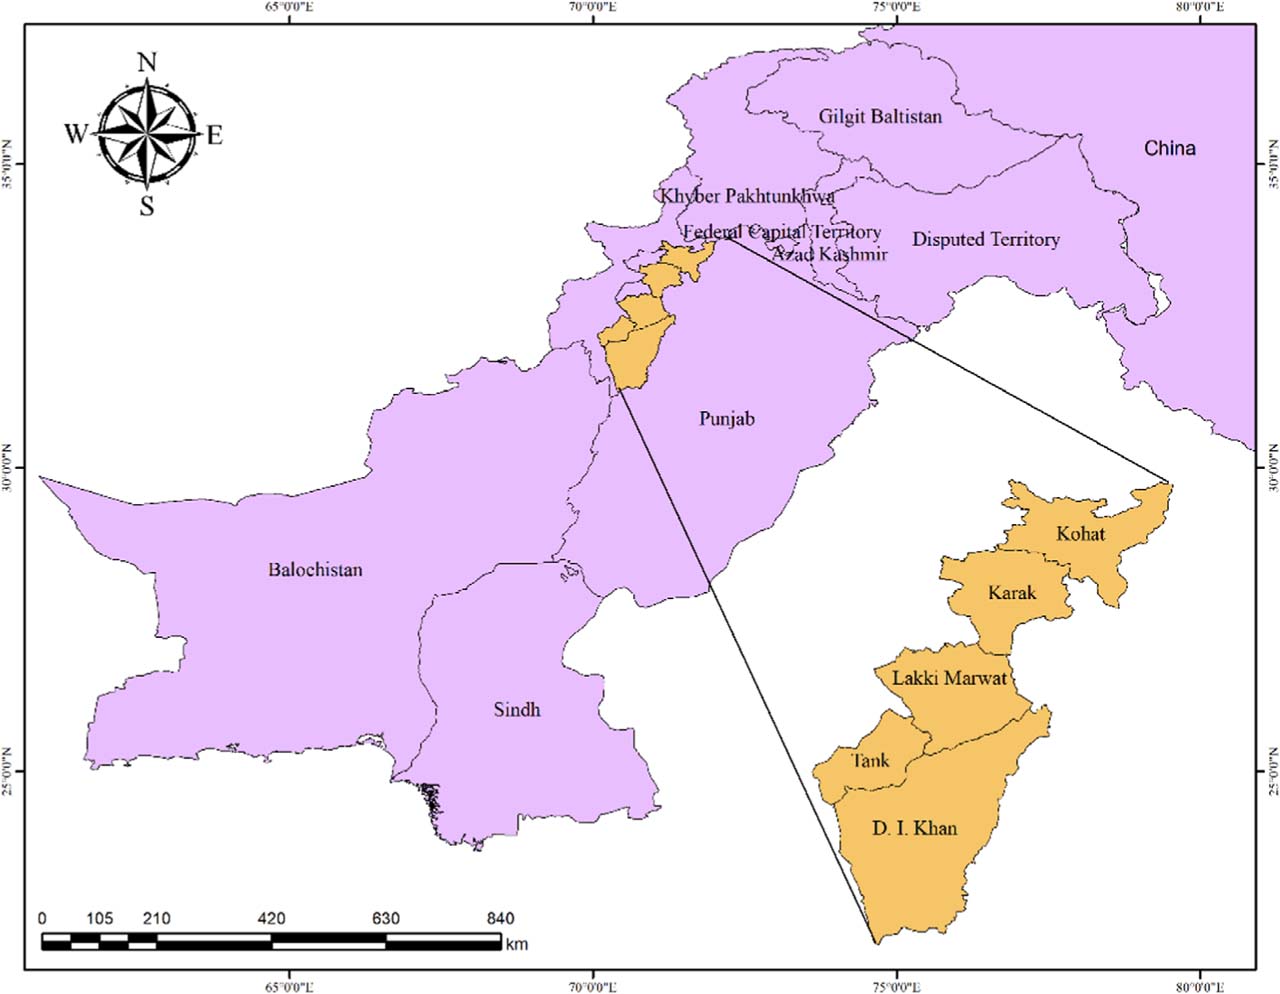
Fig. 2.
Geographical location of the study area
Table 1.
Demographic and farming background information for respondents (N = 381)
| Variable | Category | Frequency (n) | Percentage (%) |
|---|---|---|---|
| Age group (years) | 18–25 | 27 | 7.1% |
| 26–35 | 76 | 19.9% | |
| 36–45 | 190 | 49.9% | |
| 46–55 | 32 | 8.4% | |
| above 55 | 56 | 14.7% | |
| Gender | Male | 370 | 97.1% |
| Female | 11 | 2.9% | |
| Education level | no formal education | 30 | 7.9% |
| primary education | 121 | 31.8% | |
| secondary education | 70 | 18.4% | |
| diploma/certificate | 20 | 5.2% | |
| bachelor’s degree | 60 | 15.7% | |
| postgraduate degree | 80 | 21.0% | |
| Years in wheat farming | Less than 5 | 40 | 10.5% |
| 5–10 | 95 | 24.9% | |
| 11–20 | 120 | 31.5% | |
| More than 20 | 126 | 33.1% | |
| Farmland size (acres) | Less than 5 | 75 | 19.7% |
| 5–10 | 110 | 28.9% | |
| 11–20 | 100 | 26.2% | |
| More than 20 | 96 | 25.2% | |
| Farming system used | Traditional (manual) | 100 | 26.2% |
| Semi-mechanized | 140 | 36.7% | |
| Fully mechanized | 80 | 21.0% | |
| Mixed (crop + livestock) | 61 | 16.0% |
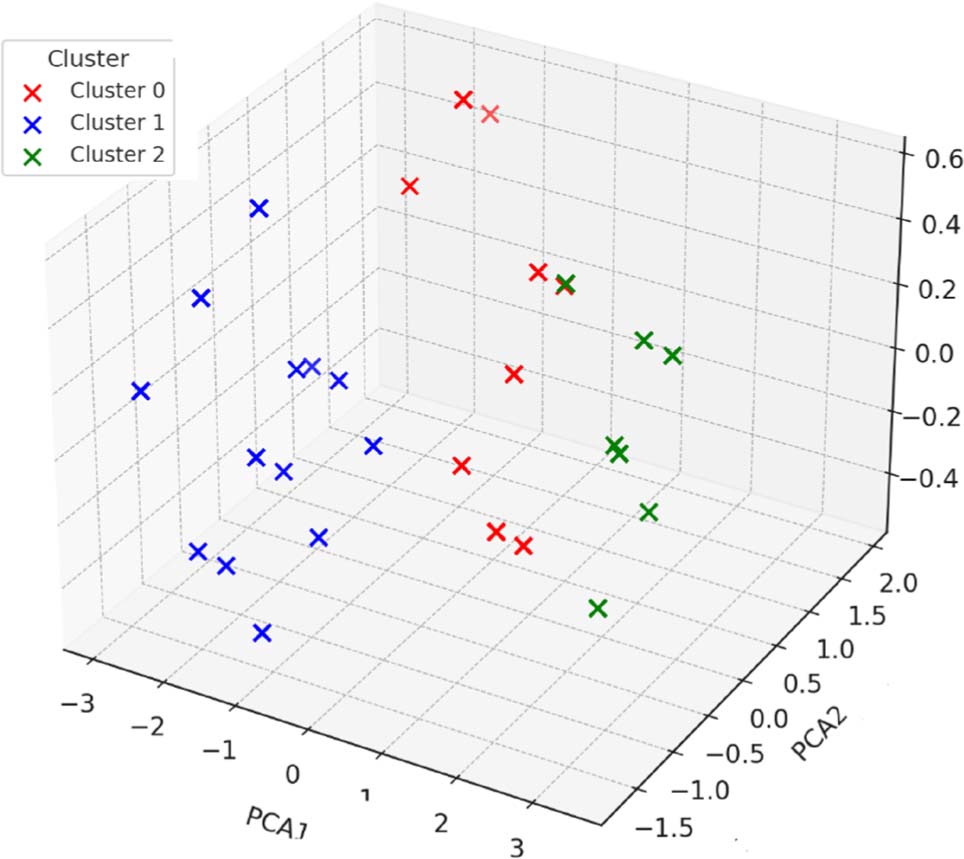
Fig. 3.
Three-dimensional PCA visualization of K-means farmer clusters
Source: own elaboration.
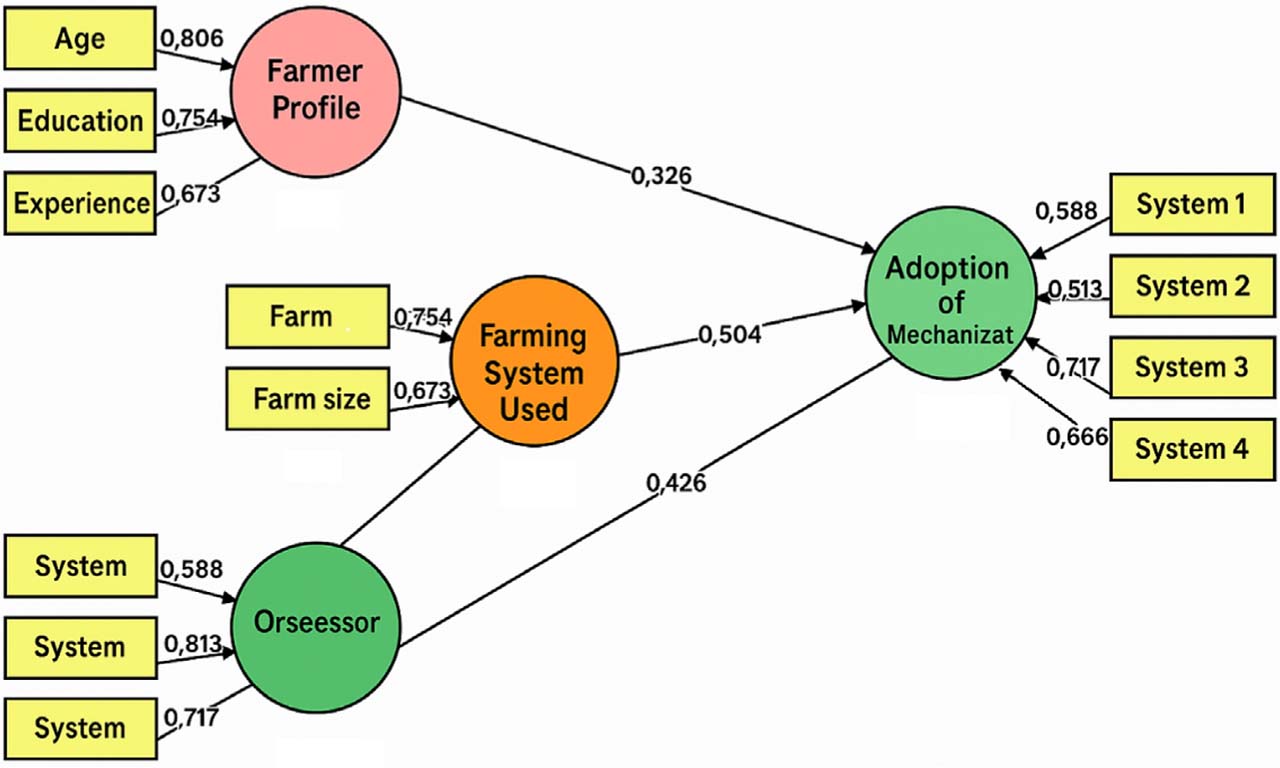
Fig. 4.
Structural model results
Source: own elaboration.
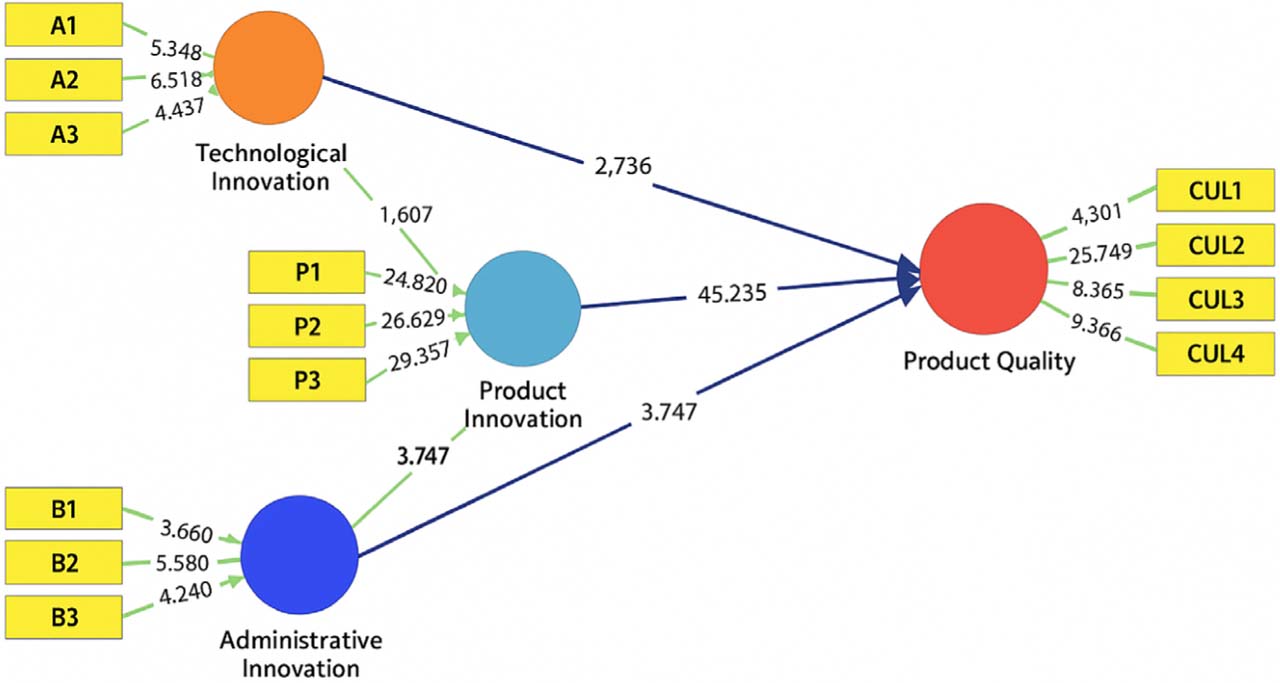
Fig. 5.
Measurement model (bootstrapping result)
Source: own elaboration.
Table 2.
Statistical analysis (N = 381)
| Constructs | Original sample (β) | Sample mean | Standard deviation | t-statistics | p-values |
|---|---|---|---|---|---|
| Administrative | 0.351 | 0.361 | 0.043 | 3.751 | 0.002 |
| Administrative → Product quality | 0.026 | 0.026 | 0.029 | 0.947 | 0.348 |
| Product innovation → Product quality | 0.946 | 0.965 | 0.026 | 42.864 | 0.001 |
| Tech. innovation → Product innovation | 0.312 | 0.316 | 0.121 | 2.689 | 0.008 |
| Tech. innovation → Product quality | 0.039 | 0.037 | 0.026 | 0.1712 | 0.112 |
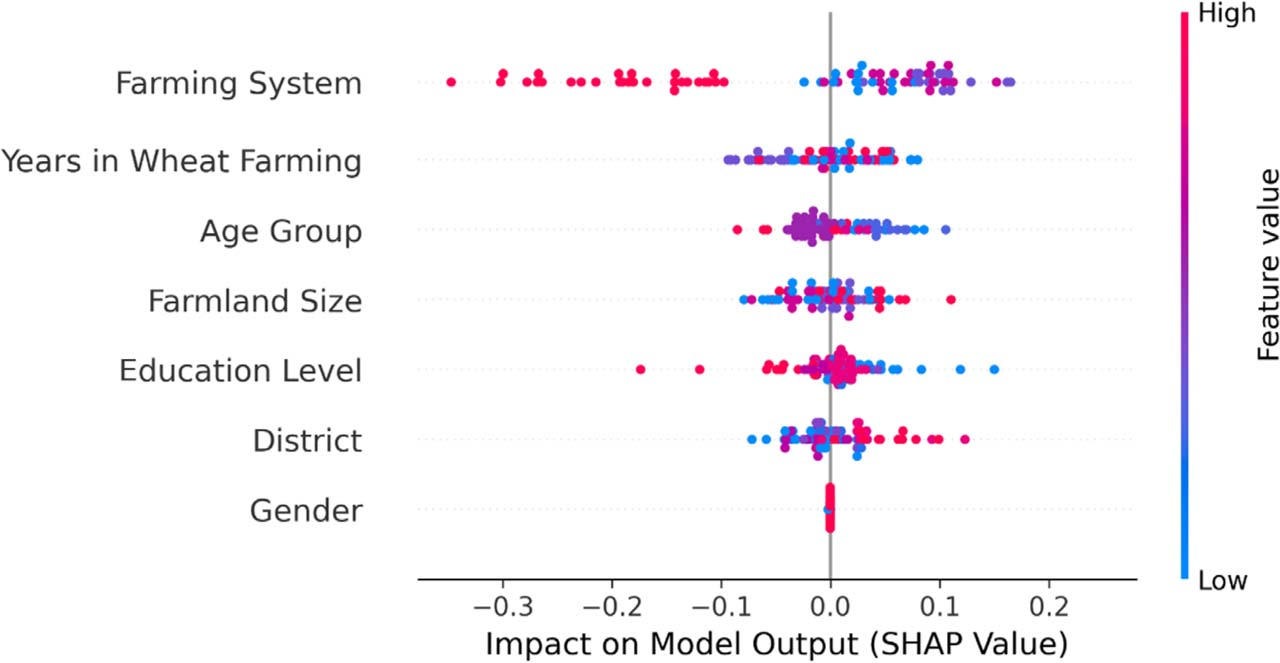
Fig. 6.
Showing SHAP-Based drivers of agribusiness
Source: own elaboration.
Table S1.
Random Forest model settings used for the training-set diagnostic
| Specification | Setting/value |
|---|---|
| Model | Random Forest regression diagnostic |
| Number of trees | 500 |
| Training/testing split | 80%/20% |
| Random seed | random_state = 42 |
| Outcome | Continuous Innovation Adoption Index |
| Predictors | Farming system; years in wheat farming; age group; farmland size; education level; district; gender |
| Training R2 | 0.819 |
| Training RMSE | 0.193 |
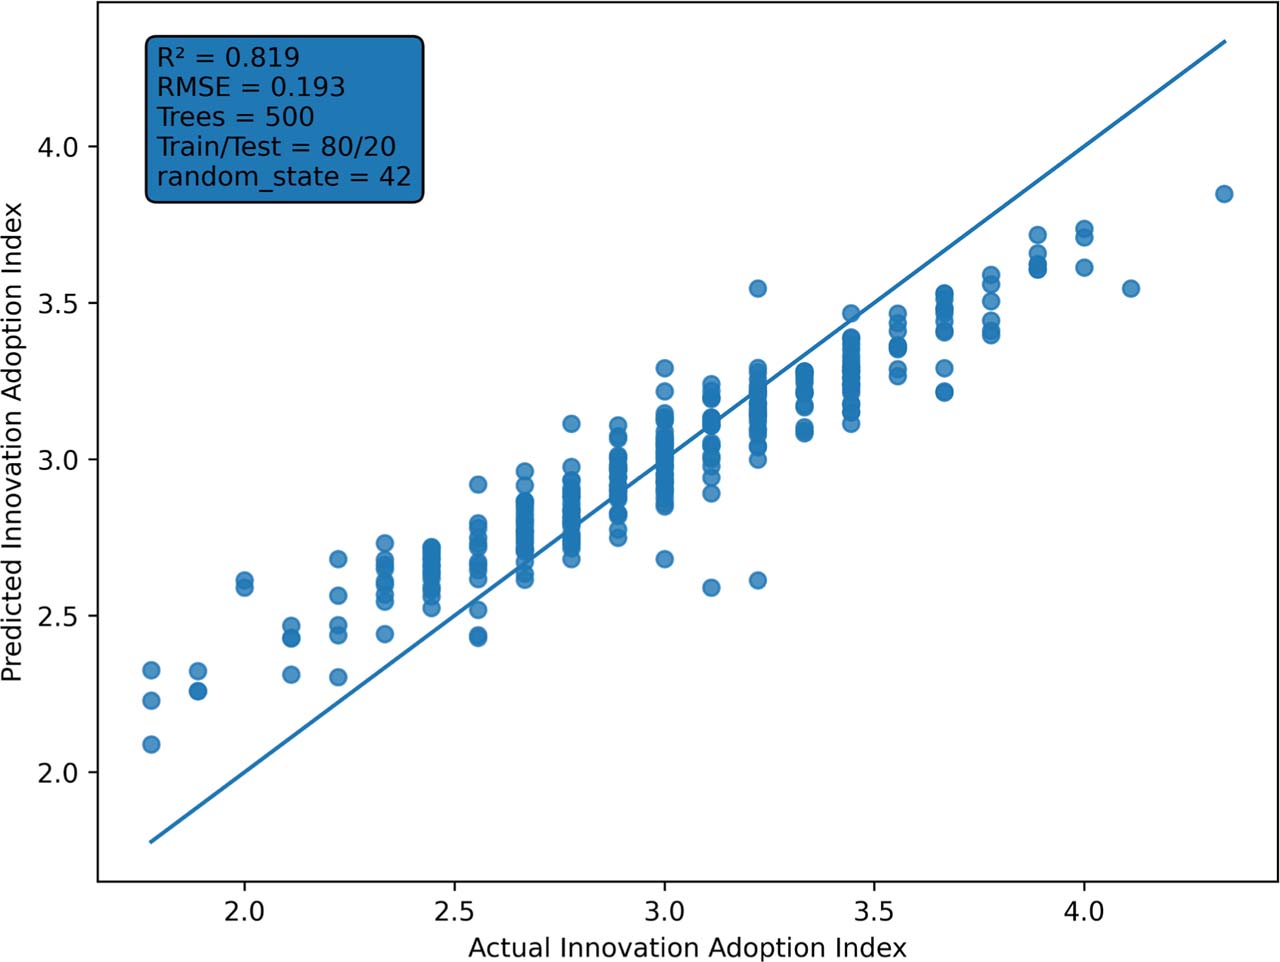
Fig. S1.
Actual versus predicted Innovation Adoption Index for the Random Forest training dataset
The model used 500 trees, an 80:20 training-testing split, and random_state = 42.
Training-set fit: R2 = 0.819, RMSE = 0.193
Source: own elaboration.