
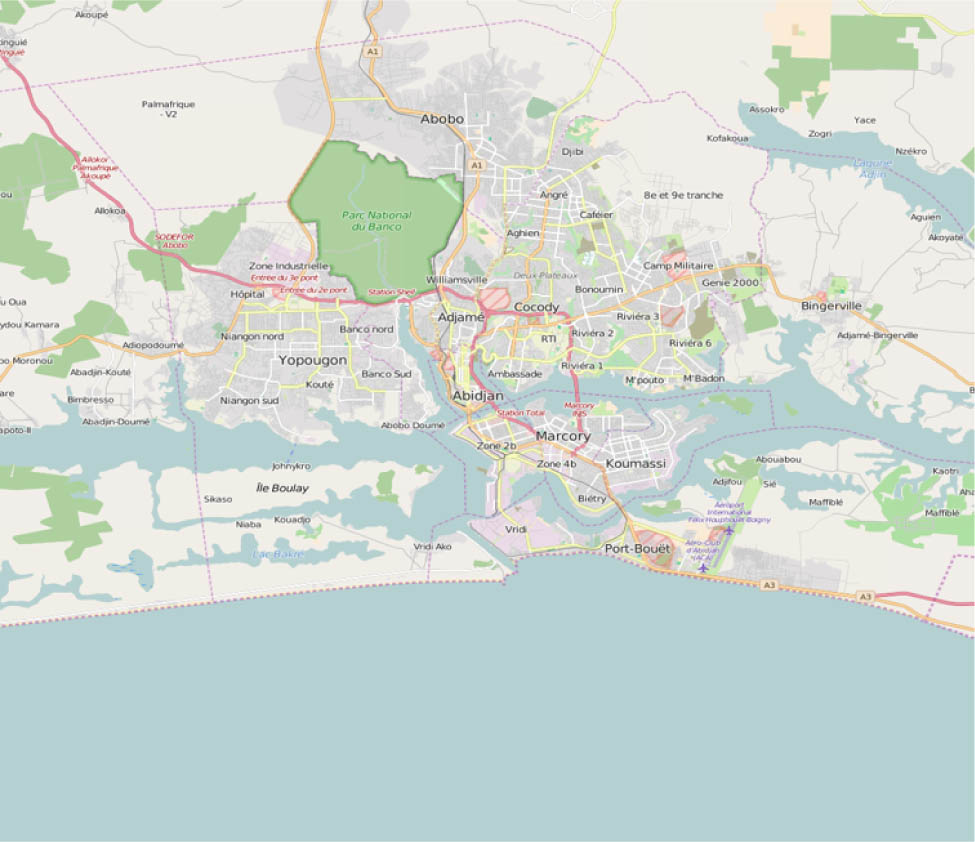
Fig. 1.
Map of Abidjan by District
Source: OpenStreetMap.
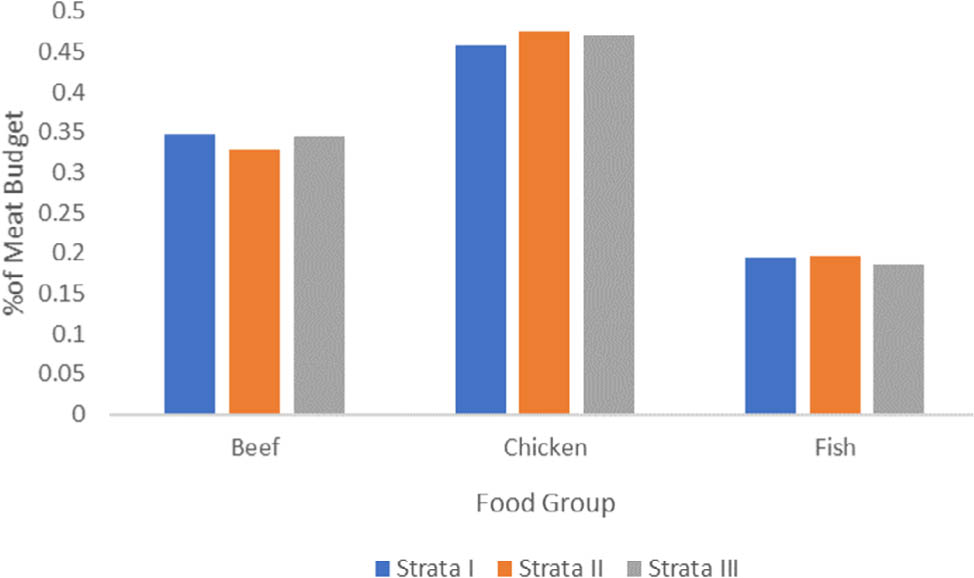
Fig. 2.
Percentage of Meat Expenditure Allocated to Beef, Chicken, and Fish by Income Strata in Abidjan
Source: own elaboration.
Table 1.
Quadratic Almost Ideal Demand System Parameter Estimates for Beef, Chicken, And Fish Using Côte d'Ivoire Data, 2019–2020
| Type of expenditure | Intercept | Price | Expenditures linear | Expenditures quadratic | ||
|---|---|---|---|---|---|---|
| Beef | Chicken | Fish | ||||
| Beef | −0.813* (−2.15) | 0.439* (2.01) | −0.001 (−0.01) | −0.438** (−2.59) | −0.284** (−3.08) | −0.017*** (−3.03) |
| Chicken | −0.152 (−0.39) | −0.001 (−0.01) | 0.292*** (3.64) | −0.291** (−2.09) | −0.107 (−1.18) | −0.005 (−0.95) |
| Fish | 1.965*** (11.94) | −0.438* (−2.59) | −0.291* (−2.09) | 0.730*** (6.29) | 0.392** (11.66) | 0.022*** (12.57) |
Table 2.
Mean Unconditional Expenditure Elasticities by Income Strata for Animal-Sourced Products Using Côte d'Ivoire Data, 2019–2020
| Food group | Income Strata | |||
|---|---|---|---|---|
| I | II | III | All | |
| Beef | 1.13 (0.17) | 1.07 (0.21) | 1.06 (0.14) | 1.06 (0.18) |
| Chicken | 0.96 (0.04) | 0.96 (0.03) | 0.95 (0.06) | 0.95 (0.05) |
| Fish | 0.85 (0.59) | 1.02 (0.55) | 1.05 (0.33) | 1.02 (0.50) |
Table 3.
Mean Unconditional Own-Price and Cross-Price Elasticities by Income Strata for Animal-Sourced Products Using Côte d'Ivoire Data, 2019–2020
| Products | Price | ||
|---|---|---|---|
| Beef | Chicken | Fish | |
| Aggregate | |||
| Beef | −0.46 (0.64) | −0.27 (0.14) | −0.12 (0.68) |
| Chicken | −0.54 (0.37) | −0.36 (0.37) | −1.06 (1.34) |
| Fish | −0.06 (0.28) | −0.31 (0.19) | 0.15 (1.57) |
| stratum 1 | |||
| Beef | −0.53 (0.50) | −0.25 (0.12) | 0.09 (0.75) |
| Chicken | −0.63 (0.40) | −0.45 (0.32) | −0.98 (1.26) |
| Fish | 0.02 (0.22) | −0.26 (0.17) | 0.04 (1.55) |
| stratum 2 | |||
| Beef | −0.40 (0.97) | −0.25 (0.10) | −0.13 (0.79) |
| Chicken | −0.59 (0.42) | −0.44 (0.25) | −1.16 (1.85) |
| Fish | −0.08 (0.43) | −0.27 (0.13) | 0.27 (2.15) |
| stratum 3 | |||
| Beef | −0.48 (0.54) | −0.29 (0.17) | −0.14 (0.51) |
| Chicken | −0.52 (0.33) | −0.33 (0.46) | −1.04 (1.07) |
| Fish | −0.06 (0.18) | −0.33 (0.24) | 0.12 (1.25) |