
INTRODUCTION
Meat consumption in Africa has often been constrained by low rural incomes in high-livestock production areas, inefficient value chains, and market access barriers (Gamba et al., 2005). However, demand for animal-sourced products typically tends to rise with population growth, increasing incomes, and urbanization, as seen in many major cities across the continent over the past decade (Bosire et al., 2017). Abidjan, Côte d'Ivoire's economic capital and largest city, exemplifies these dynamics. Over the past decade, Abidjan has experienced rapid population growth, increasing urbanization, and rising incomes, which have led to a higher demand for animal-sourced products across different income groups (Wane et al., 2021). Abidjan has significant income disparities: affluent households have greater access to diverse and higher-quality livestock products, while lower-income households struggle to afford those products regularly. In spite of these clear differences, the extent to which income variations shape consumption patterns in Abidjan remains insufficiently explored.
Recent policy formulations in Côte d'Ivoire have paid limited attention to how household consumption of animal-sourced products varies across income groups, despite their important role in diets and food security. Existing studies have focused on urban-rural differences and household characteristics (Bett et al., 2012; Tiffen, 2004; Wane et al., 2021), but few have offered evidence on income-based consumption patterns in specific African urban settings.
Chicken, beef and fish constitute the primary animal proteins among urban households in Côte d'Ivoire (Helgi Library, 2026; Wane and Ferrari, 2024). Beef is the premium option, while chicken, being more affordable, is more common among lower-income households. On average, households consume approximately 2 kg of fish, 1.6 kg of beef, and 0.8 kg of chicken per week. However, the overall consumption of these animal-sourced products is well below the recommended protein intake levels (Schönfeldt and Hall, 2012).
Despite a decade of macroeconomic growth, Côte d'Ivoire continues to face significant income disparities that impact food security and nutrition. The post-crisis period (2002–2011) was characterised by increasing poverty levels, particularly in rural areas, contributing to malnutrition and limited access to basic services (Ansah et al., 2020). While development efforts have reduced the rural-urban poverty gap, ongoing inequality, reflected in a Gini Index of 37.2, means that price changes in essential foods such as animal-sourced products affect social and geographic groups unevenly.
The objective of this study is to estimate the responsiveness of animal-sourced product demand to changes in price and expenditure across different income groups in Abidjan. To achieve this, the Quadratic Almost Ideal Demand System (QUAIDS) is employed to quantify food demand responses to shifts in income distribution. The model provides expenditure, own-price, and cross-price elasticities of three animal-sourced products (fish, beef, and chicken) by income strata. Understanding these elasticities will not only help anticipate consumption shifts and formulate policies to support vulnerable households, but may also serve as a foundation for future studies projecting fish, beef, and chicken consumption under varying economic conditions.
The QUAIDS model, an extension of the Almost Ideal Demand System, incorporates a quadratic term to capture nonlinear Engel curves and income-related consumption differences (Banks et al., 1997; Deaton and Muellbauer, 1980). Prior studies have suggested that relying only on average income growth can misrepresent demand projections, particularly in countries with wide income distributions, like Côte d'Ivoire (Cirera and Masset, 2010). Stratified elasticity estimation, as used by Zheng and Henneberry (2010), offers a more accurate approach by accounting for heterogeneity in food demand across income groups. Studies from South Africa, Ethiopia, and Ghana have demonstrated that food consumption is also influenced by factors such as gender, urbanization, and poverty status (Agbola, 2003; Ansah et al., 2020; Taljaard et al., 2004; Vigani et al., 2019). Evidence from across Africa further indicates substantial heterogeneity in food-income elasticities across food categories and countries, suggesting that income changes do not translate uniformly into changes in food demand (Colen et al., 2018). Using household-level data from the International Livestock Research Institute collected in 2019–2020 (Wane et al., 2021), this study focuses on beef, chicken, and fish to estimate income and price elasticities of demand across income strata and to inform more inclusive food policy development.
Based on average monthly earnings, households in Abidjan are classified into three income strata within this study: the bottom 25%, the middle 25–50%, and the top 50% and above. The proportion of household income allocated to food expenditure tends to reduce as income increases, as stated by the Engel law (Nikmatul et al., 2020; Cirera and Masset, 2010). Given the wide income distribution in Abidjan, a hypothetical income increase among the bottom 25% of households is expected to lead to a proportionally larger increase in food consumption compared to higher-income groups. Therefore, estimating meat demand elasticities by income strata can enhance future consumption projections. These findings may be relevant to other developing countries and regions with similar socioeconomic conditions.
RESEARCH APPROACH
Data
The data used in this study derive from the International Livestock Research Institute's (ILRI) 2019 survey in Abidjan. The information collected from respondents included monthly expenditures on food and non-food items, meat consumption habits, and other socio-demographic characteristics. The data collection process involved a structured household survey conducted across the ten districts of Abidjan between March and May 2019 (Fig. 1). A total of 562 households were randomly selected, ensuring representation from both Abidjan North and Abidjan South, which are separated by the Ebrié Lagoon. The highest number of respondents came from Yopougon, the most populous commune (31% of the sample), while the lowest was from Plateau, an area dominated by office buildings (1% of the sample). The survey used a semi-structured questionnaire designed to capture socio-demographic characteristics, household expenditures, and detailed consumption habits regarding specific meat products, including beef cuts, offal, and other sources of animal protein (Wane et al., 2021).
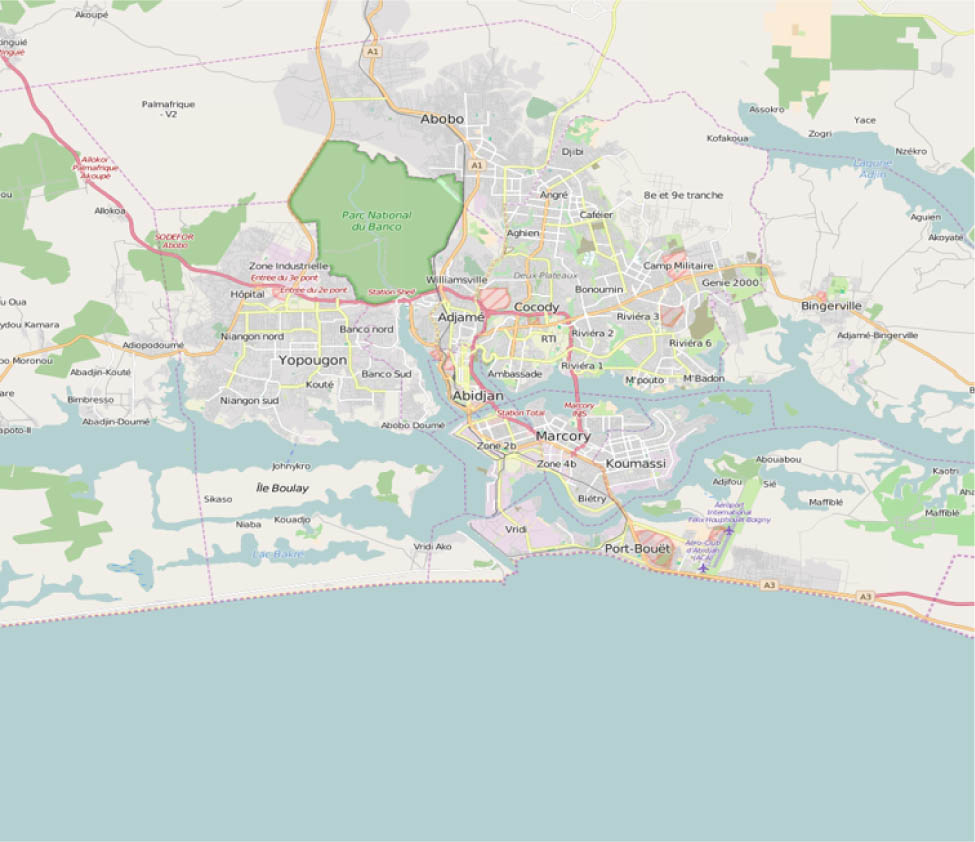
Fig. 1.
Map of Abidjan by District
Source: OpenStreetMap.
The emphasis was primarily on the consumption patterns of beef, chicken, and fish. Those three food groups constituted the most widely consumed products, respectively by 97%, 89%, and 88% of the households surveyed. Small ruminants, another important Ivorian meat consumption group, is not included due to insufficient information in the 2019 survey. The data also comprises the households' expenditure, price per kilogram of each meat category, and monthly income West African CFA Francs (Wane et al., 2021).
The average monthly household income was 213,797 West African CFA Francs, with a standard deviation of 122,131. Three income strata were generated using absolute monthly to capture how food consumption patterns vary by income levels. The classification used the observed distribution of household income in the survey and the need to maintain a sufficient number of observations within each stratum for reliable estimation. Because the sample contains relatively few households at the upper end of the income distribution, a broader upper-income stratum was used to avoid an excessively small number of observations and to preserve sufficient variation for estimating demand elasticities: Stratum I has 183 households, earning less than 160,000 CFA Francs per month; Stratum II comprises families with a monthly income ranging from 160,000 to 250,000 CFA Francs (187 households); Stratum III includes all households with income above 250,000 CFA Francs (192 households). Thus, Stratum III covers a wider income range than the first two strata.
It is important to note that this classification does not imply that households within Stratum III are homogeneous; rather, it represents the upper segment of the observed income distribution. Figure 2 presents the percentage of all budgets allocated to beef, chicken, and fish under identical prices in each of the three income strata. This figure suggests dissimilarities in the budget portions allocated to animal-sourced products for each income stratum. For instance, a larger proportion of the households' meat-related budget is used for beef purchases in the first stratum than the two other income classes. Chicken purchases account for a more substantial budget share in strata II and III, whereas the expenditure share for fish in the three strata remains relatively balanced (Fig. 2). The price and expenditure elasticities across income groups are computed and discussed in the following sections.
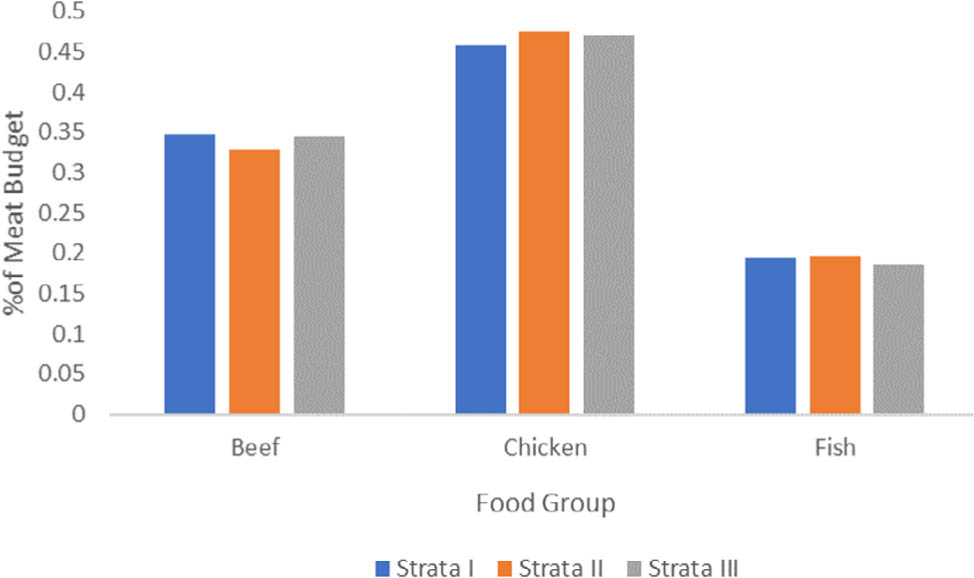
Fig. 2.
Percentage of Meat Expenditure Allocated to Beef, Chicken, and Fish by Income Strata in Abidjan
Source: own elaboration.
QUAIDS Model
In this study, the response of animal-sourced product consumption across income strata in Abidjan is determined in three steps. First, the impact of own-price variations and changes in other animal-source product prices on consumption is estimated for each food group. Second, household expenditure effects on consumption are quantified for each food group. Both steps incorporate mean income growth in the estimation of price and expenditure elasticities. Finally, in the third step, price and expenditure elasticities are estimated separately across the three income strata. Details on income strata and distributions are provided in the data section.
In line with demand theory assumptions, the QUAIDS model captures the nonlinear Engel relationships between food-related expenditures and total household expenditures. The linear approximate Almost Ideal Demand System is often used with time series data (Delport et a., 2017), while the QUAIDS is commonly used when cross-section (Ghahramanzadeh et al., 2022) or panel data (Wang et al., 2025) are available. The QUAIDS model is deemed appropriate when the quadratic income term's effect on each food group's expenditure share is statistically significant. Additionally, the QUAIDS model assumes that the three food groups are weakly separable from one another and from other non-food items that make up total consumer expenditure:
where:wi – is the budget share of food group i ∈ (1,2,3)
pj – is the price of the jth food product
m – is household expenditures on food products
αi, γij, βi, and λi – are the parameters to be estimated
ɛi∼(0,σɛ2) – is the random error term
b(p) – is the Cobb-Douglas price aggregator, which is defined as
and the price index a(p): where:
Deaton and Muellbauer (1980) and Banks et al. (1997) specified a value for α0 that is slightly smaller than the lowest value of log(m) in the data (Lakkakula et al., 2016; Poi, 2012).
A two-step approach was used to test and correct for potential endogeneity in the household expenditure variable (Dhar et al., 2003). First, endogeneity was tested by running a reduced-form regression of the expenditure variable on a set of instrumental variables, including household size and education level indicators (primary, secondary, and university education). These instruments were chosen based on their expected correlation with household expenditure but not directly with the demand for specific food groups. The residuals from this regression were then extracted and the following hypothesis was tested:
H0: Cov(m,ɛ) = 0, expenditure (m) is exogenous, meaning it is uncorrelated with the error term (ɛ) in the demand system model
HA: Cov(m,ɛ) ≠ 0, expenditure is endogenous.
The Wald test results indicated that the residuals were statistically significant (χ2 = 56.67, p-value = 0.0000), rejecting the null hypothesis and confirming the presence of endogeneity in the expenditure variable.
A two-stage least squares (2SLS) approach was used to correct for endogeneity. In the first stage, the expenditure variable was predicted using the instrumental variables, generating the fitted values ( ). This step removed the endogenous variation from the expenditure variable m. In the second stage, the endogenous m was replaced with in the demand system estimation, allowing for consistent estimation of the parameters.
As well as the AIDS model, QUAIDS also requires restrictions to be consistent with utility maximisation; the additivity, homogeneity, and symmetry restrictions are imposed as
The uncompensated (Marshallian) conditional elasticities are computed from the estimated parameters of the QUAIDS demand model (Krinsky and Robb, 1986) as:
The Kronecker delta, δij, is equal to 1 when i = j and 0 otherwise. The expenditure elasticity for good i is:
Under the assumption of fixed mean budget share, the standard errors of the elasticities are computed at the mean using the distribution of a linear transformation of a normally distributed random vector usual formula (Mdafri and Brorsen, 1993). The previous two equations (7) and (8) are reformulated as matrices:
where:v – denotes the vector of estimated price and expenditure elasticities
n – is a vector of the previously estimated QUAIDS model parameters (γ, λ, α, β)
F – is a matrix of scalars.
Var(v), the variance-covariance matrix of v, can be expressed as a transformation of the variance-covariance matrix of n, Var(n):
The elasticities derived from Equations 7 and 8 are conditional elasticities, since they are contingent on the level of expenditures for the animal-sourced product category. The procedure for converting own-price and cross-price elasticities to unconditional elasticities follows Edgerton's (1997) method. Specifically, the conversion of own-price elasticities to unconditional price elasticities is given by:
where:ηii – is the unconditional own-price elasticity for food group i
eii – the corresponding conditional own-price elasticity
μi – is the expenditure elasticity for product i
wi – is the budget share allocated to that product
η* – captures the unconditional own-price elasticity of the overall meat group (including beef, fish, chicken, pork, and small ruminants).
This aggregate elasticity is derived from data on multiple meat products from Côte d'Ivoire (Mutondo, 2007).
To convert the cross-price elasticities into unconditional elasticities, a similar approach is applied:
where:ηij – unconditional cross-price demand elasticity between animal-derived products i and j.
The unconditional expenditure elasticities can be obtained using the following regression:
where:τi – is the unconditional expenditure elasticity for each animal-sourced product in the system
τ* – is household's expenditure elasticity for the meat group in aggregate (Rickertsen, 1998).
Both η* and τ* are estimated using the double-log model below:
where:zi – is the quantity of meat consumed by household i
P – is the average price of meat
TEi – is the total expenditure on animal sourced products.
RESULTS AND DISCUSSION
The results from the Quadratic Almost Ideal Demand System (QUAIDS) model provide estimates of how households in Côte d'Ivoire adjust their budget allocations for animal-sourced products in response to changes in prices and total expenditures. These estimates, presented in Table 1, show the response of meat budget shares to both price changes and overall expenditure variations for beef, chicken, and fish. These relationships are important for policymakers and economists aiming to understand the impact of price fluctuations on consumption patterns, especially for essential food items such as meat. The findings suggest that a 1% increase in the own-price of beef, chicken, or fish leads to different responses in the proportion of a household's budget allocated to each of these products. For instance, a 1% increase in the price of beef results in a 0.43% increase in the beef budget share. This indicates that households allocate a slightly higher portion of their budget to beef as its price rises. Similarly, the budget share for chicken increases by 0.29%, and the budget share for fish rises by 0.73%. Given those findings, households may substitute for fish more significantly than beef or chicken when the prices of those other meats rise (Table 1).
Table 1.
Quadratic Almost Ideal Demand System Parameter Estimates for Beef, Chicken, And Fish Using Côte d'Ivoire Data, 2019–2020
| Type of expenditure | Intercept | Price | Expenditures linear | Expenditures quadratic | ||
|---|---|---|---|---|---|---|
| Beef | Chicken | Fish | ||||
| Beef | −0.813* (−2.15) | 0.439* (2.01) | −0.001 (−0.01) | −0.438** (−2.59) | −0.284** (−3.08) | −0.017*** (−3.03) |
| Chicken | −0.152 (−0.39) | −0.001 (−0.01) | 0.292*** (3.64) | −0.291** (−2.09) | −0.107 (−1.18) | −0.005 (−0.95) |
| Fish | 1.965*** (11.94) | −0.438* (−2.59) | −0.291* (−2.09) | 0.730*** (6.29) | 0.392** (11.66) | 0.022*** (12.57) |
The results also indicate cross-price interdependence among the animal-sourced products. A 1% increase in the price of beef leads to a 0.001% reduction in the chicken budget share and a 0.44% reduction in the fish budget share. Similarly, a 1% increase in the price of chicken is associated with a 0.29% reduction in the fish budget share. These negative cross-price effects indicate gross complementarity among these products rather than substitution. These relationships should be interpreted as changes in budget shares from the estimated QUAIDS system rather than as direct evidence of substitution between individual products.
Consumers' decisions to increase their total expenditure on animal-sourced products can be driven by various factors, including changes in commodity prices, household disposable income, or consumption preferences. Understanding how total meat expenditure impacts the distribution of household budgets across different animal-sourced products is essential for analysing consumer behaviour, particularly in the context of developing economies, where food consumption patterns tend to evolve in response to economic shifts. The results in Table 1 suggest that as total meat expenditure rises, the proportion of household budget allocated to beef and chicken decreases by 0.28% and 0.11%, respectively. This indicates that as households spend more on animal-sourced products, they allocate a smaller portion of their budget to beef and chicken. This could be due to households diversifying their consumption away from these products as their income rises, and shifting towards other meat products such as fish, which shows different price and expenditure response patterns. As households' total meat expenditure increases, they tend to allocate a larger portion of their budget to fish (Table 1).
The quadratic expenditure term in the model may help explain how the relationship between total meat expenditure and budget allocation changes as expenditures grow. The negative quadratic expenditure coefficients for beef and chicken indicate a nonlinear relationship between expenditure and budget shares. In particular, the negative coefficients suggest that the budget-share response to expenditure becomes weaker as expenditure increases, which is consistent with a nonlinear Engel relationship. In contrast, the positive quadratic coefficient for fish indicates an increasing expenditure-share response over the relevant range of expenditure (Table 1).
Food expenditure, own-price, and cross-price elasticities
Food expenditure, own-price, and cross-price elasticities for the three food groups across three income strata are reported in Tables 2 and 3. Unconditional elasticities are based on previously estimated parameters in equation (1) and sample means of the explanatory variables. Across income strata, the results reveal the reversal of expenditure elasticities for different food categories (Table 2). This outcome may reflect a change in consumer preferences at different income levels (Nzuma and Sarker, 2010). For instance, the results suggest a more elastic expenditure response for the low-income stratum than the higher income groups for the beef category. Conversely, fish expenditure displays the opposite pattern, and is characterised by a lower elasticity at the lower income stratum than other income levels. Elasticity variations across income strata are minimal for chicken. The aggregated expenditure elasticities are 1.06 for beef, 0.95 for chicken, and 1.02 for fish.
Table 2.
Mean Unconditional Expenditure Elasticities by Income Strata for Animal-Sourced Products Using Côte d'Ivoire Data, 2019–2020
| Food group | Income Strata | |||
|---|---|---|---|---|
| I | II | III | All | |
| Beef | 1.13 (0.17) | 1.07 (0.21) | 1.06 (0.14) | 1.06 (0.18) |
| Chicken | 0.96 (0.04) | 0.96 (0.03) | 0.95 (0.06) | 0.95 (0.05) |
| Fish | 0.85 (0.59) | 1.02 (0.55) | 1.05 (0.33) | 1.02 (0.50) |
Table 3.
Mean Unconditional Own-Price and Cross-Price Elasticities by Income Strata for Animal-Sourced Products Using Côte d'Ivoire Data, 2019–2020
| Products | Price | ||
|---|---|---|---|
| Beef | Chicken | Fish | |
| Aggregate | |||
| Beef | −0.46 (0.64) | −0.27 (0.14) | −0.12 (0.68) |
| Chicken | −0.54 (0.37) | −0.36 (0.37) | −1.06 (1.34) |
| Fish | −0.06 (0.28) | −0.31 (0.19) | 0.15 (1.57) |
| stratum 1 | |||
| Beef | −0.53 (0.50) | −0.25 (0.12) | 0.09 (0.75) |
| Chicken | −0.63 (0.40) | −0.45 (0.32) | −0.98 (1.26) |
| Fish | 0.02 (0.22) | −0.26 (0.17) | 0.04 (1.55) |
| stratum 2 | |||
| Beef | −0.40 (0.97) | −0.25 (0.10) | −0.13 (0.79) |
| Chicken | −0.59 (0.42) | −0.44 (0.25) | −1.16 (1.85) |
| Fish | −0.08 (0.43) | −0.27 (0.13) | 0.27 (2.15) |
| stratum 3 | |||
| Beef | −0.48 (0.54) | −0.29 (0.17) | −0.14 (0.51) |
| Chicken | −0.52 (0.33) | −0.33 (0.46) | −1.04 (1.07) |
| Fish | −0.06 (0.18) | −0.33 (0.24) | 0.12 (1.25) |
The estimated own-price elasticities of beef vary across income strata and are larger for the lower income stratum. A 1% price increase reduces beef consumption by 0.53% in the lowest income group, compared to a 0.48% reduction in the highest income group (Table 3). This pattern is consistent with economic theory, as lower-income consumers generally allocate a larger share of their food budget to meat products and are therefore more sensitive to price fluctuations (Zheng and Henneberry, 2010). On the other hand, higher-income households are less constrained by price changes and may continue to purchase beef even when prices rise. However, the relatively close elasticity estimates across strata suggest that beef is a culturally and nutritionally valued food product across all income levels in Abidjan.
The estimated own-price elasticity for chicken is larger in absolute value for the lower-income stratum, and observed variations are larger than for the beef category. A 1% increase in the chicken price is associated with an estimated 0.45% reduction in chicken consumption in the lowest-income stratum, compared to 0.44% and 0.33% reductions for the second and third strata, respectively. The heightened price sensitivity at the lower end of the income distribution indicates that increases in chicken prices could significantly affect the dietary quality of vulnerable households. Similar findings have been reported in empirical studies in Nigeria (Aborisade et al., 2024) and Ghana (Owusu et al., 2025), where estimates document inelastic chicken demand for poorer households due to its central role in West African diets.
Fish exhibits positive estimated own-price elasticities across all income strata, with estimates of 0.04, 0.27, and 0.12 for Strata I, II, and III, respectively. These estimates are at odds with standard demand theory and should therefore be interpreted with caution. One possible explanation is that fish is a heterogeneous category comprising products that differ substantially in species, quality, and price. Aggregating these products into a single fish category may mask substitution between fish types and may contribute to the positive estimated elasticity. However, the available data do not permit separate estimation by fish subcategory, and therefore the within-category substitution mechanism cannot be directly tested. The relatively large standard errors associated with these estimates also suggest that the positive price responses should not be interpreted as strong statistical evidence of increasing fish consumption when prices rise. Similar within-category substitution has been documented in Senegal (Lancker and Bronnmann, 2022), although the present study cannot establish whether the same mechanism operates in Abidjan.
Most cross-price elasticities are negative, indicating gross complementarity among the animal-sourced products in the demand system. Consequently, an increase in the price of one protein source is generally associated with a reduction in the demand for another, rather than substitution between the two products. An exception is observed in the lowest-income stratum, where the positive cross-price elasticity of fish with respect to the beef price (0.09) suggests substitution toward fish when beef becomes more expensive.
CONCLUSIONS
Food consumption is a key indicator of economic development. Over the past decade, Abidjan has experienced significant economic and population growth, accompanied by persistent income inequalities among households. This study examines the demand dynamics for animal-derived products, specifically beef, chicken, and fish, across different income groups in Abidjan. These three products are important sources of protein in Côte d'Ivoire, with few viable substitutes. Consequently, price increases in these products pose serious risks to households' food consumption, particularly for low-income households.
Our empirical findings indicate that the impact of price increases for animal-sourced products on consumption varies significantly across the three income groups. Low-income households exhibit more substantial reductions in consumption in response to price increases compared to higher-income groups. Additionally, variations in food consumption patterns are observed in response to changes in consumer expenditure. As income decreases, the expenditure elasticity for beef increases, whereas the expenditure elasticity for fish decreases.
The estimated price and expenditure elasticities provide crucial insights into the demand for animal-sourced products in Abidjan, including important patterns related to income distribution. The results also have several policy implications. Firstly, since low-income households show greater sensitivity to beef and chicken price increases, targeted measures that reduce the impact of price shocks on vulnerable households could be considered. These include temporary food assistance, targeted transfers, or measures that improve the affordability and efficiency of chicken and beef supply chains. Secondly, improving access to affordable varieties of fish could involve strengthening the market infrastructure, reducing post-harvest losses, and improving the distribution of lower-cost fish products. Policies aimed at improving domestic fish supply and market efficiency may therefore be particularly relevant for maintaining access to affordable animal-source foods. Finally, the generally negative cross-price elasticities indicate complementarity among the products in the demand system. Consequently, policies affecting the price or availability of one animal-source food may generate spillover effects on demand for other products, suggesting that food-price and nutrition policies should consider the animal-source-food market as an interconnected system rather than targeting individual products in isolation.
This study has several limitations. Firstly, the cross-sectional nature of the data limits the ability to examine dynamic demand responses or establish causal relationships between income, prices, and consumption. Secondly, the income strata were defined according to the observed income distribution, resulting in a broader upper-income group because relatively few households were located at the top of the distribution. This may mask heterogeneity within the highest-income stratum and affect the estimated elasticities. Thirdly, the analysis is restricted to beef, chicken, and fish because of data availability and therefore does not capture substitution with other animal-source foods. These limitations should be considered when interpreting the findings and assessing their generalisability beyond the surveyed households in Abidjan. Future research could address these constraints by using larger and longitudinal datasets, incorporating demographic characteristics and meat market outlets, and examining how changes in income distribution may affect future demand for animal-source foods in Abidjan.