
Table 1.
Variables and data sources
| Symbol | Variable and definition | Transformation | Unit | Source |
|---|---|---|---|---|
| LPROD | FAOSTAT “Cereals, primary” – Production; annual national cereal production. | Natural logarithm | Metric tonnes | FAOSTAT |
| LHA | FAOSTAT “Cereals, primary” – Area harvested; annual area that reaches harvest. | Natural logarithm | Hectares | FAOSTAT |
| LPREC | CCKP national (ADM0) precipitation indicator (pr); annual accumulated precipitation. | Natural logarithm | Millimetres | World Bank CCKP |
| LTEMP | CCKP national (ADM0) average surface-air temperature indicator (tas). | Natural logarithm; level-form robustness check | Degrees Celsius | World Bank CCKP |
| D1 | Low-precipitation anomaly indicator: 1 if PREC < 67.72 mm; 0 otherwise. | Deterministic binary control | Binary | Authors’ calculation |
| D2 | High-precipitation anomaly indicator: 1 if PREC > 95.83 mm; 0 otherwise. | Deterministic binary control | Binary | Authors’ calculation |
Table 2.
Descriptive statistics
| Statistic | LPROD | LHA | LPREC | LTEMP |
|---|---|---|---|---|
| Mean | 14.9322 | 14.7335 | 4.3888 | 3.1617 |
| Median | 15.0761 | 14.8036 | 4.4343 | 3.1633 |
| Maximum | 15.6182 | 15.1140 | 4.6774 | 3.1855 |
| Minimum | 13.6762 | 13.8720 | 4.0486 | 3.1280 |
| Std. Dev. | 0.5174 | 0.3185 | 0.1793 | 0.0125 |
| Skewness | –1.0809 | –1.2807 | –0.4489 | –0.8860 |
| Kurtosis | 3.2517 | 4.0177 | 1.9246 | 4.1667 |
| Jarque-Bera | 6.9089 | 11.0788 | 2.8618 | 6.5651 |
| Probability (Jarque-Bera) | 0.0316 | 0.0039 | 0.2390 | 0.0375 |
| Observations | 35 | 35 | 35 | 35 |
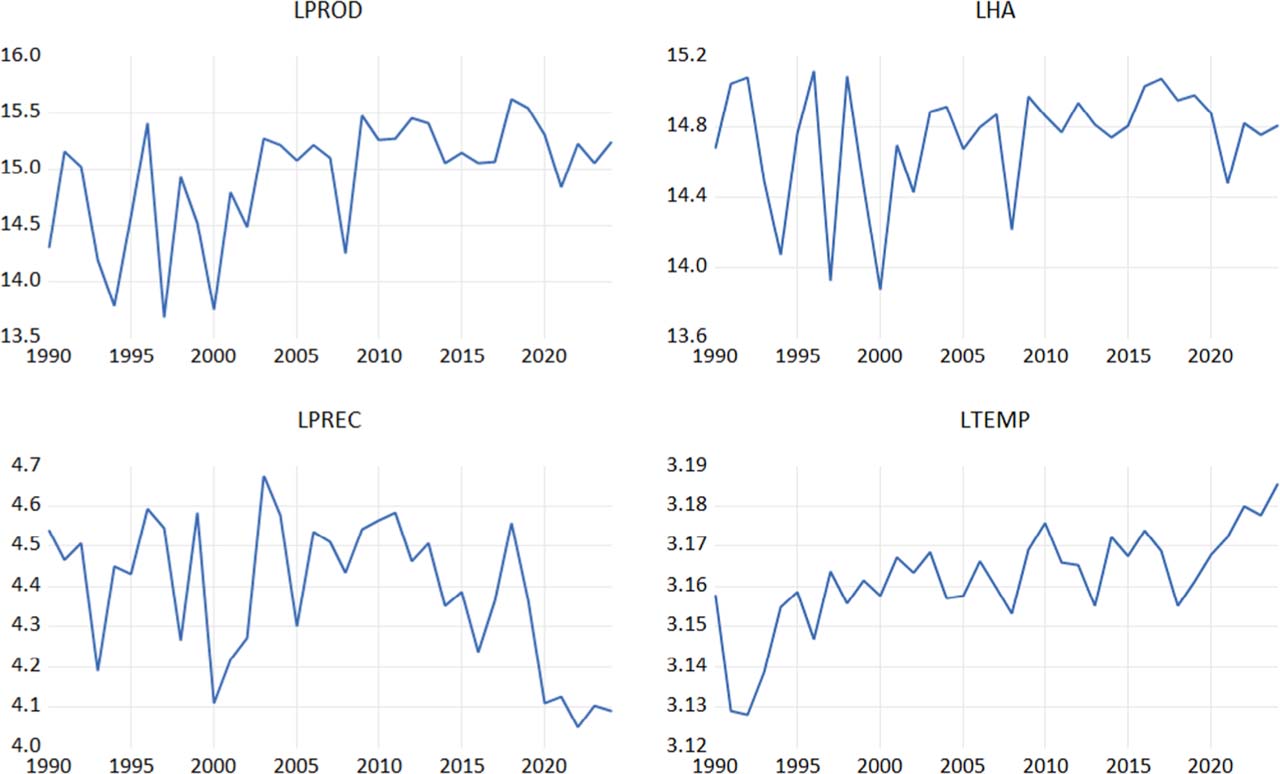
Fig. 1.
Time-series plots of the log-transformed variables, 1990–2024
Source: own elaboration based on FAOSTAT and World Bank Climate Change Knowledge Portal data.
Table 3.
Unit-root and stationarity tests
| Panel A. Conventional ADF and PP unit-root tests | |||||||
| Variable | ADF: C | ADF: C+T | ADF: none | PP: C | PP: C+T | PP: none | Decision |
| LPROD | –4.4949*** | –5.7846*** | 0.1515 | –4.6596*** | –5.7846*** | 0.5140 | I(0) |
| LHA | –5.7619*** | –3.9701** | 0.4212 | –5.9625*** | –6.3377*** | 0.0718 | I(0) |
| LPREC | –3.3528** | –3.8020** | –0.6048 | –3.2801** | –3.7718** | –1.4537 | I(0) |
| LTEMP | –2.1619 | –4.1701** | 0.4554 | –1.9491 | –4.2693*** | 1.4484 | Stationary under trend specification |
| Panel B. Zivot-Andrews unit-root test with one endogenous structural break | |||||||
| Variable | ZA statistic | Selected lag | Break year | 5% critical value | Decision | ||
| LPROD | –7.1064 | 0 | 2002 | –5.0733 | Reject unit root | ||
| LHA | –4.6927 | 3 | 2016 | –5.0733 | Do not reject | ||
| LPREC | –5.6676 | 0 | 2002 | –5.0733 | Reject unit root | ||
| LTEMP | –5.8781 | 0 | 1996 | –5.0733 | Reject unit root | ||
[i] Panel A: C = constant; C+T = constant and deterministic trend. The null hypothesis is a unit root. LTEMP rejects the unit-root null only when the trend is included.
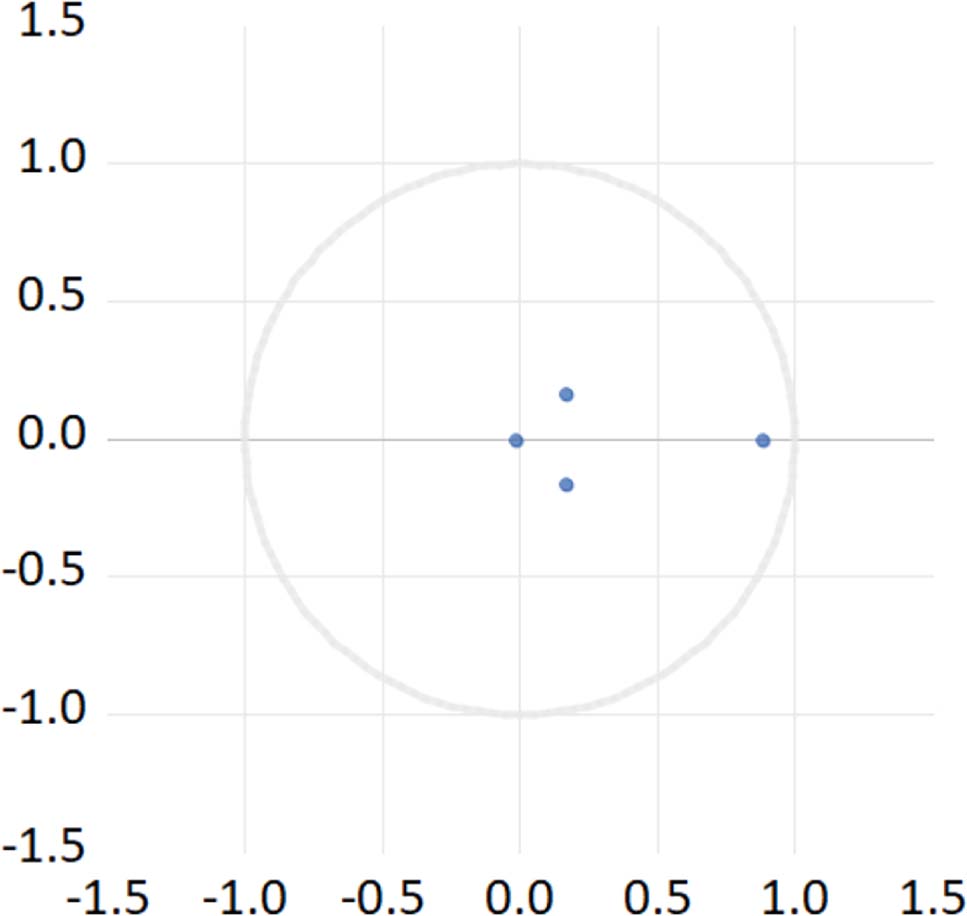
Fig. 2.
VAR Stability Diagnostic Based on Inverse AR Roots
Source: own elaboration based on EViews stability diagnostics.
Table 4.
VAR lag order selection
Table 5.
Quandt-Andrews unknown-breakpoint tests for VAR parameter stability
| VAR equation | Maximum LR F | Candidate year | p-value | Decision at 5% |
|---|---|---|---|---|
| LPROD | 2.4787 | 2001 | 0.3049 | Do not reject stability |
| LHA | 4.1509 | 1997 | 0.0192 | Reject stability |
| LPREC | 2.1000 | 2003 | 0.4865 | Do not reject stability |
| LTEMP | 3.1885 | 1997 | 0.1052 | Do not reject stability |
Table 6.
VAR residual diagnostic tests
| Diagnostic | Statistic | df | p-value | Additional statistic | Additional p | Decision |
|---|---|---|---|---|---|---|
| LM, lag 1 | LRE = 7.6842 | 16 | 0.9577 | Rao F = 0.4564 | 0.9584 | No serial correlation |
| LM, lag 2 | LRE = 16.8861 | 16 | 0.3930 | Rao F = 1.0745 | 0.3978 | No serial correlation |
| LM, lags 1–2 | LRE = 32.4358 | 32 | 0.4453 | Rao F = 1.0147 | 0.4686 | No serial correlation |
| Joint skewness | – | 4 | 0.3859 | – | – | Normality not rejected |
| Joint kurtosis | – | 4 | 0.9030 | – | – | Normality not rejected |
| Joint Jarque-Bera | JB = 5.1957 | 8 | 0.7365 | – | – | Normality not rejected |
| White heteroskedasticity | – | 100 | 0.1359 | – | – | Homoskedasticity not rejected |
Table 7.
VAR Granger causality/block-exogeneity Wald tests for LPROD
| Excluded variable | df | Chi-square | p-value |
|---|---|---|---|
| LHA | 1 | 1.3587 | 0.2438 |
| LPREC | 1 | 0.1166 | 0.7327 |
| LTEMP | 1 | 2.9804 | 0.0843 |
| All three | 3 | 8.6413 | 0.0345 |
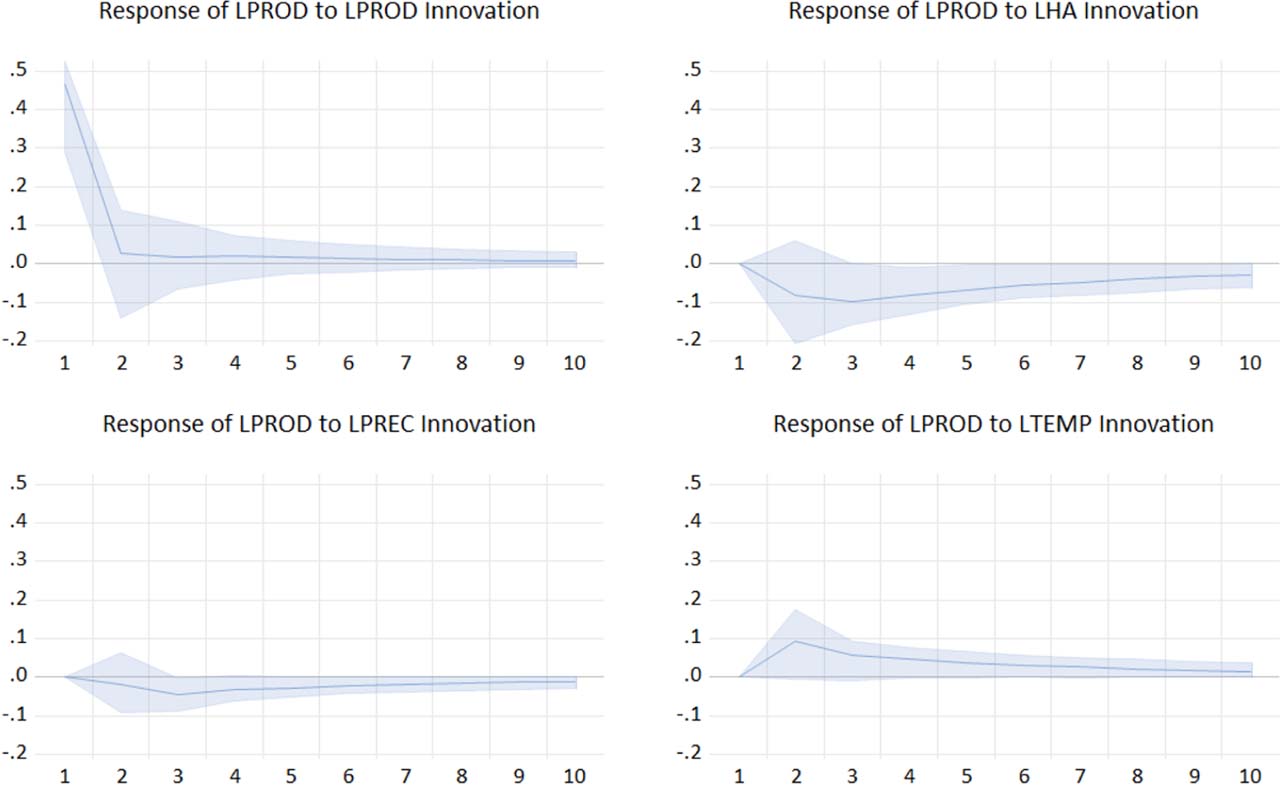
Fig. 3.
Bootstrap Impulse Response Functions of LPROD
Note: Shaded bands are 95% standard percentile-bootstrap confidence intervals based on 2,000 EViews repetitions. Benchmark Cholesky ordering: LPROD, LHA, LPREC, LTEMP.
Table 8.
Variance decomposition of total cereal production (LPROD)
| Period | S.E. | LPROD (%) | LHA (%) | LPREC (%) | LTEMP (%) |
|---|---|---|---|---|---|
| 1 | 0.4647 | 100.00 | 0.00 | 0.00 | 0.00 |
| 2 | 0.4827 | 93.07 | 2.92 | 0.12 | 3.87 |
| 4 | 0.5078 | 84.35 | 8.80 | 1.29 | 5.55 |
| 6 | 0.5194 | 80.82 | 11.22 | 1.69 | 6.24 |
| 8 | 0.5249 | 79.22 | 12.32 | 1.88 | 6.56 |
| 10 | 0.5276 | 78.47 | 12.85 | 1.97 | 6.71 |
[i] Values are descriptive point estimates of LPROD forecast-error variance shares under the benchmark Cholesky ordering. They are conditional on the model, horizon and identification scheme; uncertainty intervals are not reported, so no inferential significance is attached to differences among the shares.
Table 9.
Summary of robustness checks
| Robustness check | Benchmark | Robustness result | Interpretation |
|---|---|---|---|
| Trend-augmented VAR | Joint Granger p = 0.0345 | With trend: joint p = 0.6883; LHA = 0.9278, LPREC = 0.2841, LTEMP = 0.5202 | Benchmark joint predictive result is trend-sensitive |
| Alternative Cholesky ordering | H10 FEVD: 78.47, 12.85, 1.97, 6.71% | Alternative: LPROD 78.47%, LHA 14.48%, LPREC 0.17%, LTEMP 6.87% | Shares depend on recursive identification; none is interpreted causally |
| Temperature in levels | Joint p with LTEMP = 0.0345 | With TEMP: joint p = 0.0341; LHA = 0.2424, LPREC = 0.7365, TEMP = 0.0832 | Log transformation does not drive the benchmark result; trend sensitivity remains stronger |
| Quandt-Andrews tests | Benchmark assumes parameter stability | Stability rejected only for LHA (p = 0.0192); not rejected for LPROD, LPREC or LTEMP | Instability is equation-specific; no common break is imposed |
| Bootstrap IRFs | Conventional asymptotics are weak in N = 35 | 2,000-repetition 95% percentile-bootstrap bands; LTEMP horizon-2 lower bound effectively zero | Climate IRF claims are weakened by bootstrap uncertainty |
| Without D1 and D2 | Joint p = 0.0345; H10 LPREC FEVD = 1.97% | Joint p ≈ 0.0506; LTEMP p ≈ 0.0357; H10 FEVD: LPROD 75.14%, LHA 10.06%, LPREC 7.40%, LTEMP 7.41% | D1/D2 absorb part of LPREC information; precipitation results are specification-sensitive |