
INTRODUCTION
Cereal production is a strategic component of Algeria’s agricultural economy and an important part of the country’s broader food-supply system. In semi-arid Mediterranean environments, output is exposed to irregular rainfall, temperature stress and recurrent drought, while also reflecting land use, input conditions and previous production outcomes. International evidence links climate variability and extreme weather to crop-output instability, especially in water-constrained systems (Lobell and Field, 2007; Wheeler and von Braun, 2013; Ray et al., 2015; Lesk et al., 2016). Climate and land assessments likewise show that agricultural exposure arises from interacting biophysical and institutional constraints rather than from any single weather indicator (FAO, 2016; IPCC, 2019).
Algeria is a relevant case because cereal production remains heavily rainfed and operates in a policy setting shaped by supply stability, import exposure and water scarcity (Chabane, 2012; Bouchentouf and Benabdeli, 2021; World Bank, 2024; FAO, 2026). Within this setting, harvested area is informative because it records land that actually reaches harvest and therefore sits closer to realized production than cultivated potential alone. Annual changes in harvested area may reflect planting and abandonment decisions, seasonal risk, input availability and other constraints, although the aggregate model used here cannot disentangle these mechanisms.
Research on Algeria and the Maghreb documents substantial climatic and spatial heterogeneity in cereal performance. Studies of eastern Algeria and the high plateaus relate rainfall and agroclimatic conditions to cereal yields, while national work emphasises production structure, climate variability and uneven output responses to weather conditions (Zargar et al., 2017; Benmehaia et al., 2020; Bouchafaa and Djeddour-Djaballah, 2022; Benmehaia, 2025; Aribi, 2025). This evidence supports a dynamic-system perspective in which harvested area and climate indicators are considered jointly rather than treated as isolated determinants.
To keep the empirical scope aligned with the available data, food security is treated only as policy context. It is not an estimated outcome, and the model contains no direct measure of food availability, access, utilization or experienced food insecurity. The study likewise does not construct a separate vulnerability index: its empirical object is cereal production dynamics. Direct food-security measurement requires dedicated indicators such as the Food Insecurity Experience Scale or other multidimensional measures (Cafiero et al., 2018), which are conceptually distinct from a national cereal-production series.
Using annual data for 1990–2024, the analysis considers the dynamic relationships among cereal production, harvested cereal area, annual precipitation and annual surface-air temperature. Two sample-based precipitation-anomaly indicators enter as deterministic controls rather than as independent climate shocks. The study contributes by placing harvested area at the centre of the production system, strengthening uncertainty assessment through bootstrap impulse-response inference and structural-stability diagnostics, and separating robust descriptive patterns from specification-sensitive results. The resulting framework is a cautious reduced-form assessment of national annual dynamics, not a structural or causal model of agronomic mechanisms.
LITERATURE REVIEW AND THEORETICAL BACKGROUND
Climate effects on cereal systems depend on both exposure and the capacity to adjust. Rainfall deficits reduce soil moisture, heat can shorten crop-development phases and increase evapotranspiration, and excessive rainfall can disrupt field operations. Mediterranean evidence reveals how these effects interact with crop choice, land use and management conditions rather than operating as uniform annual responses (Olesen and Bindi, 2002; Abi Saab et al., 2019; Cammarano et al., 2019). Across the wider MENA and African context, recurrent water scarcity and uneven adaptive capacity reinforce the same interaction (Waha et al., 2017; Ali et al., 2022; Trisos et al., 2022).
Regional evidence is particularly relevant for Algeria. Rainfed cereal zones differ markedly in rainfall and yield outcomes, and drought episodes recur across semi-arid cereal regions (Smadhi et al., 2017; Taibi et al., 2017; Benmehaia et al., 2020). Recent research on wheat production also points to the importance of drought periods and irrigation scheduling (Ouzani et al., 2025). These findings caution against reading a single national climate series as a complete representation of cereal exposure.
Climate measurement is therefore central to the analysis. Annual national precipitation totals cannot represent rainfall timing during sowing, tillering, grain filling or harvest, nor can they capture dry-spell duration or regional contrasts. Site-based and remote-sensing studies illustrate the value of seasonal information and drought indices for cereal analysis (Iglesias and Quiroga, 2007; Bouras et al., 2020; 2021). The Standardized Precipitation Evapotranspiration Index, for example, combines precipitation deficits with temperature-related evaporative demand across multiple time scales (Vicente-Serrano et al., 2010). More broadly, climate-economy research shows that temporal and spatial aggregation can materially alter estimated relationships (Auffhammer et al., 2013; Dell et al., 2014).
Harvested area captures a different margin of the production system. It links land allocation to realised output and may reflect processes that an annual national model cannot observe separately, including abandonment, input constraints and seasonal management. Aggregate cereal production may also be persistent because current outcomes are related to previous harvests, farmer expectations, seed and input availability, and broader system conditions. Evidence that climate trends can affect agricultural productivity over time further supports a dynamic rather than purely contemporaneous framework (Lobell et al., 2011; Ortiz-Bobea et al., 2021).
The limited number of annual observations shapes the econometric design. While VAR models organise multivariate dynamics without requiring a structural causal model (Sims, 1980; Lütkepohl, 2005), asymptotic inference can be imprecise when there are few observations. Bootstrap procedures are therefore useful for impulse-response uncertainty (Kilian, 1998). Structural change also requires explicit attention: Zivot and Andrews (1992) allow an endogenous break in unit-root testing, while unknown-breakpoint parameter-stability procedures build on Andrews (1993) and the p-value approximations of Hansen (1997). These tools are used as robustness checks, not as devices for searching for stronger significance.
The literature therefore leads to a focused empirical question: Within the information contained in national annual data, how much descriptive dynamic information about cereal production is associated with past production, harvested area and coarse climate indicators, and how stable are those patterns to trend treatment, recursive ordering, anomaly controls and structural-change diagnostics? Framing the question this way avoids treating cereal production as a direct measure of food security while preserving the policy relevance of production stability.
Table 1.
Variables and data sources
| Symbol | Variable and definition | Transformation | Unit | Source |
|---|---|---|---|---|
| LPROD | FAOSTAT “Cereals, primary” – Production; annual national cereal production. | Natural logarithm | Metric tonnes | FAOSTAT |
| LHA | FAOSTAT “Cereals, primary” – Area harvested; annual area that reaches harvest. | Natural logarithm | Hectares | FAOSTAT |
| LPREC | CCKP national (ADM0) precipitation indicator (pr); annual accumulated precipitation. | Natural logarithm | Millimetres | World Bank CCKP |
| LTEMP | CCKP national (ADM0) average surface-air temperature indicator (tas). | Natural logarithm; level-form robustness check | Degrees Celsius | World Bank CCKP |
| D1 | Low-precipitation anomaly indicator: 1 if PREC < 67.72 mm; 0 otherwise. | Deterministic binary control | Binary | Authors’ calculation |
| D2 | High-precipitation anomaly indicator: 1 if PREC > 95.83 mm; 0 otherwise. | Deterministic binary control | Binary | Authors’ calculation |
MATERIAL AND METHODS
The analysis uses national annual data for Algeria from 1990 to 2024. Total cereal production is the outcome variable, and harvested cereal area is the principal agronomic variable. Both series come from the FAOSTAT Crops and Livestock Products database, using the item ‘Cereals, primary’ and the elements ‘Production’ and ‘Area harvested’. FAOSTAT provides these as aggregate series; the authors did not construct them by summing individual cereal crops. The cereal aggregate covers crops harvested for dry grain and excludes cereals harvested green for hay, feed, silage or grazing. Area harvested denotes the area actually harvested, while production is reported in metric tonnes (FAO, 2025).
Climate data come from the World Bank Climate Change Knowledge Portal (CCKP) as national (ADM0) annual series. LPREC corresponds to the CCKP precipitation indicator (pr) and is measured as annual accumulated precipitation in millimetres. LTEMP corresponds to average surface-air temperature (tas) and is measured as the annual average in degrees Celsius. No station or subnational observations were aggregated by the authors; the analysis uses the national series supplied by CCKP. The archived research dataset identifies CCKP as the source but does not retain the underlying product/version identifier, so no CRU or ERA5 label is assigned retrospectively (World Bank, 2025).
All four continuous variables enter in natural logarithms. D1 and D2 are sample-based deterministic threshold indicators derived from the same annual precipitation series. Their thresholds equal the sample mean of logged precipitation minus and plus one standard deviation, transformed back to millimetres. D1 identifies 7 years and D2 identifies 6 years. Because both indicators are deterministic functions of precipitation already included in the VAR, they are not treated as statistically independent exogenous climate shocks. Their role is limited to distinguishing unusually low and high annual precipitation conditions; a specification without D1 and D2 is reported as a robustness check.
The empirical framework is a reduced-form VAR in the four logged endogenous variables LPROD, LHA, LPREC and LTEMP (Sims, 1980). The sample contains 35 annual observations and 34 effective observations after the one-lag adjustment. Parsimony is therefore essential. All reported information criteria select VAR(1), leaving seven coefficients per equation in the benchmark system (four lagged endogenous variables, an intercept and the two deterministic anomaly indicators), or 28 coefficients across the system. The number of annual observations limits statistical power and precision, so inference is interpreted cautiously and greater weight is placed on robustness than on isolated significance.
where:Yt – contains LPROD, LHA, LPREC and LTEMP
C – is the intercept vector
p – is the selected lag order
ϕi – contains autoregressive coefficients
Xt – contains D1 and D2
ψ – contains their coefficients
εt – is the innovation vector.
Augmented Dickey-Fuller (ADF) and Phillips-Perron (PP) tests are used first to assess integration properties (Dickey and Fuller, 1979; Phillips and Perron, 1988). LTEMP rejects the unit-root null only under a deterministic-trend specification. The no-trend model is therefore retained as the benchmark descriptive specification, while the trend-augmented VAR serves as the more conservative deterministic specification for inference. A Zivot-Andrews test allowing one endogenous break in intercept and trend provides an additional stationarity check (Zivot and Andrews, 1992). When the Zivot-Andrews result for LHA differs from the conventional tests, a complementary KPSS test is used. Parameter stability in each estimated VAR equation is examined with Quandt-Andrews unknown-breakpoint tests over the 15% trimmed sample, with probabilities based on Hansen’s approximation (Andrews, 1993; Hansen, 1997).
Benchmark estimation, diagnostics and bootstrap impulse responses were conducted in EViews. Because asymptotic confidence intervals can be imprecise with 35 annual observations, IRF uncertainty is evaluated with 95% standard percentile-bootstrap confidence intervals based on 2,000 repetitions (Kilian, 1998). Block-exogeneity tests are read as tests of predictive content in the Granger sense, not as evidence of structural causality (Granger, 1969). FEVD results are reported as descriptive, model-conditional point estimates, with no statistical significance or precision claim attached to the variance shares. The benchmark Cholesky ordering is LPROD, LHA, LPREC, LTEMP. This production-centred recursive ordering is an identification convention rather than a causal hierarchy, because annual aggregation does not imply a unique contemporaneous structural sequence. Sensitivity is therefore assessed under the alternative ordering LPROD, LPREC, LTEMP, LHA.
The climate variables are intentionally limited to national annual aggregates. The archived study dataset contains no seasonal, regional or independent drought-index series that is directly comparable with the national 1990–2024 production and harvested-area series under the same data framework. Reconstructing such measures ex post would require a new climate-data construction, while a regional extension would also require consistent subnational cereal-production and harvested-area series. Inference is therefore restricted to national annual production dynamics. Seasonal timing, regional heterogeneity and drought-index effects are treated as limitations rather than inferred from the annual series, and the graphical analysis is correspondingly limited to national annual time-series plots.
RESULTS
Table 2 summarises the logged series. Production and harvested area vary substantially more than temperature, while precipitation shows moderate dispersion. The Jarque-Bera statistics in the table describe the unconditional distributions of the series and are distinct from the multivariate residual-normality test reported after VAR estimation.
Table 2.
Descriptive statistics
| Statistic | LPROD | LHA | LPREC | LTEMP |
|---|---|---|---|---|
| Mean | 14.9322 | 14.7335 | 4.3888 | 3.1617 |
| Median | 15.0761 | 14.8036 | 4.4343 | 3.1633 |
| Maximum | 15.6182 | 15.1140 | 4.6774 | 3.1855 |
| Minimum | 13.6762 | 13.8720 | 4.0486 | 3.1280 |
| Std. Dev. | 0.5174 | 0.3185 | 0.1793 | 0.0125 |
| Skewness | –1.0809 | –1.2807 | –0.4489 | –0.8860 |
| Kurtosis | 3.2517 | 4.0177 | 1.9246 | 4.1667 |
| Jarque-Bera | 6.9089 | 11.0788 | 2.8618 | 6.5651 |
| Probability (Jarque-Bera) | 0.0316 | 0.0039 | 0.2390 | 0.0375 |
| Observations | 35 | 35 | 35 | 35 |
Figure 1 highlights pronounced annual fluctuations in production and harvested area, a more irregular precipitation path, and a comparatively smooth upward movement in temperature. The temperature profile is the reason trend sensitivity is examined explicitly in the subsequent analysis.
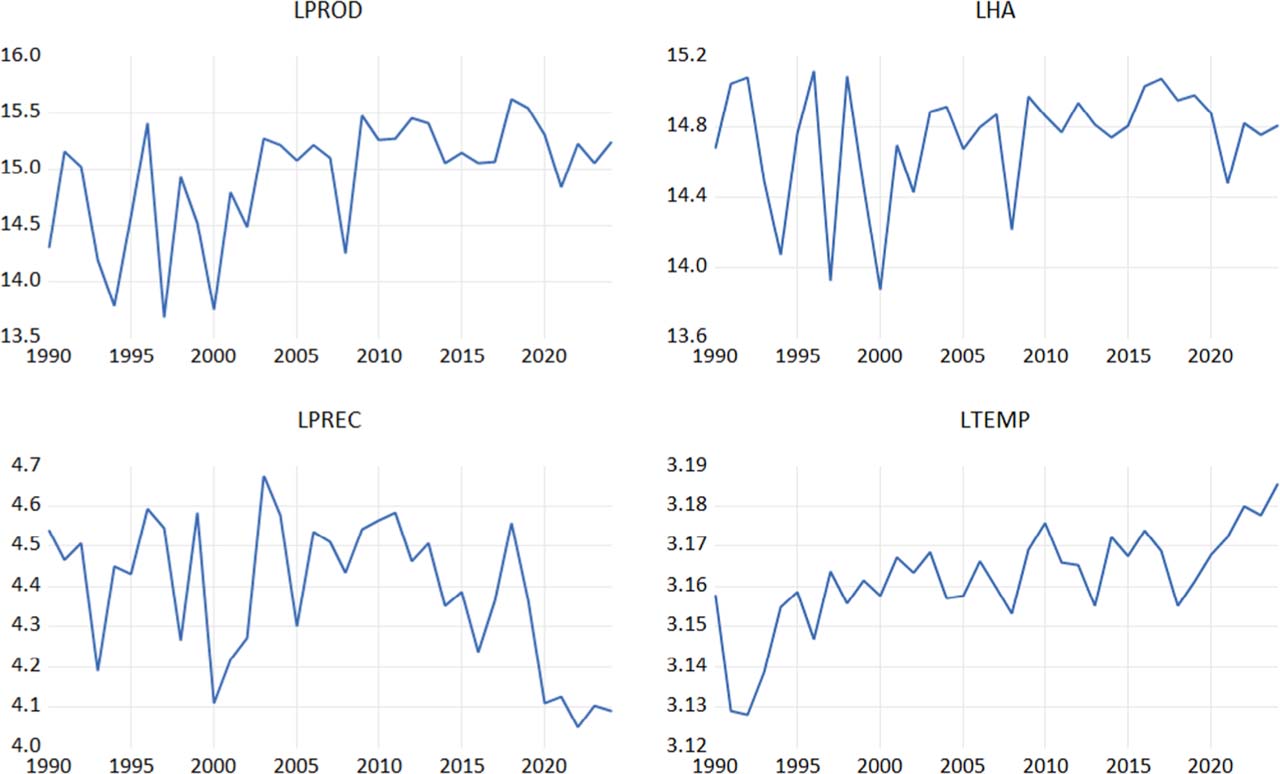
Fig. 1.
Time-series plots of the log-transformed variables, 1990–2024
Source: own elaboration based on FAOSTAT and World Bank Climate Change Knowledge Portal data.
The conventional tests support level stationarity for LPROD, LHA and LPREC. However, LTEMP requires greater care: both ADF and PP reject the unit-root null only under the trend specification. Because the deterministic specification can affect inference, the trend-augmented VAR is not treated as a peripheral robustness exercise. It provides the more conservative deterministic specification against which the benchmark predictive result is judged.
Table 3.
Unit-root and stationarity tests
| Panel A. Conventional ADF and PP unit-root tests | |||||||
| Variable | ADF: C | ADF: C+T | ADF: none | PP: C | PP: C+T | PP: none | Decision |
| LPROD | –4.4949*** | –5.7846*** | 0.1515 | –4.6596*** | –5.7846*** | 0.5140 | I(0) |
| LHA | –5.7619*** | –3.9701** | 0.4212 | –5.9625*** | –6.3377*** | 0.0718 | I(0) |
| LPREC | –3.3528** | –3.8020** | –0.6048 | –3.2801** | –3.7718** | –1.4537 | I(0) |
| LTEMP | –2.1619 | –4.1701** | 0.4554 | –1.9491 | –4.2693*** | 1.4484 | Stationary under trend specification |
| Panel B. Zivot-Andrews unit-root test with one endogenous structural break | |||||||
| Variable | ZA statistic | Selected lag | Break year | 5% critical value | Decision | ||
| LPROD | –7.1064 | 0 | 2002 | –5.0733 | Reject unit root | ||
| LHA | –4.6927 | 3 | 2016 | –5.0733 | Do not reject | ||
| LPREC | –5.6676 | 0 | 2002 | –5.0733 | Reject unit root | ||
| LTEMP | –5.8781 | 0 | 1996 | –5.0733 | Reject unit root | ||
[i] Panel A: C = constant; C+T = constant and deterministic trend. The null hypothesis is a unit root. LTEMP rejects the unit-root null only when the trend is included.
Allowing one endogenous break strengthens the stationarity evidence for LPROD, LPREC and LTEMP, whereas the Zivot-Andrews test does not reject the unit-root null for LHA. The complementary KPSS statistic for LHA remains below the 5% critical value under both the constant specification (0.3712 versus 0.463) and the constant-and-trend specification (0.0996 versus 0.146). Taken together, these results support a parsimonious levels VAR, while the mixed evidence for LHA is retained as a qualification.
Every reported information criterion selects one lag. With annual data and 35 observations, VAR(1) is therefore preferred; longer lag structures would materially reduce the remaining degrees of freedom without support from the selection criteria.
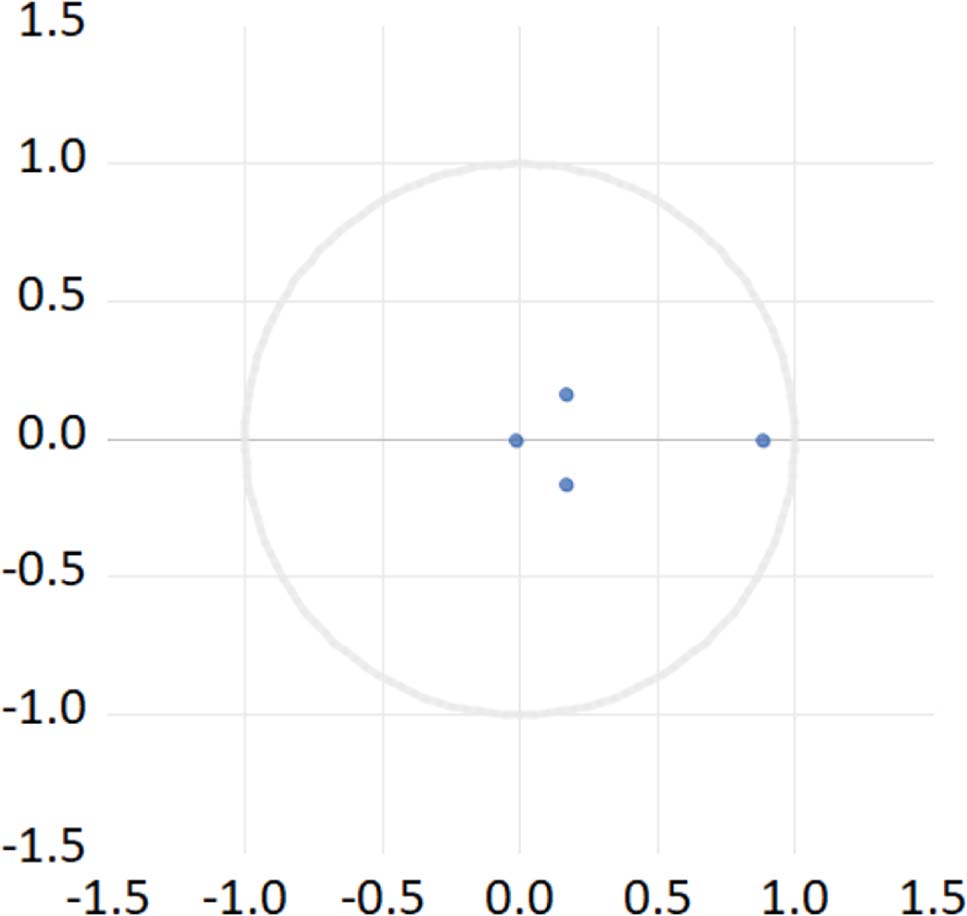
Fig. 2.
VAR Stability Diagnostic Based on Inverse AR Roots
Source: own elaboration based on EViews stability diagnostics.
Table 4.
VAR lag order selection
| Lag | LogL | LR | FPE | AIC | SC | HQ |
|---|---|---|---|---|---|---|
| 0 | 142.6939 | NA | 3.34e-09 | –8.168369 | –7.618718 | –7.986175 |
| 1 | 173.4450 | 48.04858* | 1.36e-09* | –9.090312* | –7.807793* | –8.665193* |
| 2 | 181.3963 | 10.43609 | 2.46e-09 | –8.587268 | –6.571881 | –7.919225 |
| 3 | 196.3854 | 15.92591 | 3.21e-09 | –8.524087 | –5.775832 | –7.613118 |
All inverse autoregressive roots lie inside the unit circle, satisfying the dynamic stability condition for the estimated reduced-form VAR. This root-stability result does not, however, rule out changes in parameters over time, which are examined separately with unknown-breakpoint tests.
Parameter stability is not rejected at 5% for the production, precipitation or temperature equations. The harvested-area equation differs: stability is rejected (p = 0.0192), with the maximum statistic in 1997. The evidence is therefore equation-specific and does not support imposing a single common break on the four-variable system. It does, however, require caution when interpreting harvested-area dynamics as stable over the full sample. The 2016 Zivot-Andrews date and the 1997 Quandt-Andrews candidate are not contradictory, because the former concerns unit-root behaviour with an endogenous break whereas the latter tests VAR-parameter stability.
Table 5.
Quandt-Andrews unknown-breakpoint tests for VAR parameter stability
| VAR equation | Maximum LR F | Candidate year | p-value | Decision at 5% |
|---|---|---|---|---|
| LPROD | 2.4787 | 2001 | 0.3049 | Do not reject stability |
| LHA | 4.1509 | 1997 | 0.0192 | Reject stability |
| LPREC | 2.1000 | 2003 | 0.4865 | Do not reject stability |
| LTEMP | 3.1885 | 1997 | 0.1052 | Do not reject stability |
Table 6.
VAR residual diagnostic tests
| Diagnostic | Statistic | df | p-value | Additional statistic | Additional p | Decision |
|---|---|---|---|---|---|---|
| LM, lag 1 | LRE = 7.6842 | 16 | 0.9577 | Rao F = 0.4564 | 0.9584 | No serial correlation |
| LM, lag 2 | LRE = 16.8861 | 16 | 0.3930 | Rao F = 1.0745 | 0.3978 | No serial correlation |
| LM, lags 1–2 | LRE = 32.4358 | 32 | 0.4453 | Rao F = 1.0147 | 0.4686 | No serial correlation |
| Joint skewness | – | 4 | 0.3859 | – | – | Normality not rejected |
| Joint kurtosis | – | 4 | 0.9030 | – | – | Normality not rejected |
| Joint Jarque-Bera | JB = 5.1957 | 8 | 0.7365 | – | – | Normality not rejected |
| White heteroskedasticity | – | 100 | 0.1359 | – | – | Homoskedasticity not rejected |
Table 7.
VAR Granger causality/block-exogeneity Wald tests for LPROD
| Excluded variable | df | Chi-square | p-value |
|---|---|---|---|
| LHA | 1 | 1.3587 | 0.2438 |
| LPREC | 1 | 0.1166 | 0.7327 |
| LTEMP | 1 | 2.9804 | 0.0843 |
| All three | 3 | 8.6413 | 0.0345 |
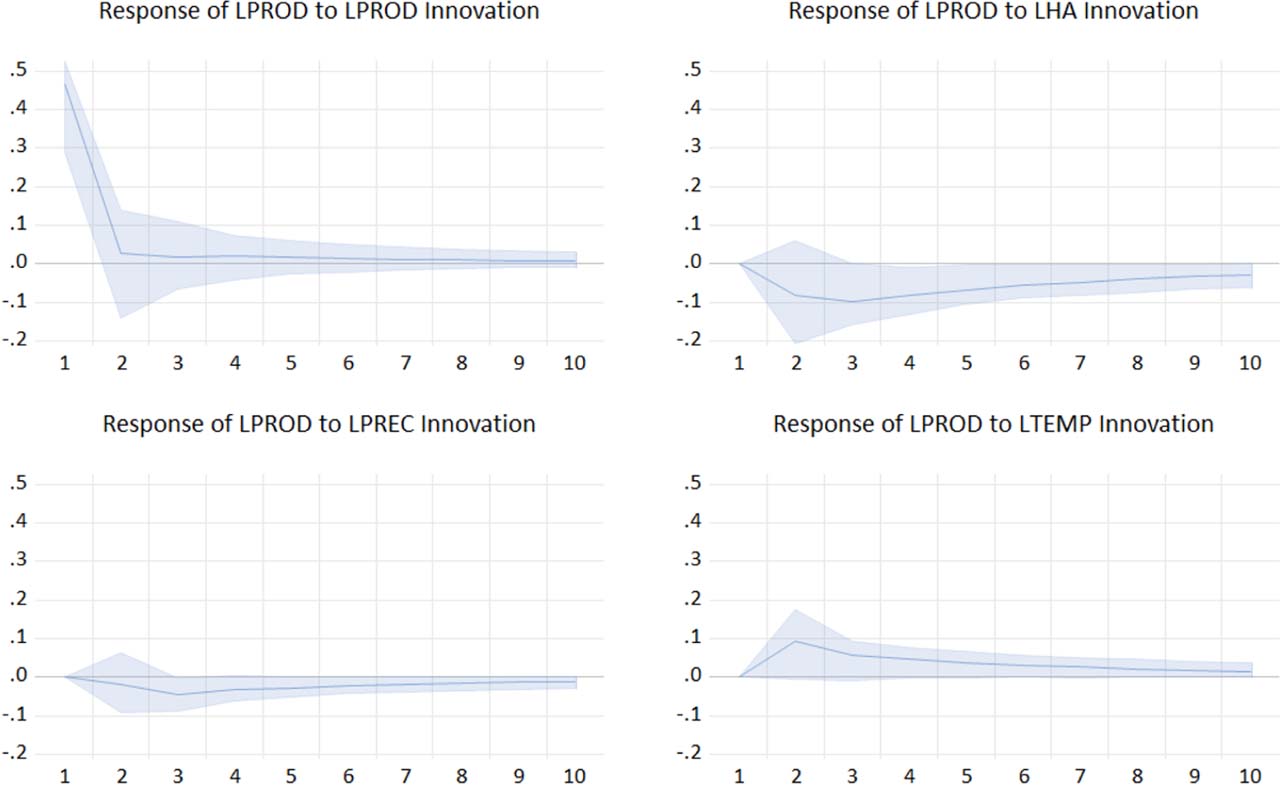
Fig. 3.
Bootstrap Impulse Response Functions of LPROD
Note: Shaded bands are 95% standard percentile-bootstrap confidence intervals based on 2,000 EViews repetitions. Benchmark Cholesky ordering: LPROD, LHA, LPREC, LTEMP.
The residual diagnostics do not reveal serious serial-correlation, multivariate-normality or heteroskedasticity problems at conventional levels. They support the internal adequacy of the reduced-form specification, although they do not eliminate the inference constraints associated with 35 annual observations.
In the benchmark VAR, none of the three variables individually predicts LPROD at the 5% level, while LTEMP is marginal at 10% (p = 0.0843). The three-variable block is jointly significant at 5% (p = 0.0345), but that result is not robust to a deterministic trend: the joint p-value rises to 0.6883, with individual p-values of 0.9278 for LHA, 0.2841 for LPREC and 0.5202 for LTEMP. The benchmark joint result is therefore treated as specification-sensitive, and the paper’s inferential conclusions do not depend on its nominal 5% significance.
The bootstrap bands materially narrow the interpretation of the impulse responses. LPROD responds strongly to its own innovation at first, but the response decays quickly. The period-2 response to an LTEMP innovation is about 0.095, yet the displayed 95% bootstrap confidence interval extends approximately from 0.00 to 0.18, with the lower bound effectively at zero. Consequently, the early positive response is not treated as statistically secure. Responses to LPREC remain close to zero, while the LHA response is negative over several horizons under the benchmark recursive ordering, although this remains a model-conditional dynamic association rather than a causal effect.
At horizon 10, LPROD’s own innovations explain 78.47% of forecast-error variance. Among the included non-own innovations, LHA has the largest point estimate (12.85%), followed by LTEMP (6.71%) and LPREC (1.97%). These shares are not causal contributions. Changing the recursive ordering alters the external shares, but the broad pattern remains: own-production innovations dominate, and the LHA point estimate exceeds the other included non-own shares.
Table 8.
Variance decomposition of total cereal production (LPROD)
| Period | S.E. | LPROD (%) | LHA (%) | LPREC (%) | LTEMP (%) |
|---|---|---|---|---|---|
| 1 | 0.4647 | 100.00 | 0.00 | 0.00 | 0.00 |
| 2 | 0.4827 | 93.07 | 2.92 | 0.12 | 3.87 |
| 4 | 0.5078 | 84.35 | 8.80 | 1.29 | 5.55 |
| 6 | 0.5194 | 80.82 | 11.22 | 1.69 | 6.24 |
| 8 | 0.5249 | 79.22 | 12.32 | 1.88 | 6.56 |
| 10 | 0.5276 | 78.47 | 12.85 | 1.97 | 6.71 |
[i] Values are descriptive point estimates of LPROD forecast-error variance shares under the benchmark Cholesky ordering. They are conditional on the model, horizon and identification scheme; uncertainty intervals are not reported, so no inferential significance is attached to differences among the shares.
Table 9.
Summary of robustness checks
| Robustness check | Benchmark | Robustness result | Interpretation |
|---|---|---|---|
| Trend-augmented VAR | Joint Granger p = 0.0345 | With trend: joint p = 0.6883; LHA = 0.9278, LPREC = 0.2841, LTEMP = 0.5202 | Benchmark joint predictive result is trend-sensitive |
| Alternative Cholesky ordering | H10 FEVD: 78.47, 12.85, 1.97, 6.71% | Alternative: LPROD 78.47%, LHA 14.48%, LPREC 0.17%, LTEMP 6.87% | Shares depend on recursive identification; none is interpreted causally |
| Temperature in levels | Joint p with LTEMP = 0.0345 | With TEMP: joint p = 0.0341; LHA = 0.2424, LPREC = 0.7365, TEMP = 0.0832 | Log transformation does not drive the benchmark result; trend sensitivity remains stronger |
| Quandt-Andrews tests | Benchmark assumes parameter stability | Stability rejected only for LHA (p = 0.0192); not rejected for LPROD, LPREC or LTEMP | Instability is equation-specific; no common break is imposed |
| Bootstrap IRFs | Conventional asymptotics are weak in N = 35 | 2,000-repetition 95% percentile-bootstrap bands; LTEMP horizon-2 lower bound effectively zero | Climate IRF claims are weakened by bootstrap uncertainty |
| Without D1 and D2 | Joint p = 0.0345; H10 LPREC FEVD = 1.97% | Joint p ≈ 0.0506; LTEMP p ≈ 0.0357; H10 FEVD: LPROD 75.14%, LHA 10.06%, LPREC 7.40%, LTEMP 7.41% | D1/D2 absorb part of LPREC information; precipitation results are specification-sensitive |
Taken together, the robustness checks do not support a single strong causal narrative. The main predictive result disappears when a deterministic trend is added, the precipitation results change materially when the anomaly controls are removed, and the harvested-area equation shows evidence of a discrete parameter change. These are treated as substantive qualifications to the reported patterns rather than as secondary caveats.
DISCUSSION
The most stable dynamic pattern is the dominance of production’s own innovations in the FEVD together with the rapid decay of the own-production impulse response. Within the annual national information set, production history therefore contains substantial information about near-term production uncertainty. That persistence may be consistent with accumulated agronomic and institutional conditions, although the VAR does not identify the underlying mechanism.
Harvested area remains relevant, but the evidence places clear limits on its interpretation. At horizon 10, it has the largest non-own FEVD point estimate under both reported recursive orderings. Because FEVD uncertainty intervals are not reported, the ranking is descriptive and does not establish that the non-own shares differ statistically. The benchmark block-exogeneity test also finds no significant individual predictive content for LHA, and the LHA equation displays parameter instability around 1997. Harvested area is therefore best read as a recurring model-conditional association rather than as a cause of production changes. This restrained interpretation is consistent with Algerian and regional studies that identify land-use and agroclimatic heterogeneity as important components of cereal performance (Zargar et al., 2017; Benmehaia et al., 2020; Bouchafaa and Djeddour-Djaballah, 2022).
The climate results require even greater restraint, however. Annual national precipitation has a small FEVD share under the benchmark specification, but that does not imply that rainfall is agronomically unimportant. Seasonal timing, dry-spell duration and regional differences are central to cereal water stress and cannot be recovered from an annual national total (Iglesias and Quiroga, 2007; Taibi et al., 2017; Bouras et al., 2020; 2021). When D1 and D2 are removed, the horizon-10 LPREC share rises from 1.97% to 7.40%, showing that the reduced-form decomposition depends materially on how annual precipitation conditions are represented. The same specification changes the individual LTEMP block result (p ≈ 0.0357), further confirming that climate-related predictive evidence is specification-sensitive. The climate measurement issue is thus part of the empirical interpretation, not merely a generic limitation.
Trend treatment produces an equally important sensitivity. The joint block-exogeneity p-value moves from 0.0345 in the benchmark specification to 0.6883 when a deterministic trend is included. Because LTEMP is stationary in the conventional tests only under the trend specification, the trend-augmented VAR is treated as the more conservative deterministic specification for inference. The paper therefore does not rely on the benchmark joint significance or claim robust joint predictive content for harvested area, precipitation and temperature across deterministic specifications.
The structural-break diagnostics add a separate qualification. Root stability is satisfactory, but the Quandt-Andrews test rejects parameter stability for the LHA equation and not for the production, precipitation or temperature equations. With only 35 annual observations, a heavily parameterised regime-specific VAR would consume substantial degrees of freedom and is not supported by evidence of a common system break. Reporting the equation-specific instability and limiting the interpretation is therefore preferable to imposing an unsupported common break.
Food security remains relevant only as policy context. Cereal output affects domestic supply conditions, but the study does not estimate food access, utilisation or household food insecurity, so the VAR results should not be translated into direct food-security effects. This separation is consistent with dedicated measures of food insecurity such as FIES (Cafiero et al., 2018). The corresponding agricultural-policy interpretation is modest: the results justify attention to harvested-area continuity, better seasonal and regional climate information, and drought-risk monitoring, but they do not establish the effectiveness of any specific land, input, irrigation or water-use policy.
The limitations are explicit. 35 annual observations restrict power; the recursive identification is not structural; FEVD uncertainty intervals are not reported and the variance shares remain descriptive point estimates; climate variables are national annual aggregates; the archived data do not permit a like-for-like seasonal or regional reconstruction; D1 and D2 are deterministic functions of precipitation; and parameter stability is not uniform across equations. Future research can address these constraints with regional cereal panels, seasonal climate indicators or formal drought indices, direct policy variables, separate food-security measures and larger samples where available.
CONCLUSIONS
This study analyses Algeria’s cereal production dynamics with a four-variable VAR using annual data for 1990–2024 and a deliberately cautious interpretation. Food security and vulnerability are not treated as directly estimated outcomes. The focus is instead on the dynamic information contained in past cereal production, harvested area, annual precipitation and temperature.
The results support three main conclusions. First, production’s own innovations dominate the forecast-error variance decomposition. Second, harvested area has the largest non-own FEVD point estimate at horizon 10, but that ranking is conditional on the model and recursive identification, FEVD uncertainty intervals are not reported, and the harvested-area equation shows parameter instability; the result is therefore descriptive rather than causal or statistically separable. Third, the benchmark joint Granger result is also not robust to a deterministic trend, while precipitation results depend on whether the precipitation-anomaly indicators are included. Because the trend-augmented VAR provides the more conservative deterministic specification for inference, no inferential conclusion rests on the benchmark joint significance. These sensitivities preclude a strong structural interpretation.
The policy implications should be read as inference rather than experimentally confirmed effects. The evidence draws attention to the conditions under which cereal land reaches harvest and to the need for climate monitoring that moves beyond annual national averages where consistent data permit. It does not confirm that particular land-management, input-delivery, irrigation or water-efficiency interventions will raise production. Evaluating such effects requires more detailed regional and seasonal data, formal drought measures, direct policy variables and independent food-security indicators.