
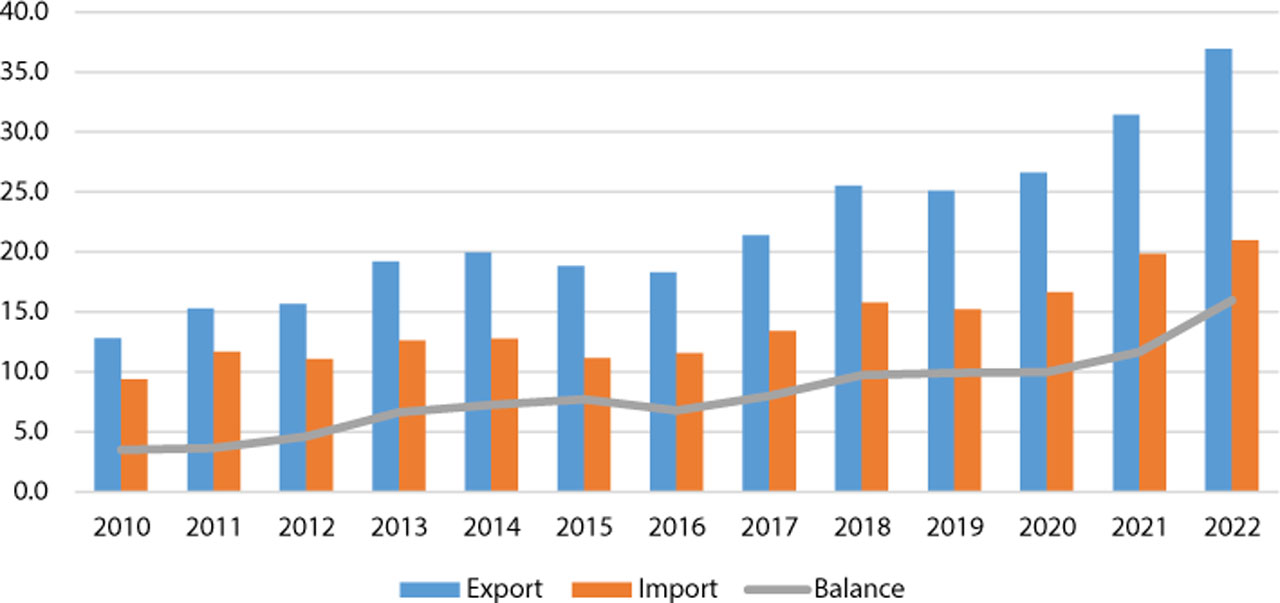
Fig. 1.
Value of exports, imports, and trade balance of Polish agri-food products to and from the SEM in 2010–2022 (USD billion)
Source: own study based on UNCTAD, https://unctadstat.unctad.org/datacentre (accessed on 14 June 2025).
Table 1.
Value of Polish agri-food exports and imports to and from the SEM in 2010, 2016, and 2022 (USD million)
| CN | Product | Export | Import | ||||
|---|---|---|---|---|---|---|---|
| 2010 | 2016 | 2022 | 2010 | 2016 | 2022 | ||
| 1 | Live animals | 220 | 100 | 106 | 275 | 599 | 925 |
| 2 | Meat and meat preparations | 1 933 | 3 121 | 6 164 | 1 283 | 1403 | 1 950 |
| 3 | Fish, crustaceans, molluscs and preparations thereof | 769 | 1 197 | 1 986 | 243 | 427 | 558 |
| 4 | Dairy products and birds’ eggs | 1 380 | 1 400 | 3 225 | 557 | 923 | 1 679 |
| 5 | Crude animal materials, n.e.s. | 133 | 183 | 351 | 142 | 123 | 215 |
| 7 | Vegetables | 582 | 633 | 1 060 | 508 | 547 | 1 002 |
| 8 | Fruits and nuts (excluding oil nuts), fresh or dried | 113 | 252 | 480 | 637 | 688 | 1 156 |
| 9 | Coffee, tea, cocoa, spices, and manufactures thereof | 341 | 625 | 773 | 348 | 439 | 933 |
| 10 | Cereals and cereal preparations | 356 | 549 | 2 318 | 324 | 293 | 544 |
| 12 | Oil seeds and oleaginous fruits | 171 | 126 | 476 | 87 | 217 | 338 |
| 13 | Crude rubber (including synthetic and reclaimed) | 152 | 158 | 274 | 408 | 413 | 748 |
| 14 | Crude vegetable materials, n.e.s. | 227 | 171 | 316 | 242 | 190 | 292 |
| 15 | Animal and vegetable oils, fats and waxes | 276 | 483 | 1 173 | 475 | 682 | 1 589 |
| 16 | Preparations of meat, fish, crustaceans, mollusks | 612 | 972 | 1 554 | 167 | 191 | 352 |
| 17 | Sugar, sugar preparations and honey | 322 | 445 | 715 | 329 | 316 | 528 |
| 18 | Cocoa and cocoa preparations | 467 | 970 | 1 645 | 617 | 938 | 1 426 |
| 19 | Preparations of cereals, flour, starch, or milk | 683 | 1 294 | 2 433 | 459 | 573 | 1 110 |
| 20 | Preparations of vegetables, fruit, nuts | 1 066 | 1 392 | 2 271 | 388 | 448 | 992 |
| 21 | Miscellaneous edible products and preparations | 931 | 1 289 | 2 774 | 741 | 835 | 1 737 |
| 22 | Beverages | 335 | 511 | 908 | 377 | 428 | 990 |
| 23 | Feedstuff for animals (excluding unmilled cereals) | 396 | 610 | 2 310 | 507 | 501 | 1 507 |
| 24 | Tobacco and tobacco manufactures | 1 359 | 1 824 | 3 616 | 240 | 367 | 389 |
| Total | 12 824 | 18 305 | 36 926 | 9 354 | 11 539 | 20 961 | |
[ii] Source: own study based on UNCTAD, https://unctadstat.unctad.org/datacentre (accessed on 14 June 2024).
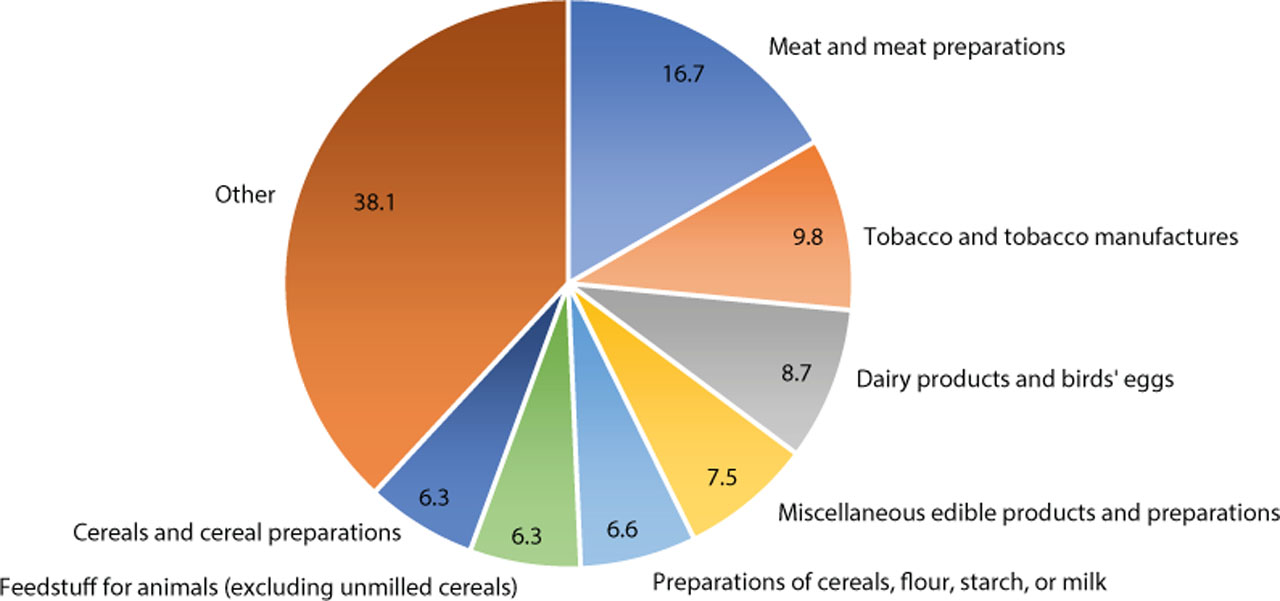
Fig. 2.
Structure of agri-food exports from Poland to the SEM in 2022 (%)
Source: own study based on UNCTAD, https://unctadstat.unctad.org/datacentre (accessed on 14 June 2025).
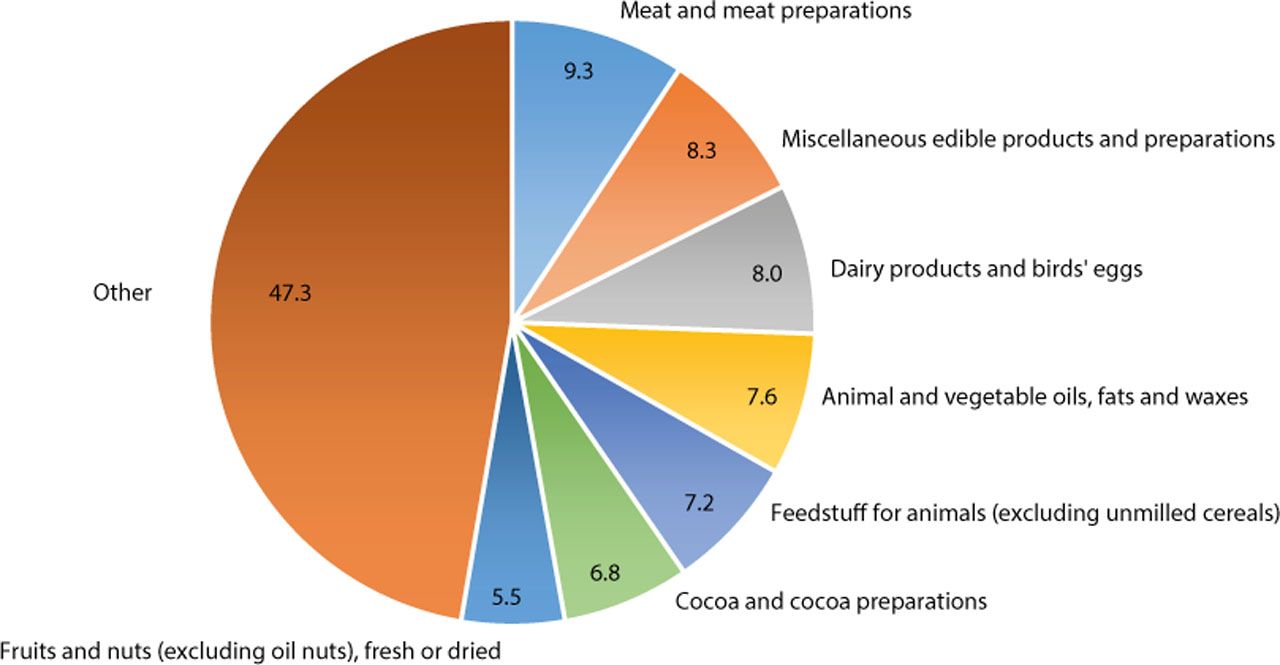
Fig. 3.
Structure of agri-food imports to Poland from the SEM in 2022 (%)
Source: own study based on UNCTAD, https://unctadstat.unctad.org/datacentre (accessed on 14 June 2025).
Table 2.
Value of the export specialization index (SI) and export-to-import coverage ratio (CR) and relative comparative advantage index for exports (XRCA) in Poland’s agri-food trade with the SEM in 2010, 2016, and 2022
| CN | SI | CR (%) | XRCA | ||||||
|---|---|---|---|---|---|---|---|---|---|
| 2010 | 2016 | 2022 | 2010 | 2016 | 2022 | 2010 | 2016 | 2022 | |
| 1 | 0.60 | 0.20 | 0.15 | 80.0 | 16.6 | 11.4 | 0.59 | 0.20 | 0.14 |
| 2 | 1.43 | 1.77 | 1.84 | 150.7 | 222.4 | 316.0 | 1.50 | 1.93 | 2.01 |
| 3 | 1.37 | 1.25 | 1.16 | 316.1 | 280.6 | 355.7 | 1.39 | 1.27 | 1.17 |
| 4 | 0.97 | 0.78 | 0.77 | 247.7 | 151.7 | 192.1 | 0.97 | 0.76 | 0.75 |
| 5 | 1.77 | 1.74 | 1.47 | 93.4 | 148.1 | 163.4 | 1.77 | 1.75 | 1.48 |
| 7 | 0.78 | 0.61 | 0.58 | 114.7 | 115.6 | 105.7 | 0.77 | 0.60 | 0.57 |
| 8 | 0.16 | 0.23 | 0.25 | 17.7 | 36.6 | 41.5 | 0.15 | 0.22 | 0.24 |
| 9 | 1.25 | 1.30 | 0.83 | 97.8 | 142.6 | 82.8 | 1.26 | 1.32 | 0.83 |
| 10 | 0.64 | 0.74 | 1.30 | 109.8 | 187.5 | 426.2 | 0.63 | 0.74 | 1.32 |
| 12 | 0.75 | 0.39 | 0.64 | 197.5 | 58.3 | 140.7 | 0.74 | 0.38 | 0.63 |
| 13 | 0.27 | 0.19 | 0.18 | 37.2 | 38.3 | 36.7 | 0.26 | 0.19 | 0.18 |
| 14 | 1.24 | 1.03 | 0.84 | 93.7 | 89.9 | 108.1 | 1.24 | 1.03 | 0.84 |
| 15 | 0.48 | 0.53 | 0.46 | 58.2 | 70.9 | 73.8 | 0.46 | 0.52 | 0.44 |
| 16 | 1.51 | 1.59 | 1.43 | 366.1 | 507.8 | 441.6 | 1.54 | 1.62 | 1.45 |
| 17 | 0.98 | 1.01 | 0.82 | 97.8 | 140.7 | 135.3 | 0.98 | 1.01 | 0.82 |
| 18 | 0.91 | 1.14 | 1.16 | 75.7 | 103.4 | 115.4 | 0.91 | 1.15 | 1.17 |
| 19 | 1.14 | 1.39 | 1.26 | 148.8 | 225.7 | 219.2 | 1.15 | 1.42 | 1.27 |
| 20 | 1.56 | 1.38 | 1.19 | 274.6 | 310.6 | 228.9 | 1.61 | 1.41 | 1.20 |
| 21 | 1.38 | 1.25 | 1.12 | 125.6 | 154.5 | 159.7 | 1.41 | 1.27 | 1.13 |
| 22 | 0.39 | 0.42 | 0.38 | 88.9 | 119.5 | 91.7 | 0.37 | 0.40 | 0.37 |
| 23 | 0.67 | 0.68 | 1.11 | 78.0 | 121.8 | 153.3 | 0.66 | 0.67 | 1.12 |
| 24 | 2.58 | 2.91 | 3.73 | 565.6 | 497.8 | 929.2 | 2.77 | 3.13 | 4.02 |
[i] Source: own study based on UNCTAD, https://unctadstat.unctad.org/datacentre (accessed on 14 June 2025).
Table 3.
Relative comparative advantage index for imports (MRCA), and relative Trade Advantage (RTA) index value and summary assessment and Value of the Grubel–Lloyd intra-industry trade (IIT) index in Poland’s trade in agri-food products in the SEM in 2010, 2016, and 2022
| CN | MRCA | RTA | Summary assessment | IIT (%) | ||||||||
|---|---|---|---|---|---|---|---|---|---|---|---|---|
| 2010 | 2016 | 2022 | 2010 | 2016 | 2022 | 2010 | 2016 | 2022 | 2010 | 2016 | 2022 | |
| 1 | 1.06 | 2.06 | 2.21 | −0.48 | −1.86 | −2.07 | − | − | − | 88.9 | 28.5 | 20.5 |
| 2 | 1.37 | 1.33 | 1.05 | 0.14 | 0.60 | 0.95 | + | + | + | 79.8 | 62.0 | 48.1 |
| 3 | 0.64 | 0.81 | 0.63 | 0.75 | 0.47 | 0.55 | + | + | + | 48.1 | 52.6 | 43.9 |
| 4 | 0.49 | 0.77 | 0.67 | 0.48 | −0.01 | 0.08 | +/− | +/− | +/− | 57.5 | 79.5 | 68.5 |
| 5 | 2.50 | 1.73 | 1.57 | −0.73 | 0.02 | −0.09 | − | + | − | 96.6 | 80.6 | 75.9 |
| 7 | 0.92 | 0.83 | 0.97 | −0.15 | −0.23 | −0.40 | +/− | +/− | +/− | 93.2 | 92.8 | 97.2 |
| 8 | 1.34 | 1.06 | 1.12 | −1.19 | −0.84 | −0.87 | − | − | − | 30.1 | 53.6 | 58.7 |
| 9 | 1.88 | 1.53 | 1.77 | −0.63 | −0.21 | −0.94 | − | − | − | 98.9 | 82.4 | 90.6 |
| 10 | 0.73 | 0.55 | 0.47 | −0.10 | 0.18 | 0.85 | +/− | +/− | + | 95.3 | 69.6 | 38.0 |
| 12 | 0.52 | 0.92 | 0.74 | 0.23 | −0.53 | −0.11 | +/− | +/− | +/− | 67.2 | 73.7 | 83.1 |
| 13 | 1.09 | 0.94 | 1.04 | −0.84 | −0.75 | −0.86 | − | +/− | − | 54.2 | 55.4 | 53.7 |
| 14 | 1.69 | 1.57 | 1.30 | −0.45 | −0.54 | −0.46 | − | − | − | 96.8 | 94.7 | 96.1 |
| 15 | 1.10 | 1.20 | 1.07 | −0.64 | −0.68 | −0.63 | − | − | − | 73.6 | 82.9 | 84.9 |
| 16 | 0.58 | 0.53 | 0.59 | 0.95 | 1.10 | 0.86 | + | + | + | 42.9 | 32.9 | 36.9 |
| 17 | 1.28 | 1.04 | 1.01 | −0.30 | −0.03 | −0.19 | − | − | − | 98.9 | 83.1 | 85.0 |
| 18 | 1.76 | 1.80 | 1.82 | −0.85 | −0.66 | −0.65 | − | − | − | 86.2 | 98.3 | 92.9 |
| 19 | 0.99 | 0.91 | 0.96 | 0.15 | 0.51 | 0.31 | + | + | + | 80.4 | 61.4 | 62.7 |
| 20 | 0.77 | 0.70 | 0.93 | 0.83 | 0.71 | 0.27 | + | + | + | 53.4 | 48.7 | 60.8 |
| 21 | 1.42 | 1.28 | 1.28 | −0.01 | −0.02 | −0.15 | − | − | − | 88.6 | 78.6 | 77.0 |
| 22 | 0.56 | 0.52 | 0.71 | −0.19 | −0.12 | –0.34 | +/− | +/− | +/− | 94.1 | 91.1 | 95.7 |
| 23 | 1.25 | 0.93 | 1.35 | −0.59 | −0.26 | −0.23 | − | +/− | − | 87.7 | 90.2 | 79.0 |
| 24 | 0.60 | 0.84 | 0.64 | 2.17 | 2.29 | 3.38 | + | + | + | 30.1 | 33.5 | 19.4 |
[i] Source: own study based on UNCTAD, https://unctadstat.unctad.org/datacentre (accessed on 14 June 2025).