
INTRODUCTION
Poland plays a key role in the export of goods to the Single European Market. This is particularly evident in the agri-food sector, where Poland is among the top 5 largest exporters of agri-food products in the entire EU. Polish food exports have increased almost 10-fold over the last 25 years, and almost 3-fold in the years under review; this is one of the largest growth rates among all EU countries. Importantly, if Poland maintains this pace of change, in a few years’ time it will become one of the top 3 largest exporters of agri-food products in the EU, trailing only the Netherlands and Germany. Together with these countries, Poland will set the direction and prospects for the development of the entire EU in agri-food trade. Therefore, it is crucial to fill the research gap in this area, and may translate into engaging a wider audience from EU countries and globally.
The concept of competitiveness has been intertwined with various areas of human activity for many years. Within the discipline of economics, it denotes the presence of competition in a market. Over time, the evolution of economic thought has led to a shift in how this concept is perceived and defined. Initially, classical economic theory focused on the free market, leading to the conceptualization of competition as a spontaneous regulatory force within the market. Subsequently, in the face of competitive pressures, producers sought to curtail production costs. Moreover, it was hypothesized that competition results in price regulation, thereby leading to economic equilibrium. Throughout the course of extensive discourse on economic matters, the notion of competitiveness has been subject to numerous alterations. Nowadays, economists have come to acknowledge the pivotal role that competition plays in regulating and stimulating economic growth, as well as its influence on resource allocation. This phenomenon is attributed to the dynamic interplay of economic entities in a competitive environment (Łukiewska, 2019).
The genesis of research on international competitiveness can be traced back to the 1970s. The investigation into this concept was prompted by the development of integration and globalization processes in the global economy. Economists have provided numerous definitions of competitiveness, which is related to the lack of uniformity in the meaning of this concept and the lack of a single universal understanding of it (Oziewicz and Michałowski, 2013). Nevertheless, a review of economists’ definitions of competitiveness reveals several common features. First, when analysing competitiveness, it is imperative to consider specific objects, such as goods, industries, or sectors, and entities, including companies or geographical areas. A minimum of two distinct objects should be selected for comparison. Furthermore, it is essential to delineate the dimensions of competitiveness that will serve as the basis for assessing an entity’s capacity to thrive within the market. These include price, quality, and technological competitiveness. Another key step is to consider the static aspect, which evaluates competitiveness at a given moment (current competitiveness), and the dynamic aspect, which includes a set of factors that facilitate future enhancements (Olczyk, 2008; Wosiek, 2016).
Competitiveness means the capacity to engage in competition, that is, to undertake actions to achieve objectives aligned with or related to those of other economic entities operating within the same environment and at the same time. Therefore, competitiveness can be viewed as a state of ongoing competition (Pawlak and Poczta, 2008) summarized as the ability of an individual product, company, industry, geographical area, or country to maintain its market position (Jeliński, 2017). It also denotes the capacity of an economy to derive maximum benefits from its participation in the international division of labour, which is associated with establishing a competitive position internationally (Bossak, 1984). Furthermore, it provides a fundamental comparative metric of performance and results achieved in various sectors of the economy, helping to diagnose and understand the reasons for discrepancies in the actual outcomes (Bossak and Bieńkowski, 2004). In macroeconomic theory, the concept of international competitiveness emerges, thereby shifting the analysis to the supranational level in order to examine and benchmark the competitiveness of individual countries (Wosiek, 2016). International competitiveness means the capacity to achieve sustained and effective growth, thus generating augmented wealth for a nation in relation to its competitors within the global context (Mróz, 2016).
This research project enabled a long-term assessment of Poland’s comparative advantage in agri-food products on the Single European Market (SEM), thereby filling a research gap in this area. The time frame of 2010–2022 was deliberately selected, with data presented at six-year intervals to ensure the concise presentation of this paper’s results. In 2010, the markets had stabilized after the significant economic crisis of 2008, while in 2022, they had stabilized following the global impact of the COVID-19 pandemic. In the extant literature, researchers concur that competitiveness on a macro scale should be studied in dynamic terms. This approach is essential for demonstrating the ability to compete in the long run, i.e. the ability to maintain or improve competitiveness over time (Pawlak and Poczta, 2020).
In evaluating competitiveness, the underlying mechanisms, or determinants, are crucial. In macroeconomic terms, i.e., at the level of the entire national economy, competitiveness is based on a number of factors that determine the ability to achieve a competitive advantage in the international arena. These include (Wosiek, 2016):
a) human resources and labour productivity,
b) use of natural resources,
c) material capital,
d) technical knowledge and development,
e) efficiency of the socio-economic system.
Additionally, researchers identify determinants such as innovation, human capital, technology and digitalization, management efficiency, access to capital and financial resources, the institutional environment, network relationships, and cooperation (for more details, see Weresa, 2013).
High competitiveness is based on the quality and potential of human resources in a given country, which not only include employees’ knowledge and skills, but also the demographic structure, productivity, mobility of employees, and a strong professional ethos (Mikuła, 2012). Another important factor influencing the competitiveness of a given area is the effective management of natural resources, including minerals, taking into account climatic and geographical aspects and access to resources, the allocation of which is considered at the micro level (Góralski and Lazarek, 2009). Among the determinants of international competitiveness, we can distinguish the following: Contemporary theories increasingly emphasize that competitive advantage is based not only on the availability of raw materials but also on differences in technology and labour productivity. Inherited economic infrastructure also plays a key role. The level of development and effectiveness of transport, communication, energy, and education systems affects the functioning of enterprises. Effective management of material resources and efficient allocation of investment capital have a significant impact on the competitiveness of the economy. Technical knowledge resources, scientific progress, and the proper integration of modern technologies enable firms to function effectively in the economic environment (Bednarz, 2011). Ultimately, this technical progress has changed the nature and pace of economic development, affecting competitive structures and advantages. High productivity, cost control, and production efficiency remain vital for maintaining a competitive advantage (Łukiewska, 2019).
The study aims to show the ex- post competitive position of Polish agri-food products on the SEM, while resource competitiveness and the mechanisms underlying it are discussed in greater detail in Pawlak and Poczta (2020), and Nowak (2024).
Economic competitiveness is a term that is not precisely defined and can be interpreted in many different ways, depending on the intentions of the person using it. Researchers have noted the problem of the excess number of definitions of “competitiveness.” It is noteworthy to cite the observations of R.J. Carbaugh, who, in addition to underscoring the intricacy and heterogeneity of definitions of competitiveness, posits that these definitions essentially share a common thread. The competitiveness of the national economy as a whole is contingent upon its capacity to capitalize on the opportunities presented by the global market (Zawiślińska, 2003).
Competitiveness can be classified as a relative characteristic, and be defined as a comparative property. “Competitiveness is inherently relative and cannot be fully understood without a comparative analysis of a given entity against other similar ones” (Szymanik, 2016). The terms “competitive position” and “competitive capacity” are frequently associated with the concept of competitiveness. In the context of assessing competitiveness, a distinction can be made between retrospective (ex post) and prospective (ex ante) competitiveness. Ex post competitiveness analyses the level of competitiveness already achieved by a given entity, while ex ante competitiveness focuses on the potential achievements that a given entity may achieve in the future. When viewed in static terms, competitiveness is defined based on its results. Conversely, in dynamic terms, competitiveness is defined by the observation of how it evolves over time. Within a dynamic context, the concept of competitiveness is associated with the process of achieving a particular state of competition (Wosiek, 2016).
A significant factor in differentiating competitiveness is the level at which it is considered (micro-micro, micro, meso, macro, mega/global) (Adamczuk and Szeląg, 2006; Gorynia, 2010; Borowski, 2015). The author examines competitiveness at the meso level, which refers to the competitiveness of specific groups of agri-food products. The research can also be applied to the macro level by analysing Poland’s overall competitiveness in the SEM.
The micro level lies at the very bottom and refers to households and enterprises. In this category, competitiveness is defined as the capacity to engage in competitive interactions with other enterprises. A salient issue in this context is the quality of the goods and services provided, as well as the costs associated with their production (Gorynia, 2010; Pawlak, 2013).
The meso level, which is the middle layer, relates to industries, sectors, and branches of the economy. It focuses on separate parts of the national economy, delineated by entity or product type (Mróz, 2016; Gorynia, 2018). Hence, meso-competitiveness is defined as the ability of companies to create and market products in a given industry or sector of the economy that are distinguished by favourable prices, high quality, and other advantages (Nowakowski, 2000; Daszkiewicz, 2008). The meso level also encompasses the spatial dimension, referring to diverse territorial domains such as regions, provinces, or states (Nowakowski, 2000).
At the macro level, the focus is placed on the national economies of individual countries (Pawlak and Poczta 2011; Jabkowski and Kupsik, 2024) In the literature, competitiveness at the macro level is generally conceptualized in terms of a nation’s trade turnover on the international market. Two concepts are taken into account in considerations of macro-competitiveness, namely institutional and systemic aspects. The former refers to the quality and nature of the institutional environment, regarded as fundamental conditions for attaining a high level of economic competitiveness. Conversely, the systemic concept of macro-competitiveness underscores the pivotal role of innovation as the primary catalyst of competitiveness in contemporary economies (Fagerberg, 1988).
The “mega level”, also referred to as global, is employed to denote competitiveness among integration groups of countries, such as the European Union, the ASEAN Economic Community, NAFTA, or MERCOSUR (Adamczuk and Szeląg, 2006). Contemporary nations are progressively acknowledging the advantages of global collaboration, which is linked to heightened competitiveness in the international arena (Oziewicz and Michałowski, 2013).
The study of competitiveness has its origins in the field of management. Consequently, numerous scholars contend that the competitiveness of a nation should be regarded as the aggregate of the productivity and strategic actions by competing enterprises within its jurisdiction (Porter, 1990). From this perspective, the driving force behind national competitiveness is identified as companies, which function as participants in genuine competition on the international stage. It is also imperative to underscore the growing emphasis on the territorial (spatial) dimension in analyses of competitiveness. The concept of competitiveness at the regional level encompasses more than merely the aggregate outcomes of national competitiveness or the performance of companies operating within a specific region. Instead, it is a multifaceted characteristic of a territory, arising from both its inherent resources and its adaptability to shifting circumstances (Łaźniewska and Gorynia, 2012). As Piotrowska-Trybuł (2004) observes, the competitiveness of a given region can be evaluated across multiple domains, namely in spatial, socio-economic, and organizational dimensions.
A pivotal element in this regard is the business environment, which encompasses a group of external factors, i.e. those elements external to the company that influence its functioning (Fagerberg, 1988). A key component of the company’s environment pertains to the competitive dynamics that prevail in its industry. This phenomenon is driven by a group of competing companies that produce substitute goods. Therefore, the concept of competitiveness is influenced by five competitive forces. These include: the presence of competition between companies already operating within a given sector; the risk of new competitors entering the market; the threat of new substitute products being introduced to the market; the bargaining power of customers; and the influence of suppliers on the negotiation and tendering process (Porter, 1992).
Nowadays, competitiveness is becoming increasingly important at the mesoeconomic level, i.e., in relation to the agricultural sector. A considerable body of research has been dedicated to analysing the commercial or resource-potential competitiveness of agriculture in individual countries (Domańska and Nowak, 2016; Jabkowski, 2023). Some studies focus on Polish agriculture, which is influenced by various factors, including the Common Agricultural Policy and the Single European Market. One of the key determinants of international competitiveness within this sector pertains to the cost of basic agri-food products within the European Union, which often exceed global market rates (Domańska and Nowak, 2016). This makes EU products less competitive when compared to their equivalents manufactured outside (Krzyżanowski, 2011; Pawlak and Jabkowski, 2018).
Despite numerous studies on the subject, a singular, overarching definition of international competitiveness remains elusive. The concept of competitiveness is subject to variation across different dimensions. Consequently, novel research contributions in the domain of competitiveness at the micro-, meso-, macro-, and mega-levels hold considerable potential to advance scientific knowledge in this field.
RESEARCH REVIEW
The subject literature includes studies on the competitiveness of Polish agri-food products in the SEM. The preponderance of research in this field indicates that Poland plays a pivotal role in the European Single Market in the agri-food sector. Ambroziak’s (2015) study, which was based on a synthetic index, found that Polish food producers held sustainable comparative advantages in the global market, particularly within the EU-13 markets (i.e. those of new member states). According to Ambroziak , Poland had comparative advantages in thirteen groups of agri-food commodities in 2014, including tobacco and tobacco products, meat and fish products, meat and offal, dairy products, cereal preparations and pastries, various food preparations, cocoa and cocoa preparations, and fruit and vegetable preparations. Furthermore, cereals, vegetables, other animal products, sugars and confectionery, coffee, tea, and spices were also identified as competitive (Ambroziak, 2015). In 2017, Poland demonstrated competitiveness in global exports of meat and offal, dairy products, other animal products, vegetables, milled products, malt and starch, meat and fish products, sugars and confectionery, cocoa and cocoa products, cereal products and pastry, fruit and vegetable products, various food products, and tobacco and tobacco products. In their studies, Szczepaniak et al. (2018) and Ambroziak et al. (2024) examined competitiveness based on TC and RCA indicators. As Szczepaniak et al. (2018) observes, Poland exhibited a comparative advantage in 2015 in the SEM within the category of animal products and processed food products (RCA > 1). In her study, Szczepaniak et al. (2018) relied on the revealed comparative advantage (RCA) indicator, as developed by B. Balassa. Polish agri-food products also demonstrated a certain degree of competitiveness within the market of the new EU member states (EU-12) (Ambroziak, 2015). This assertion is corroborated by Szczepaniak’s analysis (2011), employing Balassa’s comparative advantage indicators in exports (RCA) and the Lafay index (LFI). The analysis indicates that Poland exhibited competitiveness in the export of product groups including tobacco and tobacco products, dairy products, meat and fish products, vegetable by-products, meat and edible offal, cereal products and confectionery, vegetable and fruit preserves, and various food preserves. However, for the last three product groups, the position revealed a weakening trend (Szczepaniak, 2011). Pawlak and Poczta’s (2008) examination of competitiveness employed quantitative measures of ex-post international competitive position. Their study demonstrated that Poland has attained competitive advantages in the SEM with respect to products that dominate exports, including fruit, vegetables, meat, offal, and meat products. This predominance is particularly evident in products of animal origin (Pawlak, 2009). Pawlak and Poczta (2020) developed a Widodo matrix to assess national competitiveness, incorporating the generated comparative advantage (RSCA) and the degree of export specialization (TBI). The application of the Widodo matrix method revealed that by 2019, Poland had attained a substantial comparative advantage in the SEM and concurrently maintained a positive net trade balance in the exportation of meat and offal, meat products, dairy products, cereal products, and tobacco products. In turn, Bułkowska (2025) assessed the competitiveness of Polish products on the Asian market using three indicators: the Revealed Symmetric Comparative Advantage (RSCA) indicator, the Trade Balance Indicator (TBI), and the Export Share Indicator (ESI). These analyses indicate that Polish exports to Central Asian countries predominantly comprised products in which Poland possessed both comparative advantages and a trade surplus. These included fruit and vegetables, fruit and vegetable preserves, cereal products and confectionery, animal waste and feed, live plants, and meat and offal (Bułkowska, 2025).
MATERIALS AND METHODS
The primary source of material for empirical analysis was statistical data from the public database of the United Nations Conference on Trade and Development (UNCTAD). The data is presented in the CN-24 combined nomenclature.
The study employed a set of purposefully selected ex-post international competitiveness measures (Pawlak and Poczta, 2008; Jabkowski and Pawlak, 2025):
the Export Specialization Indicator (SI),
the Exports-to-Imports Coverage Ratio (CR),
the Export Relative Comparative Advantage Index (XRCA),
the Relative Import Penetration Index, or Imports Relative Comparative Advantage Index (MRCA),
the Relative Trade Advantage Index (RTA),
the Grubel–Lloyd Index (IIT).
The export specialization index is a tool that assesses a given commodity’s share in a country’s exports in relation to the share of the same commodity in the exports of other countries in the region or worldwide (Pawlak, 2013; 2014).
X – exports, i – product, k – country, w – world or region.
The desired value of the export specialization measure is greater than 1. The higher the value of the indicator, the stronger the competitiveness. When the result falls below 1, it can be deduced that the competitiveness of a specific sector of the economy or region is suboptimal.
The export-to-import coverage ratio is defined as the extent to which the exports of a given sector, commodity, or group of commodities compensate for the need for imports - it is the extent to which they address domestic needs and reduce the need for imports. This measure is employed to assess a nation’s autonomy in a specific sector or its reliance on imports (Pawlak, 2016):
X – exports, M – imports, k – country.
A CR value that exceeds 100% indicates that a nation has a comparative advantage in a specific sector, resulting in a relative superiority over its trading partners. While this measure concentrates exclusively on the level of exports and imports of a particular nation, it does illustrate its internal advantage. When utilized in conjunction with other indicators, it becomes a valuable instrument for evaluating international competitiveness.
The relative comparative advantage index of exports is derived from comparing two quotients. The first serves to illustrate the comparison between the exports of a specific commodity from a given country (country A) and the exports of the same commodity from another country (country B). The second quotient refers to the total exports of a given commodity in both countries, but without taking into account the commodity under analysis (Pawlak, 2013):
X – exports, i, j – product categories, k, w – countries under consideration.In the context of the goods under analysis, if the value of XRCA exceeds 1, it indicates the existence of a comparative advantage for a given country. Conversely, if the value of this index is less than 1, the country fails to attain such an advantage.
The relative import penetration index is calculated in a manner analogous to the relative comparative export advantage index, except that it focuses on imports. As with the preceding indicator, it is predicated on a comparison of two quotients. The first quotient indicates the proportion of imports of a given commodity in country A relative to imports of the same goods in another country, B. The second quotient refers to the total imports of a given good in both countries, but without taking into account the good being analysed (Czakowski, 2017):
M – imports, i, j – product categories, k, w – countries under consideration.
The interpretation of the MRCAik measure is antithetical to that of the XRCAik. In the event that the value exceeds 1, it is indicative of the absence of a comparative advantage for a given country in the context of the analysed goods. Conversely, if the value is less than 1, it signifies the existence of a comparative advantage.
The relative trade advantage index is calculated by subtracting the relative import penetration index from the relative comparative export advantage index (Czakowski, 2017):
In the event that the XRCAik index exceeds 1 and the RTAik index is found to be positive, it can be deduced that the entity in question attains trade advantages within the market under consideration. In instances where the MRCAik index exceeds 1 and the RTAik index is negative, the entity in question does not generate trade advantages. Furthermore, if one of the components of the measure, XRCAik or MRCAik, is less than 1, then it is not possible to clearly determine the existence of advantages (Pawlak and Jabkowski, 2018).
The Grubel–Lloyd intra-industry trade index is another indicator employed to assess the level of competitiveness (Nosecka, 2014).
The values of this measure range from 0% to 100%. When the Grubel–Lloyd index value approaches 100%, it indicates a high degree of intra-industry trade, characterized by the congruence of export and import flows. Conversely, if the value of the indicator is closer to 0%, the scenario is classified as inter-industry trade. This indicates that the dynamics of import and export flows are not synchronized, as evidenced by the absence of overlap in their temporal patterns (Grubel and Lloyd, 1975).
These measures facilitate an objective framework for evaluating a nation’s degree of international competitiveness within the context of regional or global trade, encompassing the exchange of agri-food products and services. Moreover, they enable a nation’s position on the international stage to be determined.
RESULTS OF THE RESEARCH
Competitive position ex post
The value of agri-food exports from Poland to the SEM in 2010 was USD 12.8 billion, while in 2022 it nearly tripled, reaching USD 36.9 billion (Fig. 1). During the period under analysis, the value of imports also exhibited a similar upward trend. In 2010, the value of imports of agri-food products from SEM countries to Poland was USD 9.4 billion. By 2022, this figure had increased to USD 21.0 billion, representing a 120% increase compared to the initial period under analysis.
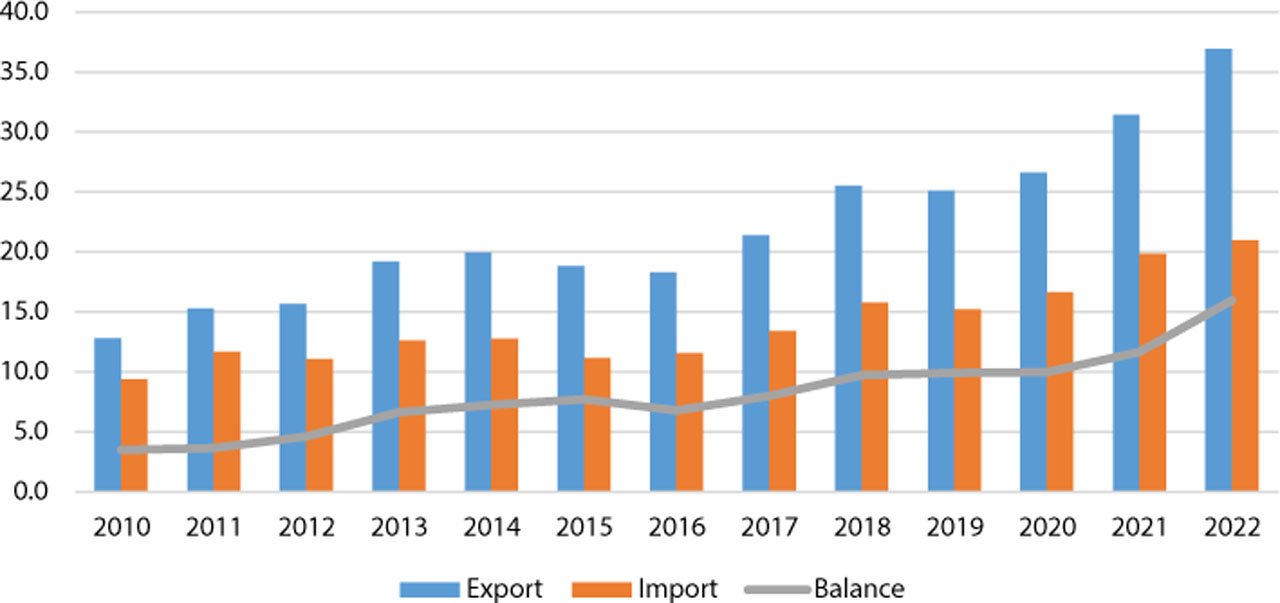
Fig. 1.
Value of exports, imports, and trade balance of Polish agri-food products to and from the SEM in 2010–2022 (USD billion)
Source: own study based on UNCTAD, https://unctadstat.unctad.org/datacentre (accessed on 14 June 2025).
Poland’s trade balance in total agri-food products with the countries of the Single European Market in 2010–2022 is positive. Consequently, the value of agri-food exports in the aforementioned period exceeded the value of imports. The trade balance in 2010–2022 exhibited an increase proportionate to the rise in the value of exports and imports (Fig. 1). As regards trade balance, a positive amount is generally considered a favourable indicator. However, an excessively large positive balance may be indicative of restricted access to foreign goods, which could potentially have adverse consequences for diversity and competitiveness of the domestic market.
An analysis of data for individual product groups indicates that meat and edible offal account for the largest share of Poland’s agri-food exports (Table 1). Between 2010 and 2022, the value of meat exports from Poland to the SEM surged by 119%, reaching USD 6,164 million in 2022. This accounts for approximately 17% of the total value of agri-food exports (Fig. 2). Tobacco and industrial tobacco substitutes, as well as dairy products, bird eggs, and natural honey, also play a significant role in Polish agri-food exports in terms of trade value. The value of exports of these product groups increased in the analysed period, reaching over USD 3,000 million in 2022 (Table 1). Other significant export products include various food preparations, cereal preparations, starch flour, residues and waste from the food industry, animal feed, and cereals. During the period under analysis, cereals exhibited the highest growth rate in export value (550%), reaching USD 2,318 million in 2022. A cursory analysis reveals that among all product groups, only one exhibits negative growth in value. From 2010 to 2022, the value of live animal exports decreased by approximately 50%, and in 2022, this sector was of negligible importance, accounting for a mere 0.3% of total agri-food exports.
Table 1.
Value of Polish agri-food exports and imports to and from the SEM in 2010, 2016, and 2022 (USD million)
| CN | Product | Export | Import | ||||
|---|---|---|---|---|---|---|---|
| 2010 | 2016 | 2022 | 2010 | 2016 | 2022 | ||
| 1 | Live animals | 220 | 100 | 106 | 275 | 599 | 925 |
| 2 | Meat and meat preparations | 1 933 | 3 121 | 6 164 | 1 283 | 1403 | 1 950 |
| 3 | Fish, crustaceans, molluscs and preparations thereof | 769 | 1 197 | 1 986 | 243 | 427 | 558 |
| 4 | Dairy products and birds’ eggs | 1 380 | 1 400 | 3 225 | 557 | 923 | 1 679 |
| 5 | Crude animal materials, n.e.s. | 133 | 183 | 351 | 142 | 123 | 215 |
| 7 | Vegetables | 582 | 633 | 1 060 | 508 | 547 | 1 002 |
| 8 | Fruits and nuts (excluding oil nuts), fresh or dried | 113 | 252 | 480 | 637 | 688 | 1 156 |
| 9 | Coffee, tea, cocoa, spices, and manufactures thereof | 341 | 625 | 773 | 348 | 439 | 933 |
| 10 | Cereals and cereal preparations | 356 | 549 | 2 318 | 324 | 293 | 544 |
| 12 | Oil seeds and oleaginous fruits | 171 | 126 | 476 | 87 | 217 | 338 |
| 13 | Crude rubber (including synthetic and reclaimed) | 152 | 158 | 274 | 408 | 413 | 748 |
| 14 | Crude vegetable materials, n.e.s. | 227 | 171 | 316 | 242 | 190 | 292 |
| 15 | Animal and vegetable oils, fats and waxes | 276 | 483 | 1 173 | 475 | 682 | 1 589 |
| 16 | Preparations of meat, fish, crustaceans, mollusks | 612 | 972 | 1 554 | 167 | 191 | 352 |
| 17 | Sugar, sugar preparations and honey | 322 | 445 | 715 | 329 | 316 | 528 |
| 18 | Cocoa and cocoa preparations | 467 | 970 | 1 645 | 617 | 938 | 1 426 |
| 19 | Preparations of cereals, flour, starch, or milk | 683 | 1 294 | 2 433 | 459 | 573 | 1 110 |
| 20 | Preparations of vegetables, fruit, nuts | 1 066 | 1 392 | 2 271 | 388 | 448 | 992 |
| 21 | Miscellaneous edible products and preparations | 931 | 1 289 | 2 774 | 741 | 835 | 1 737 |
| 22 | Beverages | 335 | 511 | 908 | 377 | 428 | 990 |
| 23 | Feedstuff for animals (excluding unmilled cereals) | 396 | 610 | 2 310 | 507 | 501 | 1 507 |
| 24 | Tobacco and tobacco manufactures | 1 359 | 1 824 | 3 616 | 240 | 367 | 389 |
| Total | 12 824 | 18 305 | 36 926 | 9 354 | 11 539 | 20 961 | |
[ii] Source: own study based on UNCTAD, https://unctadstat.unctad.org/datacentre (accessed on 14 June 2024).
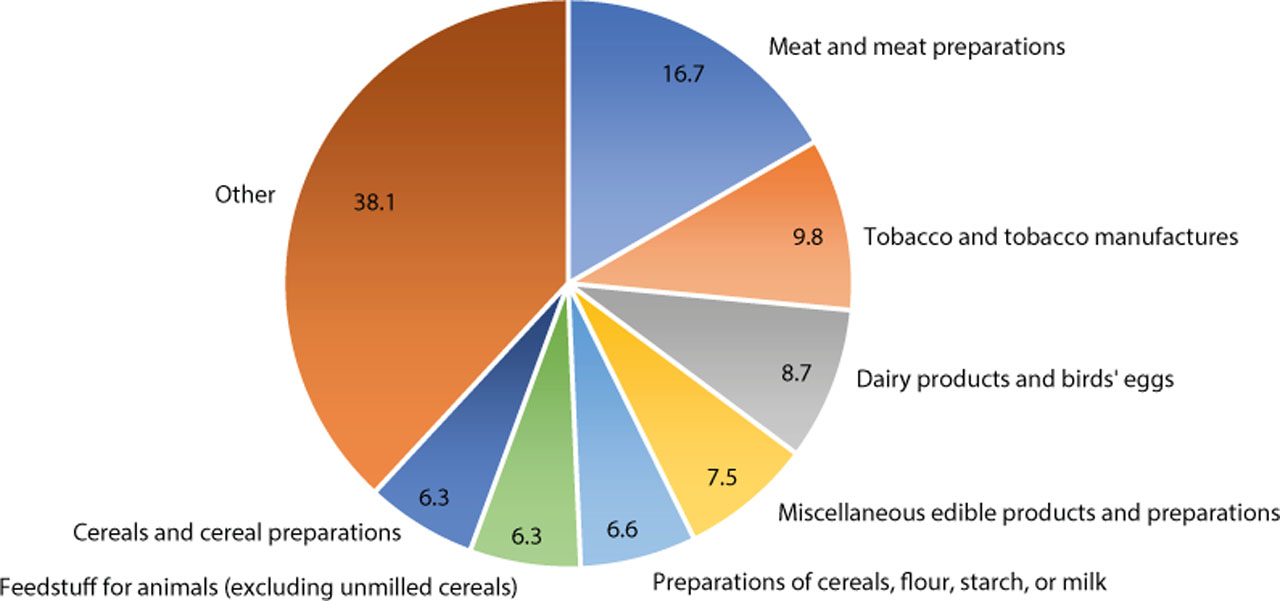
Fig. 2.
Structure of agri-food exports from Poland to the SEM in 2022 (%)
Source: own study based on UNCTAD, https://unctadstat.unctad.org/datacentre (accessed on 14 June 2025).
As illustrated in Figure 3, the most significant proportion of total agri-food imports from the SEM into Poland in 2022 comprised meat, dairy products, bird eggs, natural honey, and various food preserves. These three product groups account for 25% of the total value of agri-food imports to Poland (from 9.3% to 8.0%; i.e., USD 2 billion to USD 1.7 billion). Oilseeds and oil fruits exhibit the highest growth rate in terms of import value. The value of imports for this product group increased by approximately 300% between 2010 and 2022, reaching USD 338 million in the last period covered by this analysis (Table 1). During the study period, a variety of food products, animal and vegetable fats and oils, and live animals also demonstrated high growth rates. The value of imports of these product groups, increasing by 235% compared to the first period analysed. Notably, the upward trajectory of live animal imports is in stark contrast to the shifts in the value of exports, with all product categories contributing meaningfully to agri-food imports from the SEM to Poland.
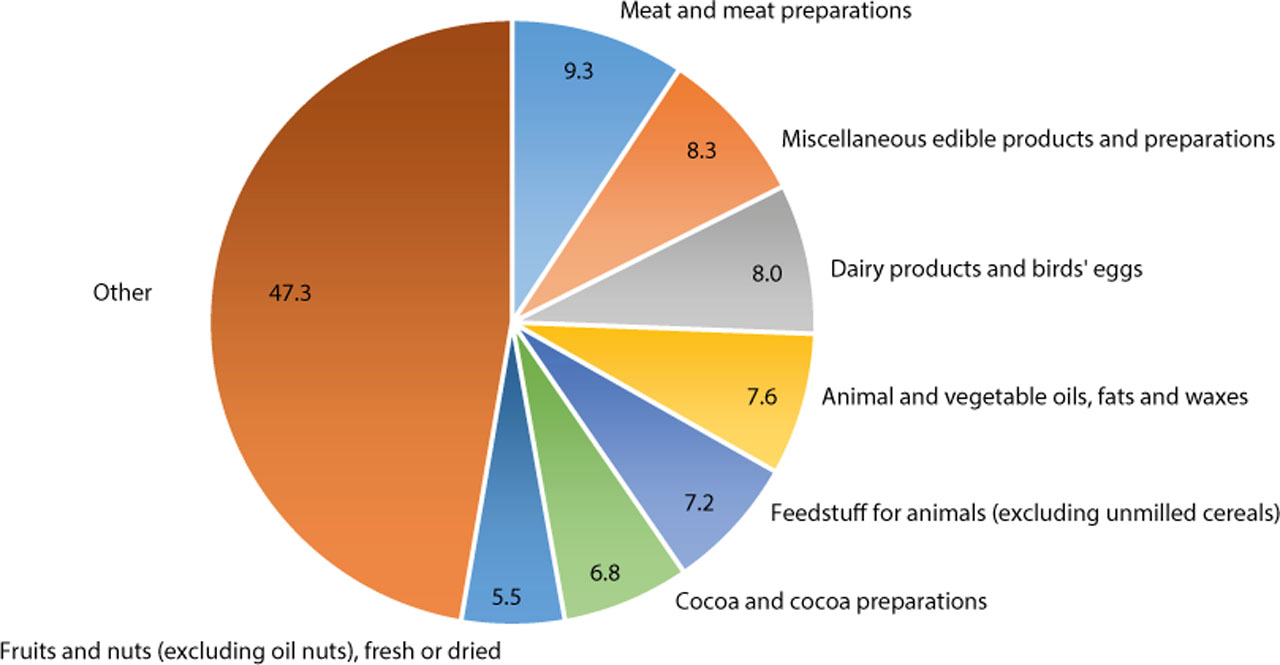
Fig. 3.
Structure of agri-food imports to Poland from the SEM in 2022 (%)
Source: own study based on UNCTAD, https://unctadstat.unctad.org/datacentre (accessed on 14 June 2025).
Ex-post competitive position assessment is of considerable importance because it facilitates process optimization and maximization of benefits derived from market participation. It offers a retrospective view on the efficacy of actions undertaken by economic operators within the context of competition on international markets. Furthermore, it serves as a valuable instrument for identifying the strengths and weaknesses of a sector, industry, or product in relation to its competitors. An ex-post assessment of competitive position provides valuable data and information for economic decision-makers, politicians, and institutions dealing with trade policy, empowering them to make more informed and effective decisions. In order to analyse the competitive position of Polish agri-food products in the Single European Market, this study relied on purposefully selected indicators for measuring ex-post international competitiveness. The export specialization index (SI) is defined as the ratio of the share of exports of a given product in the total exports of the product group under study to the share of exports of that product in the total exports of the trading partner. In the context of trade in Polish agricultural and food products between Poland and SEM countries, the index attained its highest value for tobacco and industrial tobacco substitutes, ranging from approximately 2.6 to 3.7 between 2010 and 2022 (Table 2). In all the periods examined, Poland also attained the targeted value of the export specialization measure (above 1) for meat and edible offal; fish, crustaceans, molluscs, and other aquatic invertebrates; products of animal origin; meat, fish, and crustacean products; cereal, flour, starch, or milk; vegetable, fruit, and nut preparations; and various food preparations. In 2022, Poland also achieved export competitiveness for cereals and residues and waste from the food industry (Table 2). The lowest value of the export specialization (SI) indicator in Poland’s trade in agri-food products with the SEM in 2010–2022 was recorded for shellac, gum, resin, and other vegetable juices and extracts. Furthermore, Poland also generates low SI values for products such as fruit, nuts, and live animals (Table 2).
Table 2.
Value of the export specialization index (SI) and export-to-import coverage ratio (CR) and relative comparative advantage index for exports (XRCA) in Poland’s agri-food trade with the SEM in 2010, 2016, and 2022
| CN | SI | CR (%) | XRCA | ||||||
|---|---|---|---|---|---|---|---|---|---|
| 2010 | 2016 | 2022 | 2010 | 2016 | 2022 | 2010 | 2016 | 2022 | |
| 1 | 0.60 | 0.20 | 0.15 | 80.0 | 16.6 | 11.4 | 0.59 | 0.20 | 0.14 |
| 2 | 1.43 | 1.77 | 1.84 | 150.7 | 222.4 | 316.0 | 1.50 | 1.93 | 2.01 |
| 3 | 1.37 | 1.25 | 1.16 | 316.1 | 280.6 | 355.7 | 1.39 | 1.27 | 1.17 |
| 4 | 0.97 | 0.78 | 0.77 | 247.7 | 151.7 | 192.1 | 0.97 | 0.76 | 0.75 |
| 5 | 1.77 | 1.74 | 1.47 | 93.4 | 148.1 | 163.4 | 1.77 | 1.75 | 1.48 |
| 7 | 0.78 | 0.61 | 0.58 | 114.7 | 115.6 | 105.7 | 0.77 | 0.60 | 0.57 |
| 8 | 0.16 | 0.23 | 0.25 | 17.7 | 36.6 | 41.5 | 0.15 | 0.22 | 0.24 |
| 9 | 1.25 | 1.30 | 0.83 | 97.8 | 142.6 | 82.8 | 1.26 | 1.32 | 0.83 |
| 10 | 0.64 | 0.74 | 1.30 | 109.8 | 187.5 | 426.2 | 0.63 | 0.74 | 1.32 |
| 12 | 0.75 | 0.39 | 0.64 | 197.5 | 58.3 | 140.7 | 0.74 | 0.38 | 0.63 |
| 13 | 0.27 | 0.19 | 0.18 | 37.2 | 38.3 | 36.7 | 0.26 | 0.19 | 0.18 |
| 14 | 1.24 | 1.03 | 0.84 | 93.7 | 89.9 | 108.1 | 1.24 | 1.03 | 0.84 |
| 15 | 0.48 | 0.53 | 0.46 | 58.2 | 70.9 | 73.8 | 0.46 | 0.52 | 0.44 |
| 16 | 1.51 | 1.59 | 1.43 | 366.1 | 507.8 | 441.6 | 1.54 | 1.62 | 1.45 |
| 17 | 0.98 | 1.01 | 0.82 | 97.8 | 140.7 | 135.3 | 0.98 | 1.01 | 0.82 |
| 18 | 0.91 | 1.14 | 1.16 | 75.7 | 103.4 | 115.4 | 0.91 | 1.15 | 1.17 |
| 19 | 1.14 | 1.39 | 1.26 | 148.8 | 225.7 | 219.2 | 1.15 | 1.42 | 1.27 |
| 20 | 1.56 | 1.38 | 1.19 | 274.6 | 310.6 | 228.9 | 1.61 | 1.41 | 1.20 |
| 21 | 1.38 | 1.25 | 1.12 | 125.6 | 154.5 | 159.7 | 1.41 | 1.27 | 1.13 |
| 22 | 0.39 | 0.42 | 0.38 | 88.9 | 119.5 | 91.7 | 0.37 | 0.40 | 0.37 |
| 23 | 0.67 | 0.68 | 1.11 | 78.0 | 121.8 | 153.3 | 0.66 | 0.67 | 1.12 |
| 24 | 2.58 | 2.91 | 3.73 | 565.6 | 497.8 | 929.2 | 2.77 | 3.13 | 4.02 |
[i] Source: own study based on UNCTAD, https://unctadstat.unctad.org/datacentre (accessed on 14 June 2025).
While the export-to-import coverage ratio (CR) concentrates exclusively on the level of exports and imports of a particular nation, it does illustrate its internal advantage. In the period under review, Poland demonstrated the highest CR values for the following categories: tobacco and tobacco substitutes (498–929%), meat, fish, and shellfish products (366–507%), and fish, shellfish, and molluscs (280–356%) (Table 2). In turn, the lowest value of this indicator was recorded for live animals in 2016 (16%) and 2022 (11%). Across all periods examined, the import coverage ratio for fruits and nuts remained low. In 2010, 2016, and 2022, certain products exhibited alternating results that were either above or below 100%. In 2016, the value of Polish exports equalled that of imports for coffee, tea, mate, and spices, as well as non-alcoholic beverages, alcohol, and vinegar. This phenomenon was not witnessed in the other periods under analysis. Poland’s role as a major exporter of agri-food products to the SEM is substantiated by the data, which indicates values exceeding 100% across the majority of the product categories examined.
Poland achieves the highest XRCA values in trade with the SEM for tobacco and tobacco substitutes in all periods analysed (from 2.77 to 4.02). Furthermore, a comparative advantage in exports was documented in 2010, 2016, and 2022 for the following product categories: meat and edible offal; fish, crustaceans, and molluscs; animal products; meat, fish, and crustacean products; cereal, flour, starch, or milk products; processed vegetables, fruits, nuts; and various processed foods. The lowest value of the index in 2022 was 0.18, which pertained to the trade in shellac, gum, and resin. This indicates that Poland has no comparative advantage in exports for this specific product group traded with SEM countries.
In 2016 and 2022, Poland attained the highest MRCA index value for live animals, with values of 2.06 and 2.21, respectively. It means that Poland has not attained a comparative advantage in terms of imports for this specific product group. Furthermore, during the periods covered by the analysis, Poland failed to attain a competitive edge for meat and edible offal, animal products, edible fruits and nuts, coffee, tea, mate, and spices, vegetable materials for weaving, fats and oils, sugar and sugar confectionery, cocoa and cocoa products, and various food preparations (Table 3). Moreover, Poland attained an MRCA index value greater than 1 in 2010 and 2022 for shellac, gum, and resin, as well as for residues and waste from the food industry.
Table 3.
Relative comparative advantage index for imports (MRCA), and relative Trade Advantage (RTA) index value and summary assessment and Value of the Grubel–Lloyd intra-industry trade (IIT) index in Poland’s trade in agri-food products in the SEM in 2010, 2016, and 2022
| CN | MRCA | RTA | Summary assessment | IIT (%) | ||||||||
|---|---|---|---|---|---|---|---|---|---|---|---|---|
| 2010 | 2016 | 2022 | 2010 | 2016 | 2022 | 2010 | 2016 | 2022 | 2010 | 2016 | 2022 | |
| 1 | 1.06 | 2.06 | 2.21 | −0.48 | −1.86 | −2.07 | − | − | − | 88.9 | 28.5 | 20.5 |
| 2 | 1.37 | 1.33 | 1.05 | 0.14 | 0.60 | 0.95 | + | + | + | 79.8 | 62.0 | 48.1 |
| 3 | 0.64 | 0.81 | 0.63 | 0.75 | 0.47 | 0.55 | + | + | + | 48.1 | 52.6 | 43.9 |
| 4 | 0.49 | 0.77 | 0.67 | 0.48 | −0.01 | 0.08 | +/− | +/− | +/− | 57.5 | 79.5 | 68.5 |
| 5 | 2.50 | 1.73 | 1.57 | −0.73 | 0.02 | −0.09 | − | + | − | 96.6 | 80.6 | 75.9 |
| 7 | 0.92 | 0.83 | 0.97 | −0.15 | −0.23 | −0.40 | +/− | +/− | +/− | 93.2 | 92.8 | 97.2 |
| 8 | 1.34 | 1.06 | 1.12 | −1.19 | −0.84 | −0.87 | − | − | − | 30.1 | 53.6 | 58.7 |
| 9 | 1.88 | 1.53 | 1.77 | −0.63 | −0.21 | −0.94 | − | − | − | 98.9 | 82.4 | 90.6 |
| 10 | 0.73 | 0.55 | 0.47 | −0.10 | 0.18 | 0.85 | +/− | +/− | + | 95.3 | 69.6 | 38.0 |
| 12 | 0.52 | 0.92 | 0.74 | 0.23 | −0.53 | −0.11 | +/− | +/− | +/− | 67.2 | 73.7 | 83.1 |
| 13 | 1.09 | 0.94 | 1.04 | −0.84 | −0.75 | −0.86 | − | +/− | − | 54.2 | 55.4 | 53.7 |
| 14 | 1.69 | 1.57 | 1.30 | −0.45 | −0.54 | −0.46 | − | − | − | 96.8 | 94.7 | 96.1 |
| 15 | 1.10 | 1.20 | 1.07 | −0.64 | −0.68 | −0.63 | − | − | − | 73.6 | 82.9 | 84.9 |
| 16 | 0.58 | 0.53 | 0.59 | 0.95 | 1.10 | 0.86 | + | + | + | 42.9 | 32.9 | 36.9 |
| 17 | 1.28 | 1.04 | 1.01 | −0.30 | −0.03 | −0.19 | − | − | − | 98.9 | 83.1 | 85.0 |
| 18 | 1.76 | 1.80 | 1.82 | −0.85 | −0.66 | −0.65 | − | − | − | 86.2 | 98.3 | 92.9 |
| 19 | 0.99 | 0.91 | 0.96 | 0.15 | 0.51 | 0.31 | + | + | + | 80.4 | 61.4 | 62.7 |
| 20 | 0.77 | 0.70 | 0.93 | 0.83 | 0.71 | 0.27 | + | + | + | 53.4 | 48.7 | 60.8 |
| 21 | 1.42 | 1.28 | 1.28 | −0.01 | −0.02 | −0.15 | − | − | − | 88.6 | 78.6 | 77.0 |
| 22 | 0.56 | 0.52 | 0.71 | −0.19 | −0.12 | –0.34 | +/− | +/− | +/− | 94.1 | 91.1 | 95.7 |
| 23 | 1.25 | 0.93 | 1.35 | −0.59 | −0.26 | −0.23 | − | +/− | − | 87.7 | 90.2 | 79.0 |
| 24 | 0.60 | 0.84 | 0.64 | 2.17 | 2.29 | 3.38 | + | + | + | 30.1 | 33.5 | 19.4 |
[i] Source: own study based on UNCTAD, https://unctadstat.unctad.org/datacentre (accessed on 14 June 2025).
In the period under analysis, Poland exhibited its strongest trade advantages (overall rate: +. Table 3) in the SEM for the following products: tobacco and tobacco substitutes (2.17–3.38), meat and edible offal, fish, crustaceans and their products, as well as products made from cereals, flour, starch or milk, confectionery, and processed vegetables, fruits and nuts. Moreover, Poland also secured trade advantages within the Single European Market in the categories of animal products not elsewhere specified (in 2016) and cereals (in 2022). No trade advantages were identified in the other groups, and in some cases, it was not possible to determine such advantages. During the period under analysis, no product group associated with crop production yielded trade advantages that persisted for multiple years.
During the period under analysis, Poland attained the highest value of the Grubel–Lloyd intra-industry trade index for vegetables and edible roots; plant materials for weaving and products of plant origin; cocoa and cocoa products; non-alcoholic beverages, spirits, and vinegar. This finding suggests that trade in these products is predominantly intra-industry in nature (Table 3). In 2010, 2016, and 2020, Poland recorded the lowest Grubel–Lloyd intra-industry trade index primarily for the following products: fish, crustaceans, molluscs, and other aquatic invertebrates; edible fruits and nuts; shellac, gum, and resin; processed meat, fish, crustaceans, molluscs, or other aquatic invertebrates; processed vegetables, fruits, and nuts; and tobacco and tobacco substitutes. This finding strongly suggests the inter-industry nature of trade in these product groups. It is noteworthy noting that in the case of live animals, trade underwent a shift from the intra-industry scheme at the onset of the period under review (89%) to the inter-industry model in 2016 and 2022 (29% and 20%, respectively). Further research should focus on the competitive position of Polish agri-food products in the SEM in relation to regional trade agreements and EU-Ukraine economic cooperation. Ukraine is a significant global player in the export of the products under study, and establishing cooperation may weaken the position of European producers, including Polish ones.
CONCLUSIONS
The production factors presented and the relationships between them indicate positive transformations in Polish agriculture. They are a fundamental mechanism for international competitiveness. Positive developments will help maintain or increase Poland’s potential competitive position in the EU market.
Poland functions as a net exporter of agri-food products to the SEM. During the period under review, Poland demonstrated a positive bilateral trade balance, reaching USD 3.5 billion in 2010 and USD 16.0 billion in 2022.
In 2022, the primary commodities contributing to Poland’s exports to the SEM were meat and edible offal (17%), tobacco (10%), and dairy products (9%). Conversely, the top categories of imports from the SEM to Poland were meat and edible offal (9%), various food preparations (8%), and dairy products, bird eggs, and natural honey (8%).
The research conducted made it possible to assess the development of the comparative advantages of Polish agri-food products in the Single European Market (SEM) from a long-term perspective. The analysis carried out above enables an assessment of the competitive position of Polish agri-food products in trade within the Single European Market. During the period under analysis, Poland generated trade advantages for products of animal origin and processed goods. The production of these commodities is labour-intensive, and as indicated in the article, Poland has significant labour inputs in agriculture. Moreover, it has secured trade advantages in exports to the SEM, with a focus on products such as tobacco and tobacco products, meat and edible offal, fish, crustaceans, and molluscs, along with meat, fish, crustacean, cereal, fruit, and vegetable products. Notably, during the period under analysis, there was a discernible increase in trade advantages for tobacco and tobacco products, as well as for meat and edible offal – products which are also distinguished by a relatively high export specialization ratio. These groups represent a pivotal segment within the overarching framework of Polish exports to the SEM, exhibiting the most pronounced growth dynamics in terms of value. Conversely, while the remaining product groups sustained their trade advantages, they exhibited a downward trend in the subsequent years examined.
Poland’s trade with SEM countries is characterized by inter-industry transactions, particularly in the domains of tobacco and tobacco products, live animals, and meat, fish, and shellfish products. However, as regards the majority of product categories, Poland engages in intra-industry trade.
In order to increase or maintain the competitiveness of Polish agri-food products, Poland should focus on several key aspects (recommendations):
Poland should increase or maintain its trade surplus in agri-food products in the Single Market.
Support innovation and technological development on farms and in the food sector,
Develop effective exports under conditions of free and fair trade to EU countries.
Monitor the provisions of the EU’s common trade policy in relations with third countries, particularly regarding regional trade agreements, and apply trade protectionism for particularly sensitive products.
Develop the economy with a focus on modern digital, energy, and transportation infrastructure.
Promote products outside the EU market and build a high-quality brand in the trade of agri-food products.
Develop trade relations with new partners.