
INTRODUCTION
The Mongolian steppe (covering around 80% of the country) supports nomadic pastoralism and provides critical ecosystem services, including forage production and carbon regulation (Fernandez-Gimenez, 2000; Hilker et al., 2014; Qu et al., 2021) However, its sustainability is increasingly threatened by climate variability, land degradation, and grazing pressure (Hilker et al., 2014).
In this semi-arid region, highly variable precipitation makes water availability the main constraint on forage production, while soil fertility (especially nitrogen and organic matter) and terrain factors (slope, aspect, elevation) further impact vegetation growth patterns (Yoshihara et al., 2023; Nandintsetseg et al., 2024; Lechner et al., 2020).
Remote sensing indices (NDVI, EVI, SAVI) are widely used for rangeland monitoring and drought assessment in Mongolia (Enebish et al., 2020; Huete, 1988; Li et al., 2022). However, a key gap remains in linking satellite-derived indicators with field-based forage yield and nutritive quality.
This study addresses this gap by integrating Sentinel-2 and ALOS PALSAR data with field measurements in Bornuur sub-province to analyse relationships between vegetation indices, terrain features, and forage yield and quality.
Accordingly, this study is guided by four research questions: (1) How strongly do the NDVI and EVI correlate with field measured forage yield and nutritive quality?; (2) Which topographic variables (slope, aspect, and elevation) influence hayfield productivity most?; (3) Does combining remote sensing and terrain data improve yield prediction accuracy compared to using vegetation indices alone?; and (4) What do these spatial patterns imply for sustainable land use planning and precision grazing management in semiarid rangelands?
MATERIALS AND METHODS
Our study aimed to examine the relationship between forage quality, yield, surface factors, and vegetation indices derived from satellite data. It was conducted following the flowchart outlined below (Fig. 1).
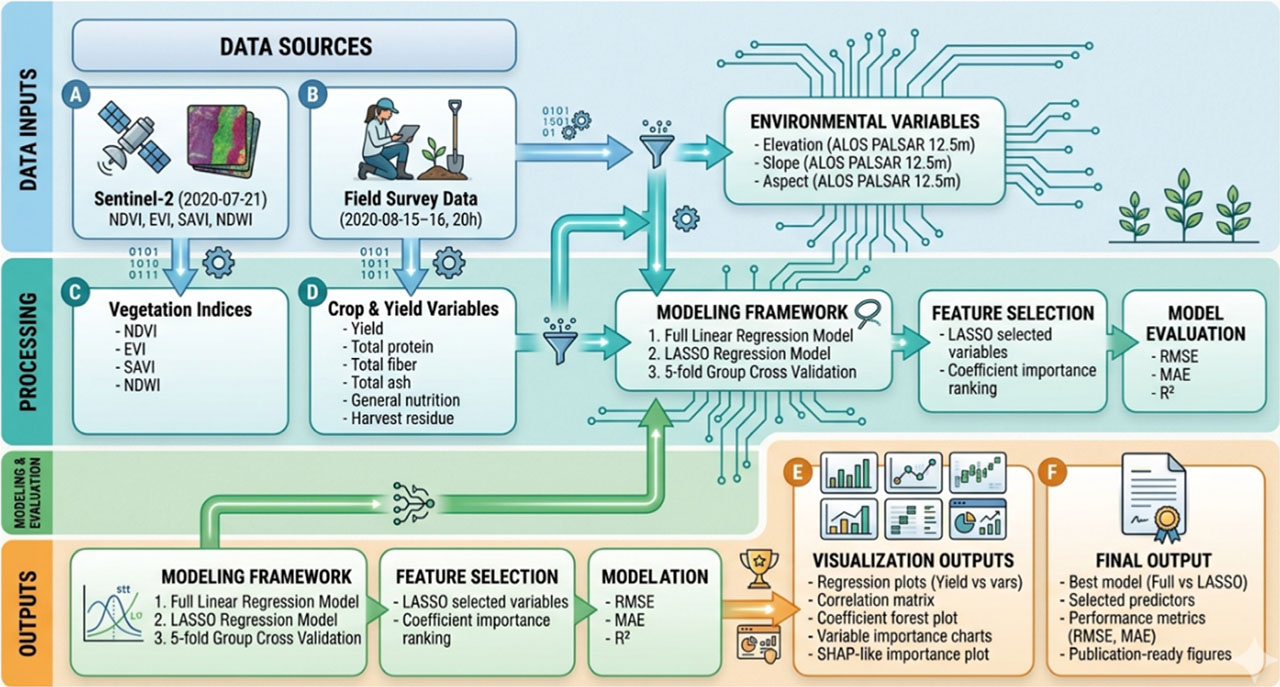
Fig. 1.
Flowchart of research
Source: own elaboration.
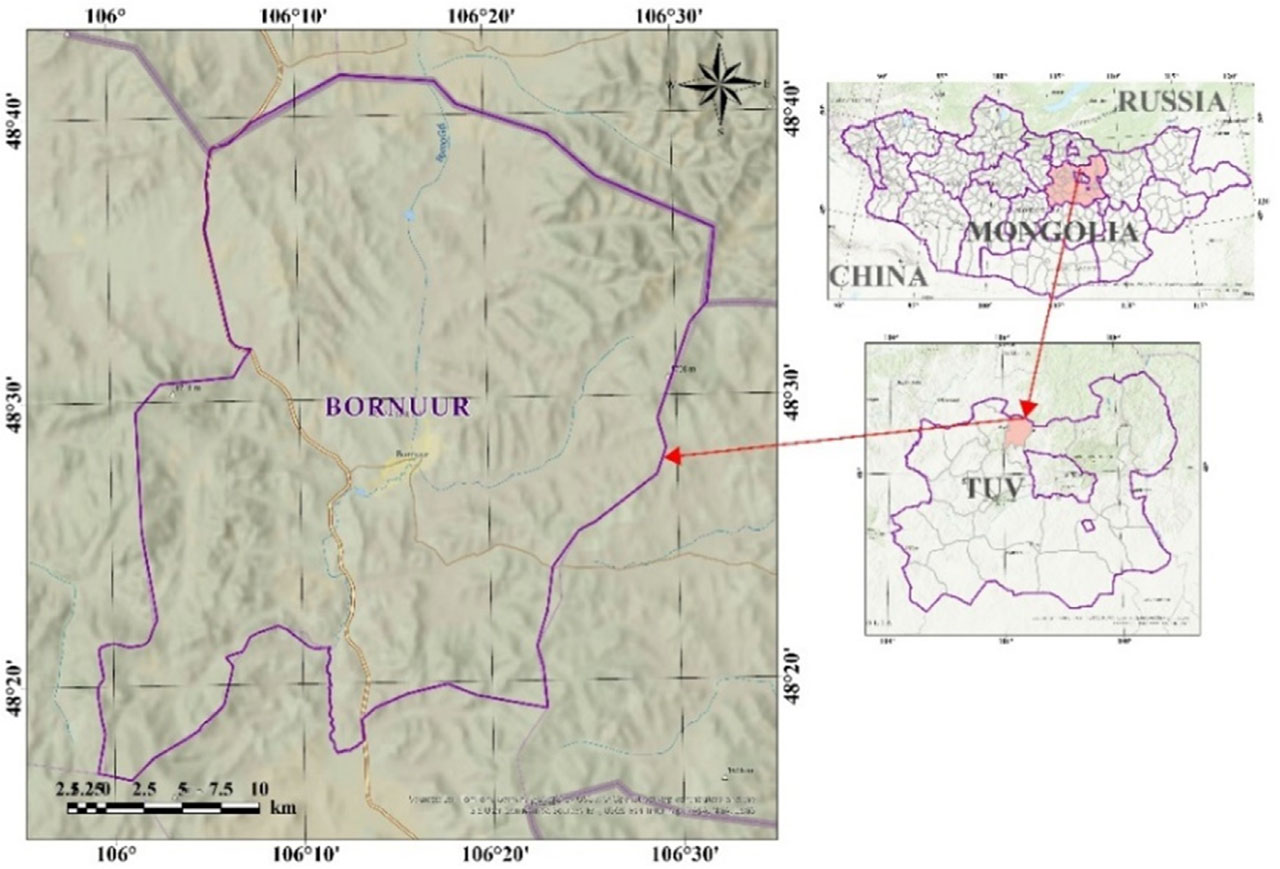
Fig. 2.
Research study area of Bornuur sub-province, Tuv province
Source: own elaboration.
Study area
In Bornuur sub-province, agricultural intensification and livestock pressure have driven land degradation and reduced hay productivity to only 565.7 tons from 7,443.2 ha in 2020 (Callaghan et al., 2024; Danzhalova et al., 2023; Jamsranjav et al., 2018; NSOM, 2025).
Field data collection
Fieldwork was conducted on 15–16 August 2020, in Bornuur sub-province, Tuv Province, Mongolia. It focused on the major forage production areas. Twenty sampling sites were selected using a stratified random design to capture variation in land use intensity and topography.
At each site, aboveground biomass was collected from 1 m2 quadrats, clipped at ground level, oven-dried at 65°C, and weighed to determine the dry matter yield (g/m2), in line with national monitoring protocols (NSOM, 2025).
Plant species composition was recorded using the Hayfield Plant Identifier manual (Zhang et al., 2021) to identify dominant and subdominant species. Subsamples of dominant species were analysed at the Mongolian University of Life Sciences using standard methods to determine crude protein, NDF, ADF, and in vitro dry matter digestibility (Ren et al., 2016).
This approach enabled integrated assessment of both forage yield and nutritive quality under existing land use conditions.
Terrain Variable Analysis
Topographic analysis was based on the ALOS PALSAR DEM (12.5 m resolution) from JAXA, pre-processed for GIS use (Rosenqvist et al., 2007). Slope, aspect, and elevation were derived as key terrain variables. Slope influences erosion, and vegetation patterns (Hou et al., 2014), aspect controls microclimate conditions such as solar radiation and soil moisture (Liu et al., 2012), and elevation affects temperature and precipitation gradients. These variables were used to assess topographic effects on forage yield and quality.
Vegetation Indices Calculation
Sentinel-2 (10 m) imagery acquired on 21 July 2020 (ID: S2B_MSIL2A_20200721T035539_N0500_R004_T48UWU) – 25 days prior to the field campaign – was obtained from Google Earth Engine as the only cloud free scene within a 30day window. To minimise phenological discrepancies, we assumed relatively stable vegetation conditions between late July and midAugust in this steppe ecosystem (Drusch et al., 2012). The July 21 image was selected as the closest cloud-free acquisition to the August 15–16 field campaign date. Relevant spectral bands, including red (B4), green (B3), blue (B2), near-infrared (B8), and shortwave infrared (B11), were used for analysis and vegetation index calculation. Sentinel-2 Level-2A images are atmospherically corrected using the Sen2Cor algorithm. Pixels with cloud cover >10% were excluded using the QA60 band.
Among the indices, the NDVI was calculated using the red and near-infrared bands to assess vegetation condition. It ranges from 1 to 1, with higher values indicating greater vegetation density and vigour (Rouse et al., 1974).
where:RED – red band, NIR – near-infrared band
The Enhanced Vegetation Index (EVI) improves upon NDVI by reducing atmospheric effects, canopy background noise, and soil influences. It is especially effective in areas with dense vegetation and uses additional correction factors to enhance sensitivity to canopy structure and background conditions.
where:G – gain factor, C1 and C2 – coefficients for the red and blue bands, L – canopy background adjustment factor (Huete, 1988).
The Soil-Adjusted Vegetation Index (SAVI) is designed for areas with sparse vegetation and reduces the influence of soil brightness on spectral reflectance. It modifies NDVI by incorporating a soil adjustment factor (L), improving accuracy in low vegetation cover conditions.
L – is typically set to 0.5 in regions with sparse vegetation (Huete, 1988).
The Normalised Difference Water Index (NDWI) is used to assess vegetation water content and detect surface water bodies. It is calculated using near-infrared and shortwave infrared bands, where higher values indicate greater moisture content or the presence of water (Gao, 1996).
where:NIR – near-infrared band, SWIR – Shortwave-infrared band
Data Analysis
Pearson’s correlation analysis was applied to quantify the relationships between vegetation indices, topographic variables, and field-measured forage yield and nutritive quality (Huete, 1988; Rouse et al., 1974). Linear regression models were developed to assess the predictive performance of vegetation indices for biomass yield (Booth and Tueller, 2003). Descriptive statistical measures, including mean, standard deviation, skewness, and kurtosis were computed to characterise spatial variability in the dataset (Tabachnick, 2013).
Multivariate regression analysis was conducted to evaluate the combined predictive power of all variables. LASSO (Least Absolute Shrinkage and Selection Operator) regularisation was applied for variable selection using 5-fold cross-validation to prevent overfitting, given the limited sample size (n = 20) (Hastie, 2015; Tibshirani, 1996). Model performance was assessed using R2, Root Mean Square Error (RMSE), and Mean Absolute Error (MAE) (James et al., 2013). SHAP (SHapley Additive exPlanations) analysis was performed to quantify the marginal contribution of each variable to yield predictions (Lundberg and Lee, 2017). All statistical analyses were performed using RStudio (version 2024.04.0+735) with the glmnet, caret, and shapviz packages (Friedman et al., 2010; R Core Team, 2024).
RESULTS
Field survey work
During the final ten days of August 2020, vegetation surveys were conducted at 20 designated sampling points within the hayfields of Bornuur sub-province (Fig. 3).
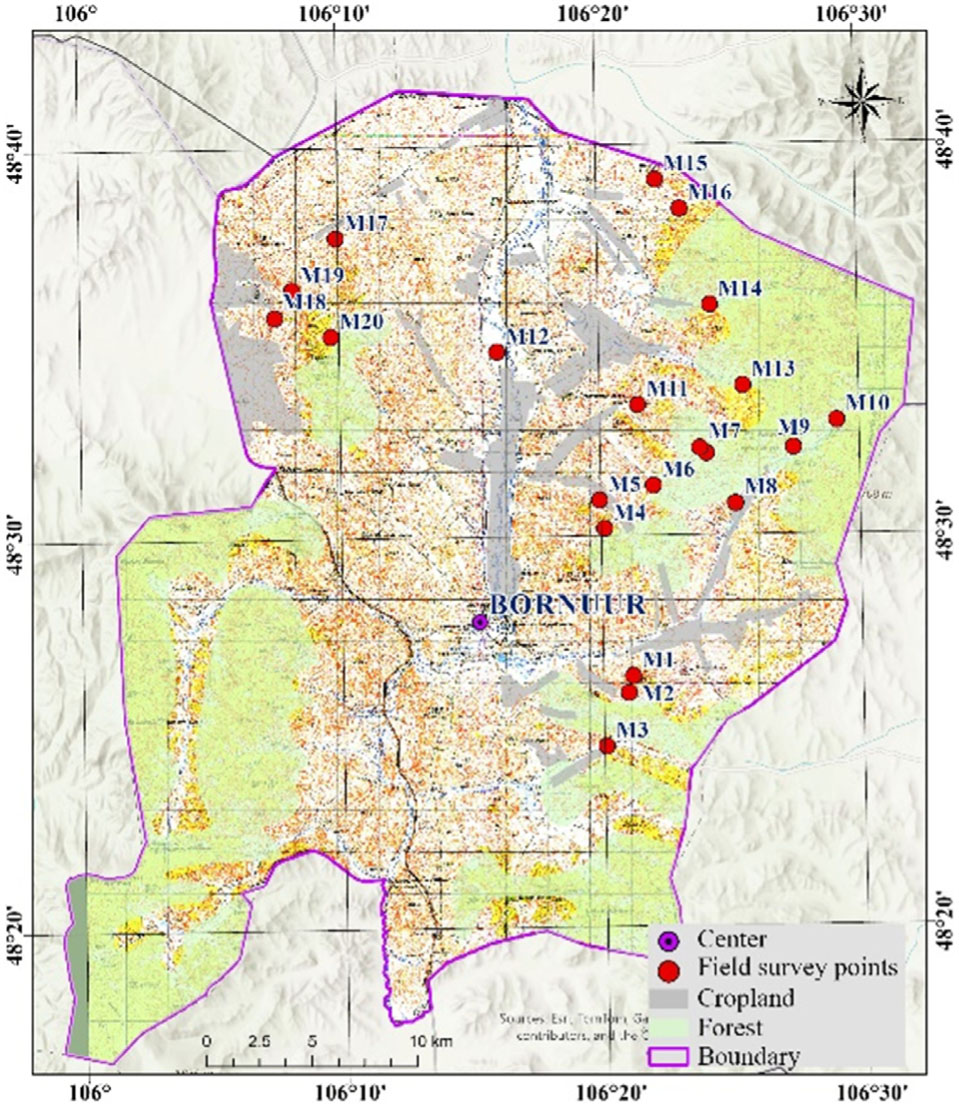
Fig. 3.
Field work points location
Source: own elaboration.
The lower ecotones of mixed larch – pine – birch – poplar forests in Bornuur sub-province support diverse hayfield vegetation types. These include various combinations of forb, grass, wormwood, and legume communities (M1–M11, M13–M20), reflecting high compositional heterogeneity across sites. In contrast, hayfields in the Boroo River valley are mainly dominated by grass species (M12), indicating a simpler vegetation structure (Table 1).
Table 1.
Summary of hayfield yield and forage quality (Bornuur)
| Variable | Min | Max | Mean (approx.) |
|---|---|---|---|
| Area (ha) | 10.3 | 6 000 | – |
| Yield (g/m2) | 54.1 | 132.9 | 93 |
| Moisture (%) | 4.92 | 7.69 | 5.9 |
| Dry matter (%) | 92.31 | 95.08 | 94.1 |
| Crude protein (%) | 9.12 | 16.56 | 11.9 |
| Fibre (%) | 22.8 | 36.96 | 30.1 |
| Digestibility (%) | 55.66 | 68.59 | 61.7 |
| Energy (MJ) | 8.02 | 9.87 | 8.8 |
[i] Source: own elaboration. Across all sampling sites, the mean forage yield was 9.34 c/ha (SD = 2.52), indicating moderate spatial variability. Nutritional quality exhibited a mean value of 8.80 (SD = 0.55) with low dispersion and near-normal distribution, suggesting relatively stable forage quality conditions across the study area.
Following Gao et al. (2015), hayfields were classified into high- (>12 c/ha), medium- (9–11 c/ha), and low-yield (<8 c/ha) systems, with community composition varying accordingly (Table 1).
Terrain Variables Analysis Results
Topographic parameters (elevation, slope, and aspect) for the Bornuur sub-province were derived from the ALOS PALSAR DEM (12.5 m resolution) (Fig. 4), and descriptive statistics were calculated from 20 field sampling points (Table 2).
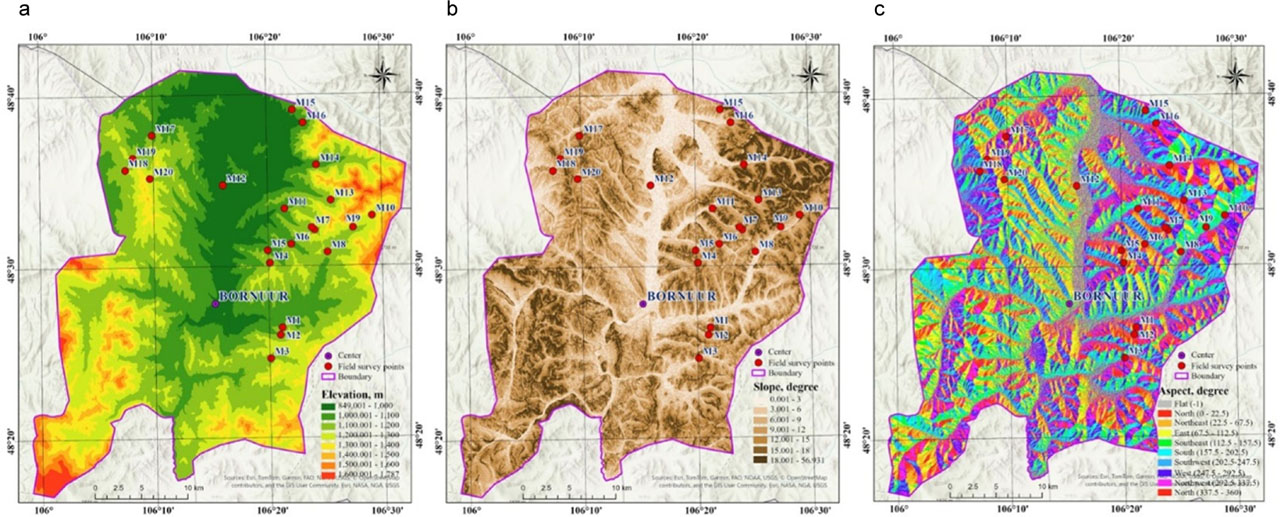
Fig. 4.
Land surface factors map of Bornuur sub-province. a – elevation, b – slope, c – aspect
Source: own elaboration.
Table 2.
Descriptive statistical results of Land surface factors
| Land surface factor | Mean | Std | Var | Median | Skewness | Kurtosis | Q25 | Q75 |
|---|---|---|---|---|---|---|---|---|
| Elevation | 1 114.7 | 84.1 | 7 060.9 | 1133.0 | –0.6 | 3.3 | 1 050.8 | 1 159.5 |
| Aspect | 166.6 | 118.6 | 14 076.4 | 160.2 | 0.1 | 1.8 | 58.3 | 250.1 |
| Slope | 7.1 | 2.4 | 5.5 | 6.9 | –0.2 | 2.9 | 5.7 | 8.7 |
Topographic parameters derived from ALOS PALSAR DEM are summarised in Table 2.
Table 3.
Descriptive statistical results of vegetation indices
| Indices | Mean | Std | Var | Median | Skewness | Kurtosis | Q25 | Q75 |
|---|---|---|---|---|---|---|---|---|
| NDVI | 0.702038 | 0.083245 | 0.006930 | 0.723672 | –0.071365 | 2.045454 | 0.642460 | 0.756097 |
| NDWI | –0.538684 | 0.026957 | 0.000727 | –0.549065 | 1.081511 | 3.079622 | –0.554977 | –0.531618 |
| SAVI | 0.940731 | 0.120926 | 0.014623 | 0.986801 | –1.529100 | 4.264492 | 0.929660 | 1.006785 |
| EVI | 0.505570 | 0.088888 | 0.007901 | 0.491353 | –0.698589 | 4.182447 | 0.460148 | 0.579817 |
Aspect showed a moderate negative correlation with yield (r = −0.44, p = 0.051), approaching but not reaching statistical significance at the α = 0.05 level. This suggests a potential microclimatic influence, where southfacing slopes may experience greater water stress due to higher solar radiation (Liu et al., 2012).
Vegetation Indices Results
Vegetation indices were derived from cloud-free Sentinel-2 imagery (August 2020) for Bornuur sub-province, and descriptive statistics were calculated for 20 field sites (Fig. 5).
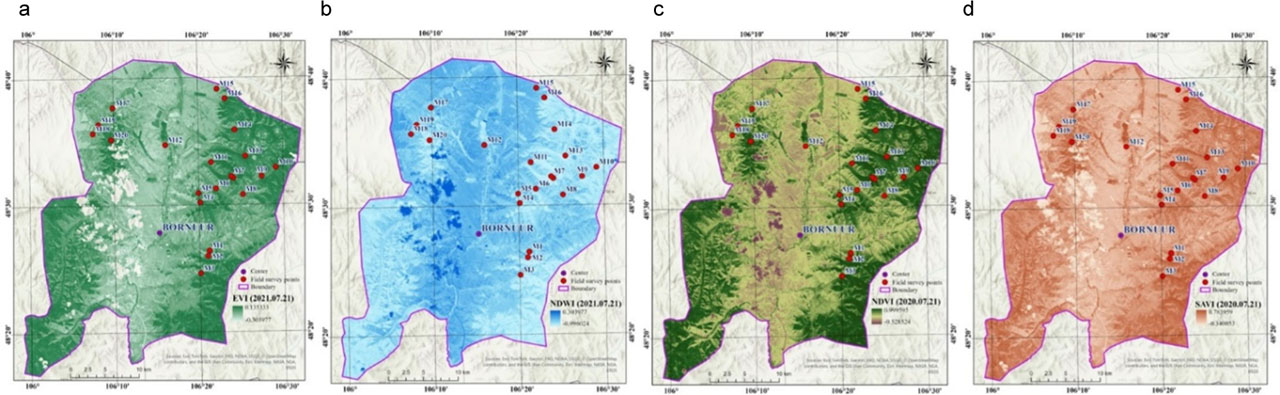
Fig. 5.
Vegetation indices map of Bornuur sub-province. a – EVI, b – NDWI, c – NDVI, d – SAVI
Source: own elaboration.
Notably, the NDWI showed very low spatial variability across the 20 sampling sites (SD = 0.027, coefficient of variation = 5.0%), indicating uniformly dry surface conditions during the satellite overpass. This low variance limits the discriminatory power of the NDWI for explaining yield differences among sites.
Relationship between indices and yield, nutrition quality
Vegetation indices derived from cloud-free Sentinel-2 imagery (August 2020) were analysed across 20 field sites in Bornuur sub-province (Fig. 6).
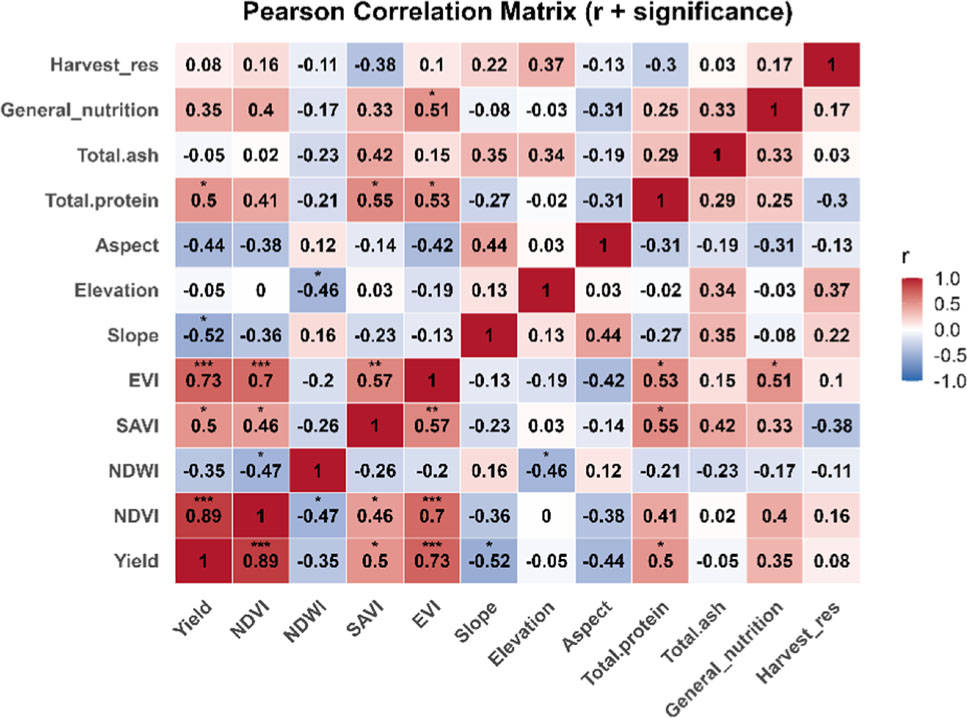
Fig. 6.
Correlation matrix of variables *p < 0.05, **p < 0.01, ***p < 0.001. Values without asterisks are not statistically significant
Source: own elaboration.
Linear regression analysis assessing the relationship between forage yield and vegetation indices, along with surface environmental variables, demonstrated strong predictive performance for the NDVI and EVI (Fig. 7–8). The coefficient of determination (R2) was 0.78 for NDVI and 0.58 for EVI, indicating substantial explanatory power in modelling yield variability. These results highlight the effectiveness of satellite-derived NDVI and EVI as reliable proxies for estimating forage crop productivity, supporting their application in precision agriculture and data-driven land management strategies.
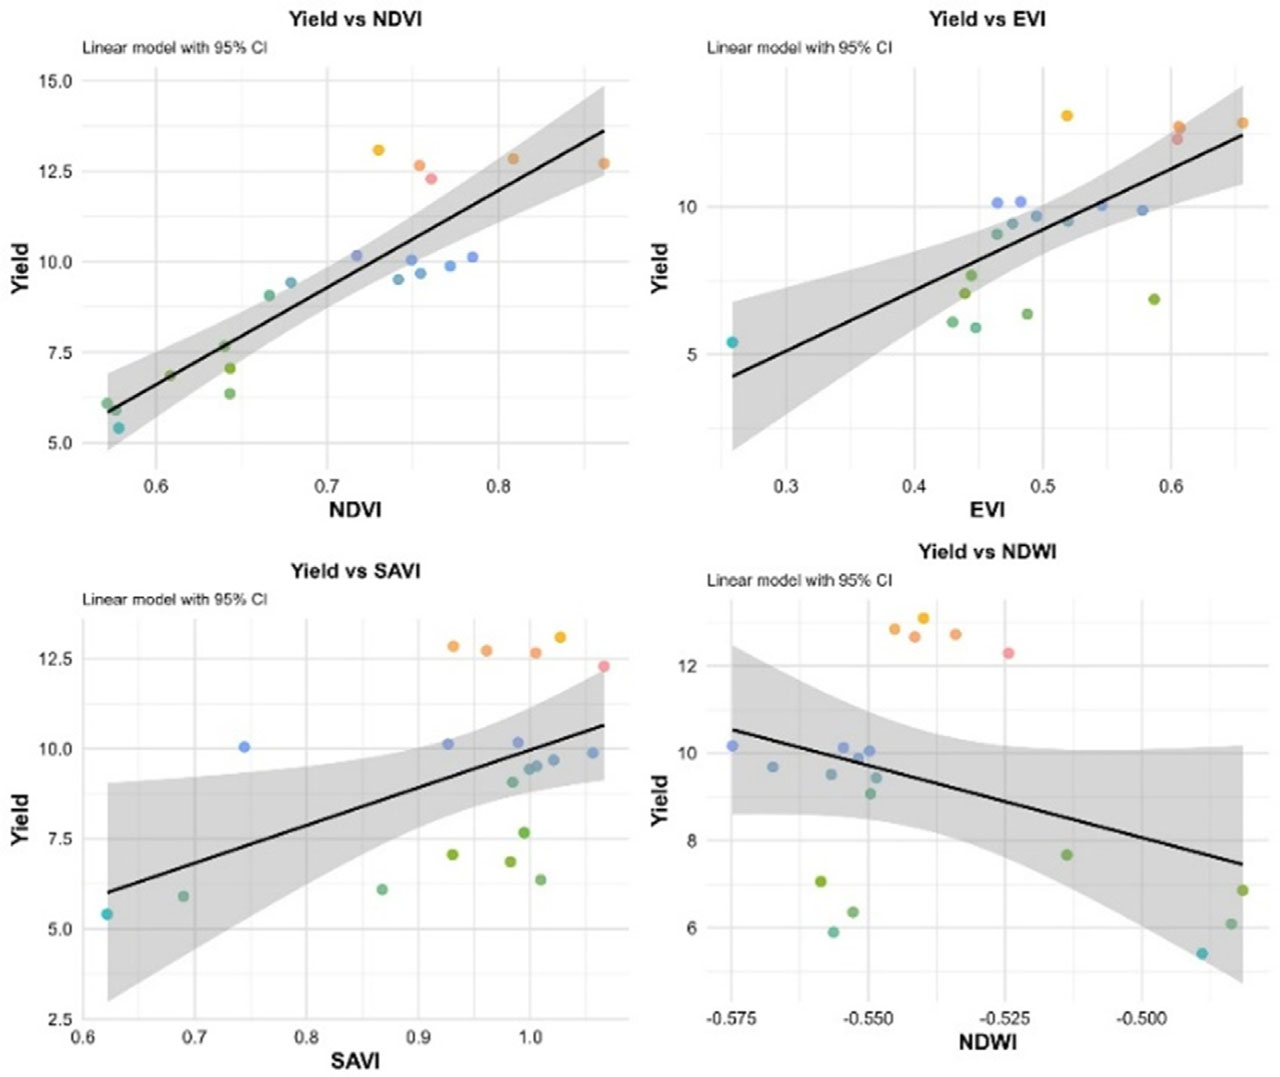
Fig. 7.
Linear regression plots of forage yield versus vegetation indices (NDVI, EVI, SAVI, NDWI)
Source: own elaboration.
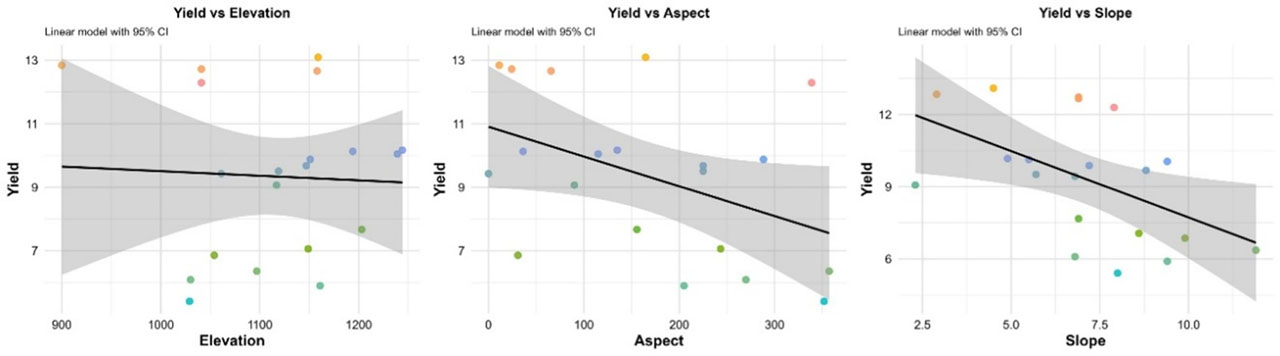
Fig. 8.
Linear regression analysis: Yield and land surface factors
Source: own elaboration.
Multivariate Model Comparison
To address the combined effect of vegetation indices and terrain variables on predicting forage yield (Research Question 3), we compared two models: a FULL model incorporating all predictors (NDVI, EVI, SAVI, NDWI, elevation, slope, aspect, total protein, general nutrition, total ash, harvest residue) and a LASSO-regularised model for variable selection. Model performance was evaluated using 5-fold cross-validation.
The FULL model achieved an R2 of 0.879, RMSE of 0.853, and MAE of 0.653 (Table 4). The LASSO model showed comparable performance (R2 = 0.869, RMSE = 0.889, MAE = 0.677), indicating that the full set of predictors does not substantially overfit despite the limited sample size (n = 20).
Variable importance analysis (Table 5) revealed that the NDVI had the strongest positive effect on yield prediction (estimate = 18.83, p = 0.022), confirming its dominant role. The EVI and NDWI showed moderate positive effects but were not statistically significant at α = 0.05. Slope exhibited a negative but non-significant effect (estimate = −0.289, p = 0.266), while terrain variables (elevation, aspect) and forage quality metrics (protein, general nutrition) showed negligible contributions.
Table 5.
Variable importance estimates from multivariate analysis
| Variable | Estimate | Std. error | p-value | 95% CI |
|---|---|---|---|---|
| NDVI | 18.827 | 6.659 | 0.022* | (3.470, 34.184) |
| EVI | 7.855 | 8.227 | 0.368 | (–11.115, 26.826) |
| NDWI | 7.797 | 16.349 | 0.646 | (–29.905, 45.499) |
| Slope | –0.289 | 0.242 | 0.266 | (–0.846, 0.268) |
SHAP (SHapley Additive exPlanations) analysis further confirmed that the NDVI made the greatest absolute contribution to yield predictions (mean SHAP = 1.567), followed by EVI (0.698) and slope (0.680) (Table 6). All other variables contributed minimally (< 0.25).
DISCUSSION AND CONCLUSIONS
This study examined relationships between vegetation indices, topographic variables, and forage productivity in Mongolia’s semiarid rangelands using field data (n=20) and Sentinel2A/ALOS PALSAR imagery.
Firstly, NDVI showed the strongest correlation with yield (r = 0.89, R2 = 0.78), followed by EVI (r = 0.73, R2 = 0.58), confirming their effectiveness as reliable productivity indicators (Huete, 1988; Rouse et al., 1974). NDWI exhibited a weak, nonsignificant negative correlation (r = −0.35, p = 0.131). However, NDWI values showed very low spatial variability (SD = 0.027), limiting its discriminatory power, the weak correlation may partly reflect noise rather than a genuine ecological signal (Yoshihara et al., 2023; Gao, 1996).
Secondly, topographic effects were weaker: slope had a moderately negative influence (r = −0.52, p = 0.066), while elevation (r = −0.05) and aspect (r = −0.44, p = 0.051) showed nonsignificant effects, indicating that terrain is secondary to vegetation and climatic drivers (Fernandez-Gimenez, 2000; Hou et al., 2014; Liu et al., 2012).
Thirdly, multivariate analysis confirmed the NDVI as the dominant predictor. The NDVIonly model achieved R2 = 0.78, while the FULL model (11 predictors) achieved marginal improvement (R2 = 0.879). LASSO retained NDVI as the key predictor (estimate = 18.83, p = 0.022), and SHAP analysis confirmed its primary contribution (mean SHAP = 1.567 vs. 0.698 for EVI and 0.680 for slope). Thus, vegetation indices alone are sufficient for operational yield estimation.
Implications: The NDVI and EVI are suitable for operational monitoring, yield forecasting, and adaptive rangeland management in datascarce environments (Booth and Tueller, 2003; Gao et al., 2015). Integrating field measurements with satellite indices provides a scalable framework for assessing forage productivity in Mongolia.
Limitations: Firstly, the small sample size (n = 20) with 11 predictors (observation to predictor ratio < 2:1) is well below recommended thresholds (10:1–20:1). The results should therefore be interpreted as exploratory despite cross validation and LASSO. Secondly, NDWI interpretation was constrained by low spatial variability (SD = 0.027). Thirdly, because the single temporal snapshot (August 2020) cannot account for interannual variability, findings are specific to the 2020 growing season and require multiyear validation (Hilker et al., 2014; Nandintsetseg et al., 2024).
Conclusion: NDVI is the most effective single predictor for forage yield estimation. The marginal improvement from adding terrain variables confirms that operational monitoring systems can rely primarily on optical remote sensing to support sustainable rangeland management and rural development policy in Mongolia.