
INTRODUCTION
The search for a balance between economic growth and environmental improvement is particularly evident at the intersection of SDG 8 (Decent Work and Economic Growth) and SDG 13 (Climate Action), which positions climate action at the heart of national policy and planning processes. The 2030 Agenda for Sustainable Development (United Nations, 2015), which situates climate action within national policy and planning processes, approaches the relationship between economic growth and emissions through a decoupling lens, thereby enabling climate and economic objectives to be discussed within a single analytical framework. To simultaneously address climate and economic objectives, the economic development literature is focusing increasingly on the notion of carbon decoupling in analysing the interplay between economic growth and the environment.
The relationship between economic growth and greenhouse gas emissions in the agricultural sector exhibits a structure that can vary and evolve over time in the European Union’s transition economies. The dynamic nature of this relationship, together with the surrounding policy framework, reveals clear differences in how countries have navigated the shift from the socialist period to a market economy. In this respect, the radical political and economic transformation that has taken place since the early 1990s has reshaped agricultural production (Gorton et al., 2009; Swinnen and Vranken, 2009). In particular, the CAP reforms from the 2000s onwards embed a policy vision centred on agricultural sustainability, aiming to support improvements in environmental performance (Pe’er et al., 2019). Alongside the European Green Deal and the Farm to Fork Strategy, targets aim to reduce agricultural greenhouse gas emissions, decrease chemical fertiliser use by 20%, and increase the share of agricultural land under organic farming to 25% by 2030. Within the framework of the European Union’s environmental targets, efforts have focused on reducing agricultural greenhouse gas emissions by conserving biodiversity and improving soil quality. In line with these objectives, eco-schemes introduced under the CAP 2023–2027 framework are mandatory, and require Member States to allocate at least 25% of their direct payment budgets to these schemes (EC, 2023a). Designed to promote environmentally friendly farming practices, eco-schemes provide additional financial support to farmers for measures such as carbon farming, improved food management, precision agriculture, and the transition to organic production (Rosa et al., 2025). The growing share of farmers’ direct payments that is tied to environmental and climate performance has marked a major shift in the Union’s agricultural policy architecture and has also prompted debate. Farmer protests occurring throughout the EU in 2023–2024, especially in France, Germany, Poland, and the Netherlands were largely linked to newly implemented environmental regulations that had escalated production costs and, according to farmers, compromised competitiveness. In response, the European Commission withdrew certain proposals and updated elements of its policy approach (Vogeler, 2022; Matthews, 2024; Żuk, 2025; Läpple, 2026). Meeting these targets poses substantial challenges, particularly for transition economies in Central and Eastern Europe, and their positive outcomes remained contested.
The heterogeneous differentiation of transition economies, driven by factors such as rapid modernisation, technological innovation, structural constraints, and limited investment capacity, directly affects growth-emission decoupling performance in agriculture. Although the Tapio (2005) elasticity approach is widely used to capture the dynamic relationship between economic growth and environmental performance and serves as an important tool for assessing periodic policy effectiveness and output–emission variation, studies that examine Central and Eastern European transition economies through the lens of Tapio elasticity remain limited. In this context, Tapio decoupling elasticity is preferred for analysing transition economies because the growth-emission relationship displays a structure that can change over time and across sub-periods. Moreover, the method enables the systematic classification of distinct outcome regimes as well as links between growth and emissions. Accordingly, this study aims to map a comparable decoupling profile across transition economies, with a specific focus on the agricultural sector. Within this framework, it seeks to empirically analyse cross-country and intertemporal differences in decoupling performance by examining the dynamic relationship between agricultural value added and greenhouse gas emissions in Central and Eastern European transition economies (Bulgaria, Czechia, Estonia, Hungary, Latvia, Lithuania, Poland, Romania, Slovakia, and Slovenia) over the period 1998–2023, using the Tapio elasticity approach. In doing so, the study aims to answer the following questions:
RQ1: To what extent did the relationship between agricultural growth and greenhouse gas emissions in Central and Eastern European transition economies exhibit patterns of absolute, relative, or negative divergence during the 1998–2023 period, and how did these patterns differ across countries and sub-periods?
RQ2: How have the EU accession process, Common Agricultural Policy reforms, and cyclical crises (the 2008 financial crisis and the post-COVID-19 period) influenced the direction and stability of Tapio elasticity coefficients in the agricultural sector of transition economies?
RQ3: Which structural factors explain the heterogeneity in divergence performance observed among transition economies?
This study contributes to the literature by examining divergence periods in the agricultural sector of ten Central and Eastern European transition economies between 1998 and 2023 using the Tapio elasticity approach. It compares inter-country performance by dividing the analysis into policy-oriented sub-periods and aims to fill existing knowledge gaps by investigating the temporal variability of agricultural growth–emission trajectories. The subsequent sections are structured as follows: a literature review is presented, the materials and methodology are explained, the empirical findings are reported, the findings are discussed, and conclusions are provided.
LITERATURE REVIEW
The literature on economic development examines the correlation between economic growth and the environment via the concept of carbon decoupling, which refers to the diminishing of the connection between economic growth and increasing environmental indicators (Tapio, 2005). In this framework, decoupling occurs in two main forms: relative decoupling and absolute decoupling. Relative decoupling occurs when economic growth and greenhouse gas emissions increase simultaneously, yet emissions rise more slowly than economic output. By contrast, absolute decoupling occurs when total emissions decline in absolute terms while economic growth continues. This pattern signals a substantial structural separation between economic growth and environmental pressure (Cerkini et al., 2025).
One of the main reasons for examining the relationship between economic growth and greenhouse gas emissions in the agricultural sector is that agricultural emissions have not been limited to energy-related CO2. Emissions of CH4 (from enteric fermentation and manure management) and N2O (from soils and fertilisation) also constitute a substantial share of agriculture’s total greenhouse gas emissions. These emission patterns are closely tied to the sector’s production structure and intensification dynamics. For this reason, decomposition analyses in agriculture are conducted without focusing solely on CO2. Agriculture is also considered one of the principal sources of N2O emissions. Accordingly, the relationship between agricultural growth and greenhouse gas emissions should undergo a multidimensional assessment that incorporates soil–fertiliser–livestock dynamics (Han et al., 2019; Andrei et al., 2022; Menegat et al., 2022; Chataut et al., 2023).
The instability of the growth–emission relationship, often moving in tandem, is among the issues discussed in the literature. Scholars argue that the causal links between economic growth, energy consumption and CO2 emissions may have changed over time and may differ as a result of structural transformations and policy reforms (Shahbaz et al., 2016). Empirical research employing Tapio’s decomposition framework, which is shaped by structural change as well as by economic and environmental policies affecting the growth–greenhouse gas nexus, has also shown that this relationship has shifted across periods into different decoupling regimes. Papież et al. (2021), who examined EU countries over the 1996–2017 period using the Tapio framework, jointly assessed production-based and consumption-based emission measures, highlighting how decoupling patterns have varied across countries and over time. This differentiation is also linked to crises and structural breaks. In a 2021 study, Naqvi observed that a substantial share of emission reductions in EU NUTS2 regions is concentrated in the period prior to 2008, while weak decoupling or re-coupling patterns emerged after 2008. Although absolute decoupling between growth and emissions is observed in some countries and periods, Vadén et al. (2020), who reviewed decoupling studies published between 1990 and 2019, concluded that limited evidence exists of rapid, comprehensive, and long-term decoupling sufficient for ecological sustainability and sustainable development.
Research focusing on the decoupling of growth and CO2 emissions in Central and Eastern European EU member states indicates that decoupling has varied both over time and across countries. The transition process has significantly influenced emission trajectories. For transition economies, the findings suggests that decoupling requires a careful sub-period analysis and an assessment of decoupling regimes alongside time effects. In particular, scholars suggest that sharp emission declines occurred during specific intervals following the collapse of the Soviet Union, coinciding with substantial structural transformation. A study examining the relationship between economic growth and CO2 emissions in EU Member States in Central and Eastern Europe since 1990 identified a divergence, with GDP per capita increasing while CO2 emissions per capita decreased. The study concluded that absolute or relative decoupling is observed in most countries (Ziemblińska et al., 2025). However, although these trends produced an apparent decoupling, the durability and sustainability of such patterns remain contested (Lamb et al., 2022).
Decomposition analyses of the agricultural sector’s growth and emissions relationship show the sector’s and countries’ heterogeneity. Robaina-Alves and Moutinho (2014) analysed energy-related GHG emissions in European agriculture over the period 1995–2008. Their findings indicate that emission changes differed across countries due to variations in energy intensity/efficiency, structural composition, and scale effects, and that agricultural emission performance did not follow a uniform trajectory. This evidence further reinforces the importance of intra-sectoral components when decomposing emission dynamics in agriculture. Cautisanu and Hatmanu (2023) assessed decoupling between GDP and CO2 and HFC emissions in the EU27 by splitting the analysis into two sub-periods (2008–2012 and 2013–2020) and applying a Tapio-type decoupling approach at the country level. Their study reported that a considerable number of countries are classified as exhibiting negative coupling in 2008–2012, reflecting the negative growth rates observed in both output and emissions in many cases. These authors also observed that country dynamics shifted markedly between 2013 and 2020, which points to the emergence of distinct decoupling regimes. A review of the top five economic activities generating CO2 and HFC highlights the need to prioritize emission-producing sectors and activities in economic and environmental policy evaluations, rather than treating the country as a single unit. From this perspective, the observed differentiation is interpreted as potentially reflecting changes in sectoral composition and the pace of technological transformation, both of which have influenced countries’ respective contributions to greenhouse gas emissions (Cautisanu and Hatmanu, 2023).
In transition economies, the agricultural sector underwent a profound process of structural transformation following the dissolution of the Soviet Union. This involved reforms such as privatisation, the restructuring of agricultural enterprises, and changes in price regulation. Many countries’ agricultural output and input use fluctuated due to restructuring and major production structure changes (Macours and Swinnen, 2000). In the post-Soviet region, restructuring proceeds through diverse reform pathways, reflecting the coexistence of corporate (institutional) farms and family farms, as well as differing patterns of labour outflows and capital inflows (Petrick, 2021). These reform and restructuring policies have also shaped emission intensity through their effects on production mixes1, energy use, and technology choices in agriculture. Andrei et al. (2022) examined agricultural CO2, CH4, and N2O emissions in the European Union over 2008–2018 by relating them to agricultural output and by assessing short-, medium-, and long-term decoupling patterns using the Tapio decoupling index methodology. Their study additionally evaluated N2O mitigation in agriculture alongside technology and productivity performance, and identified the potential for new member countries. The findings have indicated that for transition countries, agricultural decoupling has not exhibited a unidirectional or permanent trajectory. Specifically, decoupling statuses among the new EU member states fluctuated across periods, and a period-by-period assessment shows a more adverse profile in 2013–2018 relative to 2008–2013. Gołaś (2022) investigated energy-related CO2 emissions in the Polish agricultural sector for 2000–2019. Using LMDI decomposition, the study discussed growth–CO2 decoupling in Poland from a decoupling perspective, situating the results within a broader context of policy change and structural transformation.2 The evidence suggests that energy use and the associated CO2 emissions remained relatively high in the 2000–2005 period. Following Poland’s accession to the European Union, a marked decline in energy consumption began in 2006 and persisted until 2015. However, as energy consumption increased again in 2016–2019, CO2 emissions also rose. The study also noted that this periodicity needs to be interpreted through sub-period analysis, policy breaks, and structural shifts due to the limited change in energy shares, particularly fossil fuel dominance.
Based on the studies reviewed, the growth–emission relationship in the agricultural sector of transition economies exhibits a period-dependent structure that has varied over time. In the design of European Union environmental policies, the objective is to enhance economic performance in agriculture while addressing greenhouse gas mitigation within the same policy framework. In line with this, the literature indicates that emissions and growth performance in agriculture have not followed a unidirectional or enduring trajectory.
The literature reviewed highlights three significant gaps in the focus on agricultural decoupling. Firstly, existing studies either treat the economy as a whole or rely on data from across the European Union. As a result, the agricultural sector is rarely examined as an independent unit of analysis. Secondly, cross-country comparisons covering the post-transition period, extending from the late 1990s to the European Green Deal, are absent from the literature. Existing studies either examine only the pre-EU period or address the CAP reform periods separately. Finally, studies focusing on the Tapio elasticity framework in the agricultural sector of EU transition countries, while taking sub period heterogeneity into account, remain limited. This study aims to address these three gaps by examining the annual Tapio elasticity coefficients for the agricultural sector in Bulgaria, Czechia, Estonia, Hungary, Latvia, Lithuania, Poland, Romania, Slovakia, and Slovenia over the period from 1998 to 2023, with the analysis structured by sub-periods.
MATERIALS AND METHODS
In transition economies, the agricultural sector has experienced substantial shifts in both production dynamics and greenhouse gas emissions alongside broader structural transformation processes. Against this background, the decoupling dynamics between economic growth and agricultural emissions are examined through Tapio’s (2005) elasticity-based approach. This framework, which is widely employed in the literature to quantify decoupling, assesses the responsiveness of emissions to economic growth by calculating an elasticity coefficient derived from a comparison of their respective growth rates:
- ε
decoupling elasticity
- %ΔC
percentage change in greenhouse gas (GHG) emissions
- %ΔGDP
percentage change in economic output/growth
- Δ
change between two periods (% indicates that the change is expressed in percentage terms).
In this formulation, ε represents the decoupling elasticity, and Tapio (2005) proposes interpreting the growth–emission relationship on the basis of this coefficient. Tapio elasticity therefore enables classification of the relationship between growth and emissions over time, particularly in sectors that are sensitive to structural transformation, such as agriculture in transition economies. It also provides an appropriate framework for comparing decoupling regimes that vary across sub-periods. Under this approach, elasticity is interpreted as follows (Yücel and Sevgili, 2026):
ε > 1 – emissions grow faster than GDP (negative decoupling)
0 < ε < 1 – GDP grows faster than emissions (relative decoupling)
ε < 0 – GDP grows while emissions fall (absolute/strong decoupling).
In this study, annual data on Agricultural Gross Value Added (GVA) at 2015 constant prices and agricultural greenhouse gas emissions (GHG) in thousands tonnes of CO2 equivalent for the period 1998–2023 were obtained from the EUROSTAT database for the 10 transition economies (Bulgaria, Czechia, Estonia, Hungary, Latvia, Lithuania, Poland, Romania, Slovakia, and Slovenia). Agricultural greenhouse gas emissions are calculated by aggregating GHG emissions from agriculture with GHG emissions from fuel combustion in agriculture. For the analysis, the variables are subjected to logarithmic transformation3 prior to calculation. Table 1 presents descriptive statistics for the variables, presenting them in both levels and in their log-transformed form. Based on the level values, the average agricultural gross value added (GVA) is €2,289.11 million, with a standard deviation of 2,709.05. Agricultural GVA has ranged from 124.67 to 10,785.55, and this wide dispersion, together with the comparatively large standard deviation, suggests substantial cross-country heterogeneity in the scale of agricultural production within the sample.
Table 1.
Descriptive statistics of variables
| Variables | Mean | Std. dev. | Min | Max |
|---|---|---|---|---|
| Levels | ||||
| GVA | 2,289.11 | 2,709.05 | 124.67 | 10,785.55 |
| GHG | 10,083.85 | 12,860.61 | 1,189.62 | 51,222.67 |
| Logarithmic values | ||||
| ln(GVA) | 7.0106 | 1.2451 | 4.8257 | 9.2860 |
| ln(GHG) | 8.6313 | 1.0254 | 7.0814 | 10.8439 |
The mean of greenhouse gas (GHG) emissions is equivalent to 10,083.85 thousand tons of CO2, while the standard deviation is notably high at 12,860.61. This pattern likewise indicates marked differences in agricultural emission profiles across the sampled countries: GHG emissions vary from a minimum of 1,189.62 to a maximum of 51,222.67. Following logarithmic transformation, the distributions appears to be more symmetric. The mean of ln(GVA) is 7.01 with a standard deviation of 1.25, whereas the mean of ln(GHG) is 8.63, with a standard deviation of 1.03.
The decline in the ratio of the standard deviation to the mean after transformation is interpreted as evidence that the log specification attenuates the influence of extreme values and contributes to a more normalized distribution.
RESULTS
In transition economies, trends in agricultural output (GVA) and GHG emissions vary considerably from country to country. This divergence is particularly evident during periods of structural transformation, EU enlargement, policy harmonization, and market integration. Similarly, periodic emission changes, including sharp increases and decreases can be interpreted as the combined outcome of sub-period shocks and broader structural reorganizations. Table 24 provides a comparative overview of the relative (%) changes in agricultural GVA and GHG emissions across sub-periods5 for transition economies between 1998 and 2023. The table shows that agricultural output (GVA) and greenhouse gas (GHG) emissions in transition economies do not follow a single linear long-term trend and diverge substantially across countries. The output–emission relationship for 1998–2023 can be divided into three clusters. In the first cluster, GVA increased while GHG decreased in countries such as Czechia (+46.1; −12.3), Lithuania (+204.9; −13.7), Poland (+82.3; −11.9), and Slovenia (+31.5; −7.3). This performance is consistent with the downward trend in agriculture-related emissions across the EU between 2005 and 2023, while also showing that these countries have undergone a transformation more closely aligned with EU targets. It is also evident that emission dynamics in agriculture developed further in these countries, as output growth was not directly reflected in emission growth. A second cluster emerged in countries such as Latvia (+88.8; +20.0) and Bulgaria (+8.7; +8.7), where both output and emissions increased. In the third group, countries such as Romania (−12.3; −16.5) and Slovakia (−43.4; −23.0) show decreases in both output and emissions. This pattern indicates that emission reductions in some transition economies may be interpreted as a result of scale contraction and restructuring rather than increased efficiency. In the case of Estonia (−38.3; +11.6), which falls outside these classifications, emissions remained positive while output declined over the long term. Similarly, the heterogeneous and regionally differentiated nature of national policies indicates that emissions can vary depending on the composition of production and the structure of inputs. When the sub-periods in the table are considered, the sensitivity of agriculture in transition economies to seasonality and shocks becomes more clearly visible. In Bulgaria, the sharp decline in 2003–2007 (−45.0), following the strong increase in GVA (+45.5) in 1998–2002, is consistent with findings that the price/input regime and farm restructuring in post-transition agriculture can generate high volatility (Macours and Swinnen, 2000; Petrick, 2021). A similar situation is observed in Slovakia, with a very sharp contraction in GVA (−40.6) during 2009–2013. The marked increase in GHG emissions in many countries during 2009–2013 (Bulgaria +13.5, Estonia +13.0, Hungary +12.4, Latvia +9.3, Czechia +8.5) suggests a post-crisis recovery period. It is possible that the emission–output relationship weakened at the regional level during this period and may have started to move in tandem again. During 2019–2023, the strong increase in Poland’s GVA (+24.9) was accompanied by only a limited increase in GHG (+1.1), while GHG remained in decline through 1998–2023 (−11.9), suggesting that productivity–technology and production-mix channels may be able to suppress emissions (Robaina-Alves and Moutinho, 2014). Similarly, the sharp decline in GHG (−13.8) in Hungary during the same period indicates that policy, technology and production-mix changes can produce substantial and positive responses in emissions (Andrei et al., 2022).
Table 2.
Relative (%) changes in agricultural GVA and GHG emissions across sub-periods in transition economies (1998–2023)
| Country | Variable | 1998–2002 | 2003–2007 | 2009–2013 | 2014–2018 | 2019–2023 | 1998–2023 |
|---|---|---|---|---|---|---|---|
| Bulgaria | GVA | 45,5 | −45 | −8,5 | 1,8 | −11,5 | 8,7 |
| GHG | −1,3 | −5,1 | 13,5 | 0,1 | −1,9 | 8,7 | |
| Czechia | GVA | −8,3 | 5,6 | −11,9 | −9,5 | 19,3 | 46,1 |
| GHG | 4,7 | 11,6 | 8,5 | −6,7 | −2,3 | −12,3 | |
| Estonia | GVA | 13,9 | 12,9 | −10,5 | −49,2 | −52,7 | −38,3 |
| GHG | −8,6 | 5 | 13 | −3,6 | −6,9 | 11,6 | |
| Hungary | GVA | −21,1 | 2,9 | 0,9 | 1,8 | 8,2 | 57,6 |
| GHG | −1 | −6,1 | 12,4 | 8,9 | −13,8 | −6,7 | |
| Latvia | GVA | 6,8 | 12,8 | −12,4 | −1,5 | −25,2 | 88,8 |
| GHG | −3,3 | 4,2 | 9,3 | 2,2 | −3,5 | 20 | |
| Lithuania | GVA | −6,8 | 43,3 | 33,3 | −19,7 | 0,1 | 204,9 |
| GHG | −14,4 | 5,3 | 0,8 | −4,7 | −6,2 | −13,7 | |
| Poland | GVA | 1,1 | 19,9 | 6,9 | 3,6 | 24,9 | 82,3 |
| GHG | −12,4 | −1,2 | 0,1 | 6,5 | 1,1 | −11,9 | |
| Romania | GVA | 0,9 | −19,4 | 3,4 | 10,9 | −26,1 | −12,3 |
| GHG | −11,6 | 1,5 | −6,6 | 7,2 | −5,4 | −16,5 | |
| Slovakia | GVA | −18,7 | 12,1 | −40,6 | −15,1 | 5,8 | −43,4 |
| GHG | 2,3 | −9,6 | 2,5 | −12,4 | −3,9 | −23 | |
| Slovenia | GVA | 21,1 | 24,1 | −6,2 | 44,6 | −12,3 | 31,5 |
| GHG | 7 | −0,1 | −4,3 | 0,4 | −4,7 | −7,3 |
Figure 1 shows the percentage change in agricultural gross value added (GVA) and greenhouse gas (GHG) emissions in transition economies over the period 1998–2023, presented as a bubble chart. The figure highlights differing growth–emission relationships by positioning each country’s decoupling performance along two dimensions. Poland and the Czechia, located in the lower-right region of the chart, stand out as countries that achieved positive growth in agricultural value added in 2023 relative to 1998, while managing to reduce greenhouse gas emissions. Hungary and Slovenia, positioned close to the origin, shows that changes in GVA and GHG remained limited. Latvia and Estonia, located in the upper-left region, are countries that exhibited an increase in greenhouse gas emissions, while recording positive but limited growth in agricultural value added. Bulgaria is the only transition economy in this group where agricultural output growth and greenhouse gas emissions increased at the same rate. Slovakia and Romania, located in the lower-left region, experienced declines in both agricultural value added and emissions. Lithuania, positioned on the far right of the chart, displayed very high growth in agricultural value added (204%), while demonstrating a remarkable performance in reducing emissions.
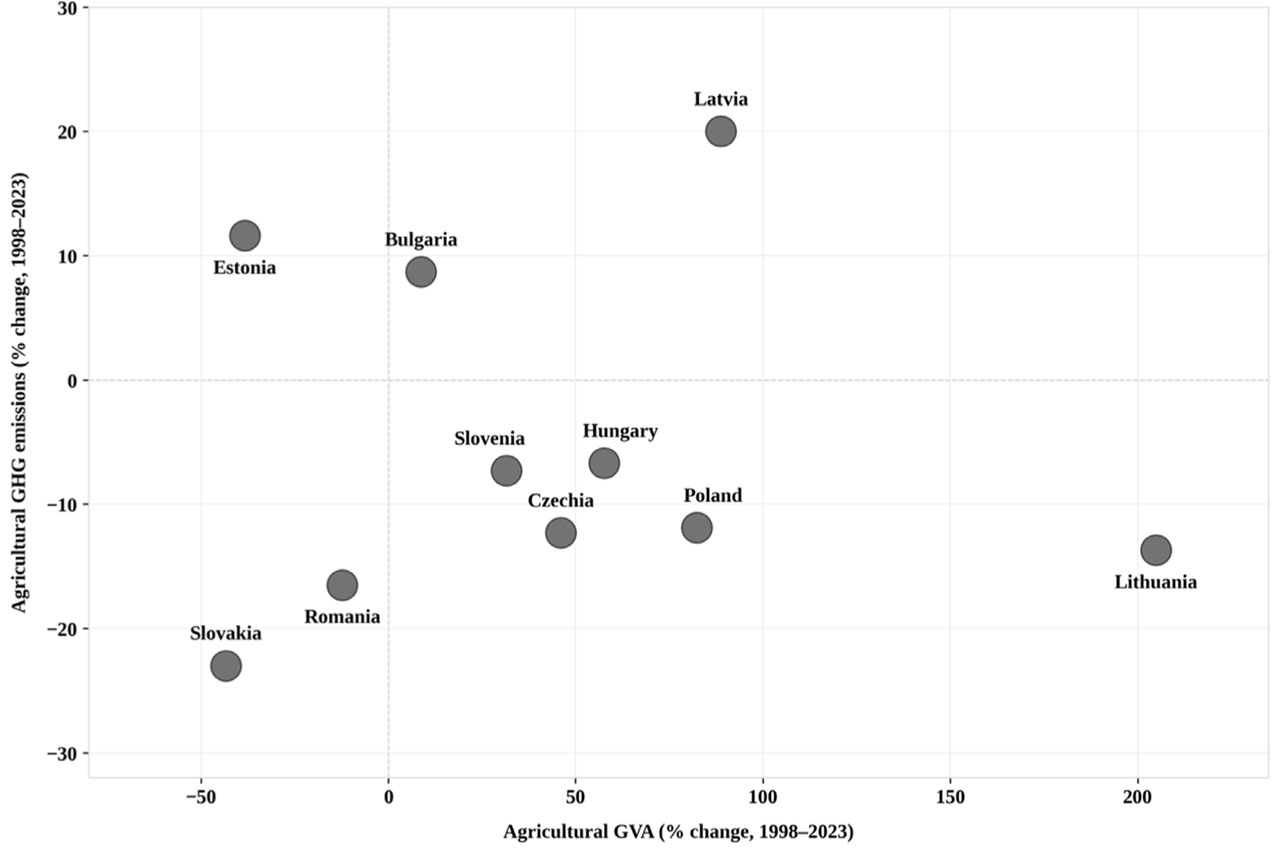
Fig. 1.
Relative (%) changes in agricultural GVA and GHG emissions in the transition economies (1998–2023)
Source: author’s calculations based on data.
Figure 2 has presented the 4-year moving average6 of agricultural Tapio elasticity in five transition economies (Bulgaria, Czechia, Hungary, Poland and Romania)7. The dashed horizontal lines in the graph indicate the critical thresholds separating decoupling regimes: ε < 0 (absolute/strong decoupling), 0 < ε < 1 (relative decoupling), and ε > 1 (negative decoupling/expansionary coupling). Poland (dark blue line) exhibited the most stable and sustainable decoupling performance over the period under review. Throughout 2002–2023, the elasticity coefficient remained consistently below zero (ε < 0), fluctuating between −1.5 and 0. This pattern indicates that Poland managed to achieve growth in agricultural value added while also reducing greenhouse gas emissions (absolute decoupling). The positive developments in Czechia, particularly in the post-EU accession period after 2004, are explained by the effective implementation of CAP reforms, a focus on productivity-enhancing agricultural policies, farm modernization, and the adoption of precision agriculture technologies. Czechia (red line) experienced relatively low elasticity values between 2002 and 2009, but entered a region of negative divergence (ε ≈ 2.0–2.5) following a sharp increase between 2009 and 2013. This pattern is particularly evident during the post-2008 global financial crisis recovery process, when emissions increased faster than economic growth (Naqvi, 2021). After 2013, elasticity fell back towards zero and registered slightly negative values between 2018 and 2023. The U-shaped trajectory observed suggests that emission intensity may temporarily increase during post-crisis recovery periods, while economic and environmental policies, together with technological and efficiency improvements, show that this dynamic can be brought back under control (Cautisanu and Hatmanu, 2023). Hungary (purple line) exhibited the highest volatility over the period examined. Between 2012 and 2016, Hungary’s elasticity coefficient increased dramatically, exceeding 4.0, and reaching a peak associated with negative divergence. This period is attributed to changes in the production structure of Hungarian agriculture, expansion in the livestock sector, and increased fertiliser use (Andrei et al., 2022). After 2016, a sharp decline was observed, with elasticity falling to near zero in the 2020s. While these pronounced fluctuations vary across contexts, they can also be interpreted as an indication of policy inconsistencies and structural vulnerabilities. Bulgaria (light blue line) showed strong divergence performance (ε ≈ −1.5 to −2.5) between 2005 and 2008, but moved into the negative divergence zone with a sharp change after 2008. In Bulgaria, between 2010 and 2015, elasticity remained consistently above 1, with emissions outpacing economic growth. Despite the improvement observed after 2018, high inter-period volatility was still evident in Bulgaria. The main reasons are linked to delays in the absorption and use of EU funds and the slow pace of structural reforms, while disruptions in the agricultural modernization process also stand out. Romania (orange line) exhibited relative decoupling (weak decoupling) between 2002 and 2009, with elasticity values fluctuating between 0 and 1. Romania entered the negative decoupling zone (ε ≈ 2.0) between 2009 and 2013, but returned to the relative decoupling zone after 2015. Between 2020 and 2023, elasticity fell below zero, approaching absolute decoupling.
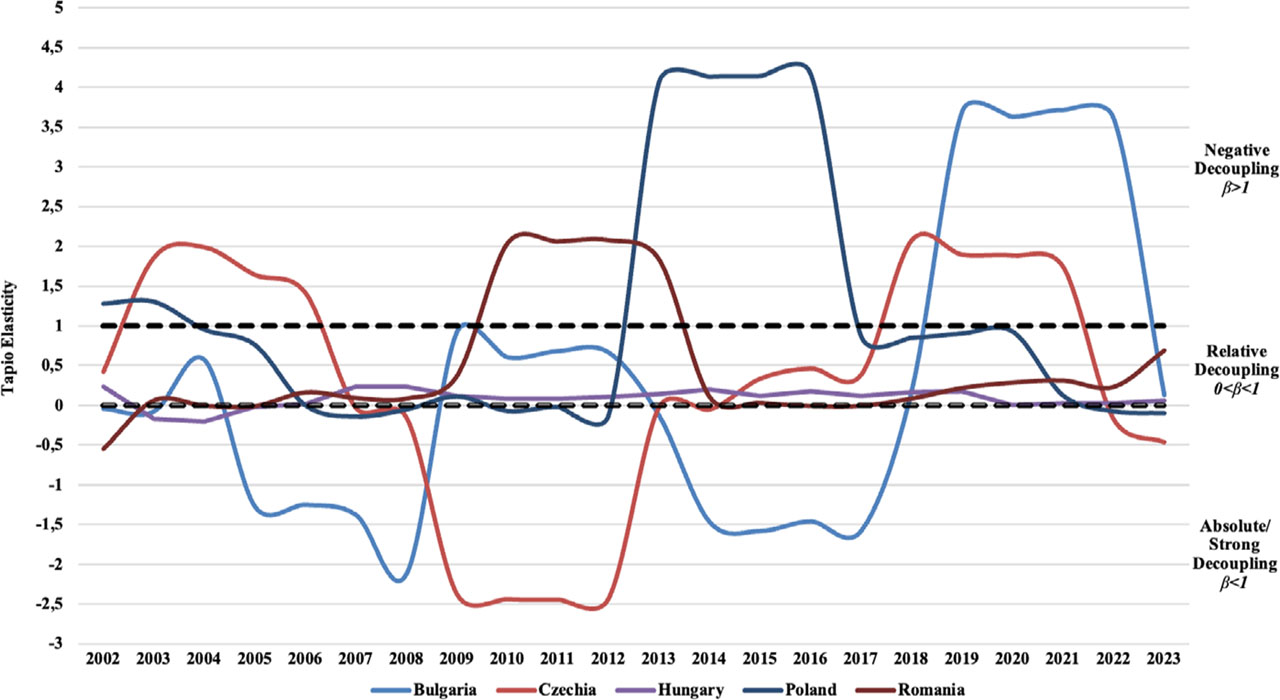
Fig. 2.
Tapio elasticity in the agricultural sectors of the transition economies (Bulgaria, Czechia, Hungary, Poland and Romania): 4-year moving average (2002–2023)
Source: author’s calculations based on data.
Figure 3 presents the 4-year moving average8 of agricultural Tapio elasticity in five transition economies (Estonia, Latvia, Lithuania, Slovakia, and Slovenia). Estonia (light green line) exhibited the highest volatility and the most pronounced regime shifts among all countries examined. During 2002–2006, the elasticity coefficient rose rapidly, reaching approximately 6.0 in 2006, which indicates an extreme point of negative divergence. Over this period, emissions in Estonian agriculture outpaced economic growth. After 2006, elasticity declined sharply, falling to near-zero values during 2008–2010. However, after 2010, elasticity increased again and remained in the negative divergence zone, fluctuating around 1.5 during 2012–2014. After 2015, the values retreated into the relative decoupling range (0 < ε < 1) and stabilized at near-zero levels during 2020–2023. Latvia (blue line) followed a relatively more stable trajectory than other Baltic countries, but did not achieve sustained decoupling. Between 2002 and 2007, elasticity fluctuated between 0 and 1, indicating weak/relative decoupling. During 2007–2010, values moved closer to zero, providing short-term signals of absolute decoupling, but elasticity increased again after 2010. In Latvia, elasticity ranged between 0.5 and 1.0 from 2012 to 2015. After 2015, values generally hovered around zero, indicating that Latvia is partially successful in balancing agricultural growth and emissions. The fact that elasticity fell slightly below zero during 2020–2023 suggests increased policy effectiveness. Lithuania (orange line) stand out as the country with the most successful decoupling performance within this group of five. Between 2002 and 2004, elasticity started from a very low (strongly negative) value of −2.5, and agricultural value added increased while emissions decreased sharply. This performance is attributed to higher production efficiency resulting from inefficient farms exiting the market and structural reforms implemented prior to EU accession (Douarin and Latruffe, 2011). Throughout the period from 2004 to 2023, elasticity fluctuated consistently between −0.5 and 0.5, remaining below zero in most periods in Lithuania. Slovakia (dark green line) experienced elasticity values fluctuating between 0.5 and 1.5 during 2002–2009, generally indicating relative decoupling and mild negative decoupling. Between 2008 and 2010, elasticity briefly increased to around 1.5, but entered a downward trend after 2010. From 2010 to 2015, values fluctuated in the 0.3–0.5 range, signalling relative decoupling. After 2015, elasticity in Slovakia moved closer to zero and remained consistently below zero (ε ≈ −0.2 to 0) from 2018 to 2023. Slovenia (purple line) exhibited the most stable and narrowly fluctuating elasticity profile over the period examined. From 2002 to 2023, elasticity remained within a tight band between −0.5 and +0.5, often taking values very close to zero. These results indicate that Slovenia maintained a stable balance between agricultural growth and emissions, but without experiencing either full decoupling or pronounced coupling. This pattern is influenced by limited agricultural expansion potential due to its mountainous terrain and the widespread presence of organic and traditional farming practices (Andrei et al., 2022). Moreover, the slightly negative trend in elasticity observed during 2015–2023 also suggests the growing impact of environmentally friendly agricultural practices in recent years.
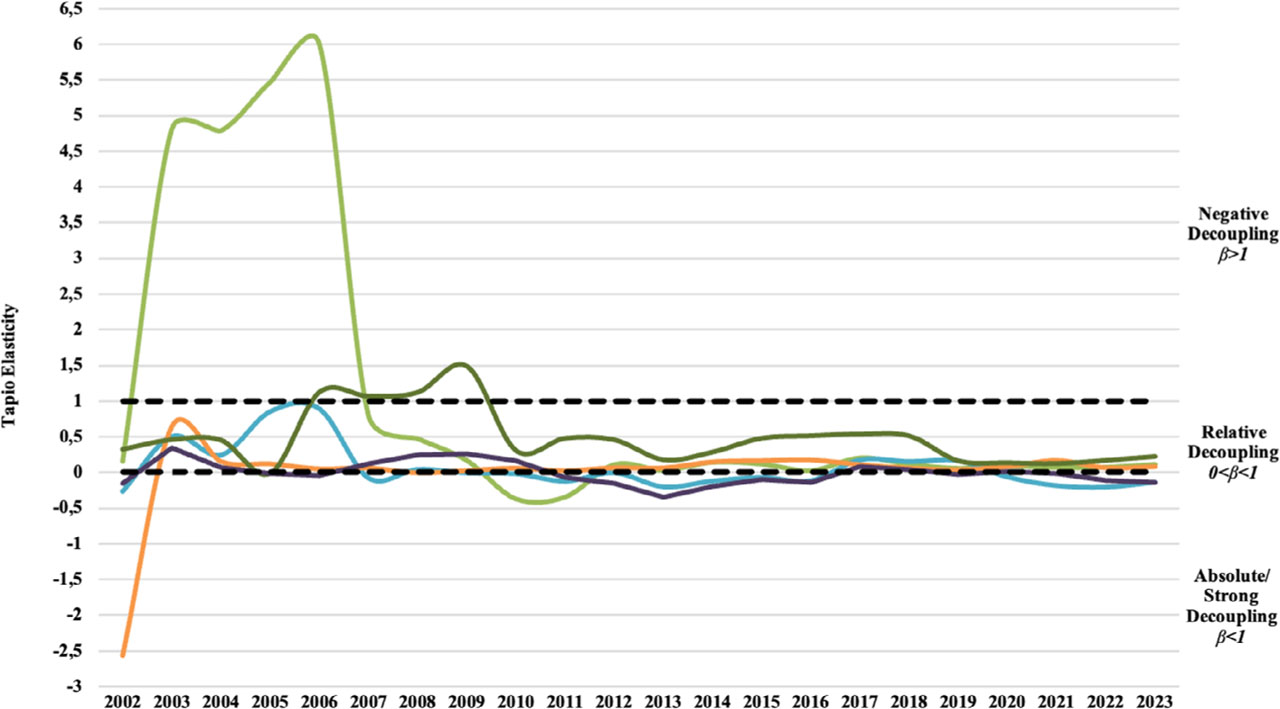
Fig. 3.
Tapio elasticity in the agricultural sectors of the transition economies (Estonia, Latvia, Lithuania, Slovakia and Slovenia): 4-year moving average (2002–2023)
Source: author’s calculations based on data.
An examination of the results shows that transition economies followed divergent decoupling trajectories, with Poland and Lithuania achieving sustained strong decoupling. Conversely, countries such as Bulgaria and Hungary experienced high volatility and repeated regime shifts. Moreover, the 2008–2013 period emerged as a critical structural turning point, during which decoupling performance weakened in most countries. Nevertheless, a gradual improvement was observed over 2019–2023, supported by policy reforms and technological advancements.
DISCUSSION AND CONCLUSIONS
For the period 1998–2023, this study examines the relationship between agricultural value added and greenhouse gas emissions in ten Central and Eastern European transition economies by applying the Tapio elasticity approach. In this context, sustainable development policies for the EU’s agricultural sector and the transition challenges many Eastern European countries faced are of particular concern. The EU’s climate targets, the need to balance agricultural competitiveness and productivity, and the imperative to protect sectoral incomes collectively shaped multi-dimensional rural and regional development objectives (Erjavec and Lovec, 2017). However, in transition economies these objectives often encountered region-specific structural constraints and policy delays.
Considering the first question addressed in this study, the agricultural sectors of transition economies exhibit strong divergence. Poland, which exhibited relatively low elasticity values during the pre-accession period to the EU, has managed to remain within a strong divergence zone in the post-accession period. While the effective implementation of the EU accession process and CAP reforms is considered to have been influential during this period, the effects of focusing on agricultural productivity practices and the widespread adoption of precision agriculture techniques are also evident (Bahmutsky et al., 2024; Zieliński et al., 2024). An acceleration was also noticeable in the post-pandemic period of 2019–2023, driven by the implementation of new-generation policies within the framework of the European Green Deal and the Farm to Fork Strategy, as well as the widespread adoption of digital agricultural technologies (Pe’er et al., 2019; IEEP, 2023). Furthermore, the environmental and climate assessment of the CAP Strategic Plan suggests that eco-schemes and carbon farming tools played a critical role in emission reduction (Zieliński et al., 2024; Rosa et al., 2025) and made a significant contribution to reducing greenhouse gas and ammonia emissions in grain production (Konieczna and Koniuszy, 2024). In Poland, the 11.9% reduction in agricultural greenhouse gas emissions between 1998 and 2023, when considered alongside an 82% increase in agricultural output, demonstrated that production can expand with a lower emission burden. A similar pattern is observed in Lithuania, which registered a remarkable reduction in agricultural emissions. The decoupling performance observed in Lithuania during the restructuring period before EU membership shows that the exit of inefficient farms from the sector increased land productivity without generating a disproportionate rise in emissions (Douarin and Latruffe, 2011). Furthermore, the focus on high value-added export products enabled a gradual shift away from input intensive production methods in the course of economic growth. EU funds allocated to agricultural infrastructure, combined with increased productivity and technological advancement, are linked to a strategy of expanding export markets and shifting towards high value-added products. Structural reforms implemented between 1998 and 2004 strengthened productivity foundations in the long term, allowing subsequent productivity to increase faster than emission intensity (Swinnen and Vranken, 2009). The 2014–2023 consolidation period stabilized divergence performance, and the strategy of focusing on high value-added products led to sustainable and strong divergence. The Czech agricultural sector demonstrated high sensitivity to cyclical policy changes and economic shocks. While negative divergence occurred during the recovery process following the 2008 global financial crisis due to delays in emission management measures (Naqvi, 2021), a gradual improvement was observed during the CAP 2014–2020 period with the introduction of greening measures (Cautisanu and Hatmanu, 2023). In the Czech agricultural sector, financial support and incentives for organic farming and fertilizer management are identified as key factors influencing farm practices and performance ( Kotyza and Smutka, 2020; Čechura et al., 2025). In Hungary, livestock sector incentives and increased fertilizer use during the 2012–2016 period caused emissions to increase significantly faster than economic growth (Andrei et al., 2022). Following 2016, more stable policies resulted in a 13.8% decrease in emissions and an 8.2% increase in production between 2019 and 2023. Bulgaria, exhibiting the most complex pattern, achieved a temporary strong divergence through pre-accession adjustment reforms; however, in the post-2008 period (2008–2018), significant delays in the absorption of EU funds led to emissions increasing much faster than economic growth. In this observed pattern, fragmented land ownership and inadequate administrative capacity redirected a substantial share of EU transfers towards direct income support rather than productivity enhancing investment. As a result, emission intensity remained largely unchanged (Incaltarau et al., 2020; Gorton et al., 2009). Consequently, emissions increased at approximately the same rate as output growth over the 1998–2023 period. Estonia stands apart from other countries due to its decline in agricultural output after 2009. The decline observed in 2014 became even more pronounced following COVID-19. In particular, rebalancing in Baltic agri-food trade and trade shocks related to the Russian import ban have caused fluctuations in supply and demand, as well as logistics and marketing challenges, thereby creating structural pressures (Bělín and Hanousek, 2021; Krivko et al., 2024). In Romania, where the structural transformation process is accompanied by a decline in agricultural employment, both production and greenhouse gas emissions decreased between 1998 and 2023. In Romania, contractions in production scale, labour outflows, and the reorganization of the agricultural business structure (Macours and Swinnen, 2000; Petrick, 2021) coincided with a downward trend in the agricultural workforce in recent years, and this decrease is evaluated in conjunction with broader structural transformation (Ursu et al., 2023). In Slovakia, a weakening of the economic weight and scale of agriculture can be observed; however, whether this decline represents a side-effect of ongoing restructuring is a matter of debate. A critical distinction in the case of Slovakia is that the decline in emissions does not stem from efficiency gains but a contraction in scale. This represents ‘passive decoupling’, which indicates that emissions may rise again if agricultural activity recovers (Pokrivčák, 2003; Buchta, 2011; Némethová and Civáň, 2017). From Latvia’s perspective, a limited but stable outlook is observed, influenced by the expansion of the livestock sector and increases in pasture and grazing areas. However, it has also been argued that while organic farming practices in Latvia have kept emission intensity low, they have simultaneously limited productivity growth (Veveris and Puzulis, 2020). Whether Slovenia’s consistently near-zero elasticity values reflects a structural constraint rather than an active policy achievement remains an open question. Mountainous terrain limits agricultural expansion, while the prevalence of organic and traditional farming practices suppressed both output growth and emission increases. The stability observed in Slovenia’s decoupling trajectory is therefore reflected, at least partly, in structural conditions rather than deliberate policy intervention (Bartulovic and Kozorog, 2014; EC, 2023b).
In the agricultural sector of transition economies, 2008–2013 marked a critical turning point. The crisis and the subsequent recovery process affected almost all transition economies, leading to a deterioration in their differentiation performance. Between 2019 and 2023, many countries showed signs of improvement. In 2020, the European Commission tightened its policy framework through the European Green Deal and the Farm to Fork Strategy, which influenced implementation stability.
In addressing the second research question, EU accession and CAP implementation produced differing effects across countries. While positive outcomes are observed in Poland and Lithuania following CAP reforms, the integration of eco-schemes and carbon-farming instruments in Poland’s CAP Strategic Plan is among the practices playing a significant role in emissions reduction (IEEP, 2023; Rosa et al., 2025). However, the impact of the CAP is not universal; delays in the absorption of EU funds in Bulgaria and Romania, together with within-country regional instability in agricultural practices, are identified as key criticisms (Gorton et al., 2009). Similarly, the global financial crisis was regarded as a critical turning point and decoupling performance weakened in most countries. Nevertheless, a substantial number of EU27 countries exhibited negative linkages between 2008 and 2012 (Cautisanu and Hatmanu, 2023). In the post-COVID-19 period (2020–2023), transition economies and the EU showed renewed signs of progress.
According to the third and final research question, numerous factors influence heterogeneity in transition economies. While this heterogeneity varies across countries and regions, farm structure and scale have emerged as critical differentiating factors. Countries such as Poland, Lithuania, and Czechia performed better than others maintaining fragmented structures by leveraging the transition to medium- and large-scale commercial farms (Davidova and Thomson, 2014; Zawalińska et al., 2015). Another important factor in this context is the technological adoption capacity resulting from investment in precision agriculture technologies. Furthermore, in transition economies, non-CO2 emissions (CH4 and N2O) in agriculture are sensitive to production concentration, and in expanding countries without technological upgrades, emission increases led to output increases (Han et al., 2019; Andrei et al., 2022; Menegat et al., 2022). On the other hand, the consistency and quality of institutionally pursued policies are critical for sustainable decoupling, reflecting the distinction between stable and volatile countries (Papież et al., 2021).
The heterogeneous nature of the decoupling patterns observed in the agricultural sector of EU transition economies necessitates differentiated policy responses. The different country profiles identified in the analysis require a specific policy emphasis. In Poland and Lithuania, which achieved sustainable absolute decoupling, the priority was to document successful practices and facilitate their transfer to other transition economies. The CAP Strategic Plan instruments, eco schemes, and carbon farming practices are regarded as mechanisms capable of suppressing emission intensity without constraining growth in economic output (Zieliński et al., 2024; EC, 2024; Rosa et al., 2025). Countries displaying high volatility, such as Bulgaria and Hungary, reflected institutional instability, delayed reform implementation, inconsistent absorption of EU funds, and changes in production structure (Incaltarau et al., 2020; Surubaru, 2021). In this context, greater emphasis on emission benchmarks in fund management, together with the implementation of practices directly linked to payment eligibility through technical support, appears likely to yield beneficial results. For Romania and Slovakia, where both output and emissions declined, an important issue concerns how decoupling reflected scale reduction rather than productivity gains (Macours and Swinnen, 2000; Petrick, 2021). Investment incentives, particularly those for precision agriculture technologies and cooperative farm structures, must be designed to turn this restructuring into a productivity-supported model and prevent emissions from rising as output increases. In this respect, the Estonian agricultural sector, which displayed an anomalous pattern of rising emissions despite falling output, required targeted CH4 management support and a more diversified trade orientation. Agri-food trade shocks, particularly those observed in the Baltic region, together with the economic imbalances resulting from Russia’s import ban (Bělín and Hanousek, 2021; Krivko et al., 2024), necessitated both trade diversification on the demand side and emission controls on the supply side, especially within the livestock subsector (Han et al., 2019; Andrei et al., 2022). Policy recommendations and discussion themes that require re-evaluation in this context can be outlined as follows:
The simultaneous prioritization of productivity-enhancing and emission-reducing technologies in the agricultural sector is increasingly emphasized. While precision agriculture and food-management practices supported by CAP funding are likely to deliver strategic benefits (Konieczna and Koniuszy, 2024), the focus remains on raising productivity while reducing environmental pressure.
Strengthening institutional capacity for EU fund absorption emerged as a key requirement. The rollout of practices in countries facing policy lags within transition economies and their applicability under shocks also warrants attention (Incaltarau et al., 2020; Surubaru, 2021).
Designing robust, counter-cyclical environmental support mechanisms is crucial to prevent the reversal of gains during crises and comparable periods. To ensure sustainability, greater attention should be paid to the joint design of economic, environmental, and social instruments within a climate-resilience approach (Pieńkowski and Zbaraszewski, 2019).
Developing targeted policies that explicitly address non-CO2 emission sources is identified as an important objective. In this regard, the implementation of sector-specific measures focusing on dominant agricultural emission sources, CH4 from livestock and N2O from soils, is increasingly prioritized. Evidence on the composition of agricultural emissions suggests that mitigation strategies should concentrate on processes such as CH4 and N2O formation, fertilizer use, and livestock structure (Han et al., 2019; Menegat et al., 2022; Chataut et al., 2023).
Scaling up eco-schemes and carbon-farming tools is considered another important step. Accordingly, targeted sustainable practices and policies need to be established regionally within a robust financing and taxonomy framework. At the same time, the possibility that green-labelled investments may increase the risk of greenwashing is discussed as a key concern in the context of energy-transition plans (Pieńkowski, 2024).