There is a general consensus in the literature that climate change and variability pose a real threat to the planet (Jiri et al., 2015; IPCC, 2018). The impacts of climate change and variability have a negative effect on the 2.5 billion people worldwide who depend directly on agriculture for their livelihood (Ali and Erenstein, 2017). In the Southern African region, it is reported that most of the poor reside in rural areas, and by implication, are the most affected by climate change because of their heavy reliance on a rainfed agricultural system (Foguesatto and Machado, 2020; Mandleni and Anim, 2011; Maponya et al., 2013). Climate change directly affects the natural environment upon which agriculture thrives (FAO, 2016). The vulnerability of smallholder farmers to climate change is further exacerbated by their low adaptive capacity, low technology uptake, limited access to climate change related information (Harvey et al., 2014), and their marginal location (Thamaga-Chitja and Morojele, 2014). The Intergovernmental Panel on Climate Change (IPCC, 2012) predicted that the incidence and severity of extreme weather events (i.e. drought and floods) will increase in the near future. As a result of climate change, the African continent’s food insecurity situation is expected to worsen (Ubisi et al., 2017). This is in the backdrop of a growing demand for food, fuel, and other basic human necessities.
Agricultural impact assessment studies often use standard simulation approaches which assume precise detection of climate change (Deressa et al., 2010). Unlike standard simulation approaches, economic models consider the perception of climate change as a pre-requisite for adaptation (Deressa et al., 2010). Adaptation to climate change is considered to be a two-step process (Deressa et al., 2010). The first step requires smallholder farmers to perceive that climate change is occurring. The second step requires farmers to take decisive action, that is, take up and implement adaptation strategies (Deressa et al., 2010). Indeed, several studies have shown that farmers’ perception of climate change drives their willingness to implement adaptation measures (Tobler et al., 2012; Spence et al., 2012; Hyland et al., 2015).
Various studies showed that different socio-demographic factors and farm characteristics affect climate change perceptions (Akerlof et al., 2013; Smith and Leiserowitz, 2012; Hitayezu et al., 2017; Shisanya and Mafongoya, 2017). Individual farmers’ attributes (i.e. years of schooling and training, farming experience and age) also influence farmers’ perception of climate change (Roco et al., 2015). Individual farmers’ perception of climate change may also be affected by other farmers and climate change values within the community (Moyo et al., 2012). Individual and community behavioural responses are influenced by their perceptions of problems (Mills et al., 2017). Perception of climate risk is also associated with belief about adverse consequences of valued objects and is dependent on a person’s values and worldviews (Brody et al., 2012). Climate risk perception is not the same between countries and may also be different between individuals in the same community and country (Whitmarsh, 2011; Smith and Leiserowitz, 2012). There is a need to consider socio-economic settings when investigating perception and adaptation to climate change.
Maddison (2007) noted that a significant proportion of smallholder farmers in Africa struggle to understand the nature of climate change. Farmers’ misunderstanding of climate change stems from the limited success of policies aimed at communicating climate change and calls for examination of the causes of misconceptions among farmers. Muller and Shackleton (2014) suggested that these misconceptions may arise from the complex biophysical processes that are difficult for farmers to recognise. For instance, smallholder farmers often misinterpret long-term changes in rainfall, incorrectly attributing them to increased temperatures caused by evapotranspiration and greater water demand, as well as the rapid onset of water stress during dry periods (Sugden et al., 2014). Consequently, existing studies commonly argue that the incorrect perceptions stem from farmers’ focus on agricultural production rather than the climate itself (Georgescu et al., 2011; Gbetibouo, 2009; Muller and Shackleton, 2014).
Farmers’ responses on climate are context-specific and this calls for local-level analysis of climate change. Climate change studies conducted in the uMkhanyakude district of KwaZulu-Natal (KZN) province in South Africa focused on the effect of drought on farmers’ livelihoods (Patrick, 2021; Masinga et al., 2021; Maziya et al., 2024). This study aims to build on these studies by investigating the socio-economic determinants of climate change perception among smallholder farmers in the uMkhanyakude district. Understanding farmers’ perceptions of climate change is essential in the implementation of programmes aimed at mitigating the negative effects of climate change on smallholder farmers (Lemma, 2016). For effective climate risk communication, policymakers and stakeholders must be aware of the underlying factors that determine climate change perception.
The study was conducted in the uMkhanyakude district municipality in KwaZulu-Natal province, South Africa. UMkhanyakude is located in the northern part of the KZN province in South Africa (32, 014489; -27, 622242) (uMkhanyakude District Municipality, 2023). The district borders the Indian Ocean in the east, Mozambique to the north, the Kingdom of eSwatini in the north-west and uThungulu and Zululand districts in the south and west. There are five local municipalities in the uMkhanyakude district: Jozini, uMhlabuyalingana, Hlabisa, Mtubatuba, and Big Five False Bay. UMkhunyakude is a rural district with Mtubatuba and Jozini as major local towns. The district covers a surface area of 12 818 km2 and has about 625 846 people with a population density of 46 per km2 (uMkhanyakude District Municipality, 2023). In terms of size, uMkhanyakude is the second largest district in KZN. Out of 11 districts in KZN, uMkhanyakude district was purposively chosen. UMkhanyakude district is one of the poorest municipalities in KZN and the area has been devastated by climate-induced changes (Ntsaluba, 2014). The sub-tropical climate of uMkhanyakude district is characterised by a warm and humid summer season (November-March) and a colder and dry winter season between June and August (Lankford et al., 2011).
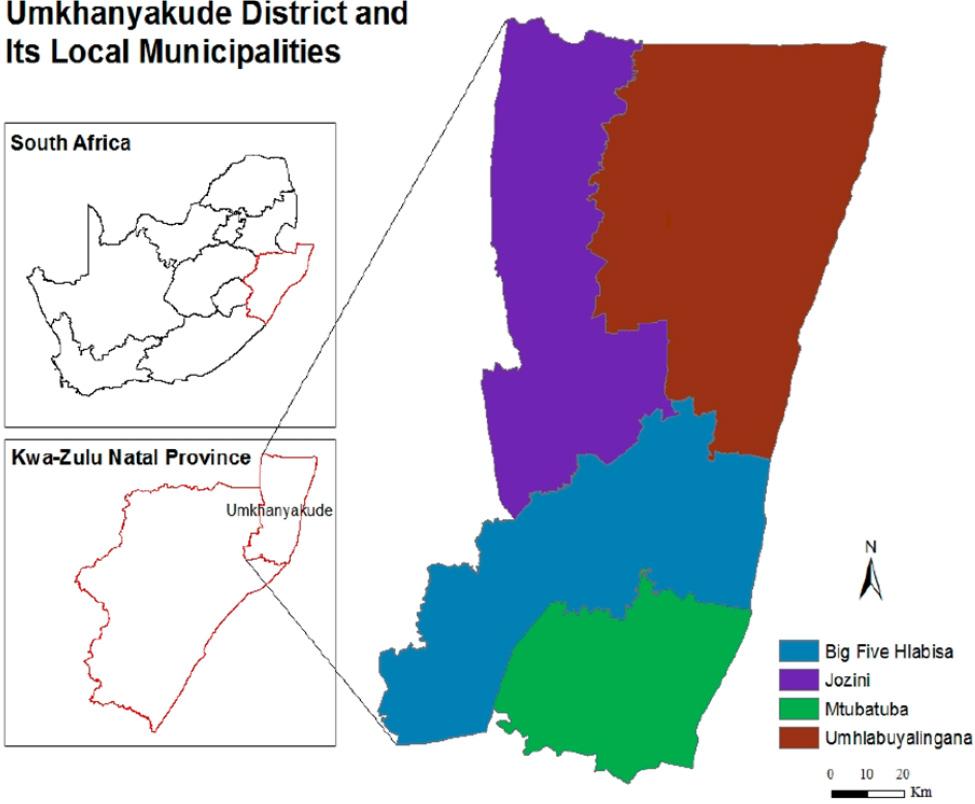
Map of uMkhanyakude KwaZulu-Natal province of South Africa
Source: XXXXX.
Climate change has been a pressing issue in the uMkhanyakude district. The district’s most recent climate forecasts indicate that rainfed agriculture in uMkhanyakude is likely to be adversely affected by lower annual rainfall, higher temperatures, increased hydrological risk, increased variability of rainfall, topsoil drying, less plant water in the soil, and increased requirements for irrigation (uMkhanyakude District Municipality, 2023).
Israel (1992) provides guidelines on how to determine sample sizes based on population size, margin of error, and confidence levels. The selected local municipalities (LMs) have 84 198 households, based on the guidelines, and population sizes of 10 000, 100 000, and 500 000 have corresponding sample sizes of 370, 383, and 388, where the margin of error is 5% and the confidence level is 95%. A sample size of 400 households was considered adequate for this study. A stratified random sampling procedure was used to select participants. In the first stage, 50% of the wards in each local municipality were randomly selected. In the second stage, farming households were randomly selected within the wards. Jozini LM has 20 wards while uMhlabuyalingana LM comprises 18 wards. Data was collected in two LMs, i.e., Jozini and uMhlabuyalingana. Jozini LM has a population of 198 215 and comprises 44 584 households while uMhlabuyalingana LM has a population of 172 077 and comprises 39 614 households (Stats SA, 2020).
A structured questionnaire was used to collect quantitative data in August 2020. The survey questionnaire was designed to capture data on demographics, crop production, household assets, livestock ownership, support services and farmer training, land ownership, food security, climate change perception, and adaptation. Before the actual data collection, the questionnaire was pre-tested on five non-sampled households in the Jozini LM to make sure that the questionnaire flows and that there is clarity with the questions. After pre-testing, questions that were not clear were modified.
In this study, enumerators visited the sampled households and interviewed the household heads. Questions in the questionnaires were translated from English to isiZulu (local language) to accommodate the selected setting. Informed consent was obtained before interviewing participants who were part of the survey. Enumerators asked questions in isiZulu and filled in the questionnaires on behalf of the farmers. The study focused on smallholder farmers engaged in both crop and animal production, in agricultural activities for their own food consumption, or in owned food production and also selling a surplus. In South Africa, smallholder farming is characterised by small-scale farms, limited use of inputs and machinery, reliance on traditional production methods, and a lack of institutional capacity and support (Pienaar and Traub, 2015). Two focus group discussions were conducted to gain in-depth insight into farmers’ experiences of climate change.
A binary logistic regression model was employed to determine farmers’ perceptions of climate change. This is because farmers’ perception of climate change is a binary response variable that takes the value of 1 if the farmer perceives climate change and 0 otherwise. Binary logistic regression models are generally used when the dependent variable is a dummy. Several studies (i.e., Oduniyi et al., 2018; Foguesatto and Machado, 2020; Mustafa et al., 2019; Hasan and Akhter, 2011) employed binary logistic regression models to analyse factors that determine climate change perception among smallholder farmers. According to Hasan and Akhter (2011), the logistic model can be expressed as follows:
A stepwise logistic regression was further used to refine the model. In the first step, each independent variable was regressed against the dependent variable to determine the t values. In the second step, the independent variables were regressed in chronological order, starting with the variable with the highest t value. Out of the 13 initial variables considered based on a review of the literature, five were retained in the final model.
The independent variables for the binary logistic model included demographic characteristics of farmers, farm characteristics, and institutional factors. The variables were selected based on the literature on climate change perception. Table 1 presents the logistic model variables, their definition, and expected effect on farmers’ perception of climate change.
Variables used in the binary logistic model
| Variable code | Variable name | Variable description and measurement | Expected sign |
|---|---|---|---|
| CC_PERCEPTION | Climate change perception | 1= the climate is changing, and 0 otherwise | |
| AGE | Age | Age of household head in years (continuous) | + |
| EDUCAT | Education | Years of schooling (continuous) | + |
| LAND_SIZE | Land size | Land size in hectares (continuous) | − |
| H_ADULTS | Adult equivalents | Factor representing household labour endowment (continuous) | + |
| FARM-ASSOC | Membership in farmers associations | 1 if the respondent is a member in a farmers’ organisation and 0 otherwise (dummy) | + |
| ACCESS_IRRIG | Access to irrigation infrastructure | 1 if the respondent has access to irrigation infrastructure and 0 otherwise (dummy) | − |
Source: own elaboration
The age of the household head (AGE) is a demographic variable representing the respondent’s social values and individual attitudes towards the world regarding climate change. Farmers’ ability to perceive climate change is influenced by personal experiences that increase with advancement in age (Debela et al., 2015). Age is also considered a proxy for farming experience. Therefore, advancement in age is expected to have a positive effect on climate change perception.
The household head level of education (EDUCAT) is both a cognitive and experiential variable in the logistic model. Gaurav and Singh (2012) argue that education increases farmers’ cognitive ability to read, analyse, and process climate related information, thus increasing their probability of perceiving climate change. In the model, the level of education of the household head is expected to have a positive effect on climate change perception.
Membership in farmers’ association (FARM_ASSOC) in the logistic model is an institutional variable that represents social capital. Behavioural studies (i.e., Hagen, 2013; Hitayezu et al., 2017) have shown that networks can be a source of environmental information, hence farmers who have more networks are likely to perceive climate change. The variable is expected to have a positive effect on climate change perception.
Landholding (LAND_SIZE) is an experiential variable that represents sensitivity to climate change and variability. Small farms are characterised by similar bio-geophysical properties (i.e., soil fertility) that amplify vulnerability to climate change (Hitayezu, 2015). Therefore, farmers with small farm sizes are more sensitive to climate change and are expected to perceive climate change.
Access to irrigation (ACCESS_IRRIG) measured as the distance to the nearest river or dam represents resilience to climate change through irrigation as a coping mechanism (Gbetibouo et al., 2010). Farmers who irrigate their crops have a degree of control over the negative effects of climate change and thus decreases their probability of perceiving climate change (Deressa et al., 2010). Therefore, proximity to a river or dam is expected to have a negative effect on climate change perception.
The variable for adult equivalents (H_ADULTS) represents the availability of labour in the household. Farmers were asked to count the number of people above 18 years residing in the household who assist in farming. Cutler and Katz (1992) introduced an approach that measures adult equivalents. The function can be computed as follows:
Table 2 below presents the summary statistics of continuous and categorical variables according to climate change perception. Table 2 indicates that 95.5% of the sampled farmers perceived climate change. In this study, farmers who perceived climate change are referred to as “perceivers” and those who did not perceive climate change are referred to as “non-perceivers”. The proportion of climate change perceivers in this study is slightly higher than that of other studies conducted in KwaZulu-Natal (Shisanya and Mafongoya, 2017; Hitayezu et al., 2017) but similar to other studies conducted in other parts of Africa (i.e., Debela et al., 2015; Fosu-Mensah et al., 2012).
Summary descriptive statistics according to climate change perception
| Variables | Pooled sample (N = 400) | Perceivers (N = 382) | Non-perceivers (N = 18) | T-test / X2 | |||
|---|---|---|---|---|---|---|---|
| mean | std. dev | mean | std. dev | mean | std. dev | ||
| Age | 55.77 | 12.36 | 56.27 | 11.94 | 44.41 | 16.19 | –3.94*** |
| H_ADULTS | 4.25 | 3.76 | 4.33 | 3.82 | 2.47 | 1.33 | –2.00 ** |
| LAND_SIZE (ha) | 1.31 | 1.20 | 1.34 | 1.21 | 0.63 | 0.50 | –2.40** |
| ACCESS_IRRIG | 3.70 | 2.57 | 3.54 | 2.28 | 7.29 | 5.07 | 6.16*** |
| EDUCATION | 8.49 | 3.85 | 8.53 | 3.81 | 7.41 | 4.62 | –1.17 |
| FARM_ASSOC | 0.35 | – | 0.33 | – | 0.3 | – | 10.92*** |
** and *** means significant at 5% and 1%, respectively.
Source: household survey, 2020.
With regard to the age of the respondents, the data portrays an ageing cohort of smallholder farmers who perceived climate change, with a mean age of 56.27 and 44.41 for perceivers and non-perceivers, respectively. This implies that with age, farmers gain experience and this enables them to perceive changes in the climate. Adult equivalents (H_ADULTS) were significantly different among farmers in the two groups. On average, a perceiver’s household had four adult equivalent members while a non-perceiver’s household had approximately two adult equivalent members. This result implies that perceivers had more social capital, skills, and knowledge and this increased their probability of perceiving climate change. The mean levels of landholding (LAND_SIZE) in the sample were significantly (p < 0.05) different between perceivers and non-perceivers. On average, perceivers owned 1.34 hectares while non-perceivers owned 0.63 hectares. Similar findings on landholding between perceivers and non-perceivers have been reported in KwaZulu-Natal (Hitayezu et al., 2017).
Access to irrigation (ACCESS_IRRIG) was significantly (p < 0.01) different between the two groups, with an average perceiver travelling 3.54 km to the nearest river or dam, while the average non-perceiver travelled almost twice the distance (7.29 km) travelled by a perceiver to reach the nearest river or dam. These results are in contrast with the literature on farmers’ perceptions of climate change (Ndambiri et al., 2013; Gbetibouo et al., 2010; Deressa et al., 2010). Farmers living closer to a water source can efficiently irrigate their crops and this reduces their vulnerability to the negative effects of climate change, which diminishes their probability of perceiving climate change. This contrasting result could be associated with the prevailing dry conditions in the uMkhanyakude district, resulting in the drying of dams and perennial rivers. Farmers who stay near a river or dam may have experienced the drying of rivers and dams caused by prolonged heat in the study area, thus having a high probability of perceiving climate change. Involvement in farmers’ associations was significantly different among farmers in the two groups, with perceivers recording a higher proportion (33%) compared to non-perceivers (30%). The plausible explanation for this result is that social networks such as farmers’ associations play an important role in influencing climate change perception.
Figure 2 shows the rainfall patterns of uMkhanyakude district for the period 1999–2019. The observed annual rainfall ranges from 514 mm (1999) and 525.9 mm (2019) while the average rainfall for the 20-year period is 584.45 mm. The rainfall trends in Figure 2 show that rainfall has been decreasing in the district. The year 2000 received the most rainfall (836 mm above average), while the year 2002 received the least rainfall (252 mm below average). The years 2000, 2001, 2004, 2006, 2007,2009, 2012, 2017, and 2018 received above average rainfall: 1420.6 mm, 702 mm, 704.4 mm, 827 mm, 619 mm, 647 mm, 707.7 mm, 604.1 mm, and 652.3 mm, respectively. Conversely, the years 1999, 2002, 2003, 2005, 2008, 2010, 2013, 2014, 2015, 2016, and 2019 recorded below average rainfall: 514 mm, 332 mm, 352.5 mm, 491.7 mm, 415mm, 476 mm, 472.6 mm, 571.3 mm, 453 mm, 396.5 mm, 388.9 mm, and 525.9 mm, respectively. South Africa is a semi-arid arid country, as such, the decreasing average annual rainfall could jeopardize the livelihoods of smallholder farmers who rely on rainfed agriculture for crop and animal production.
In general, meteorological records indicate that minimum and maximum temperatures have been slightly increasing in the uMkhanyakude district over the period 1999–2019 (Fig. 3). The year 2013 recorded the lowest minimum temperature (14.7°C), while the highest annual minimum temperature (16.2°C) was recorded in 2019. The year 2009 recorded the least maximum temperature (27°C), whereas the year 2019 recorded the most maximum temperature (29°C).
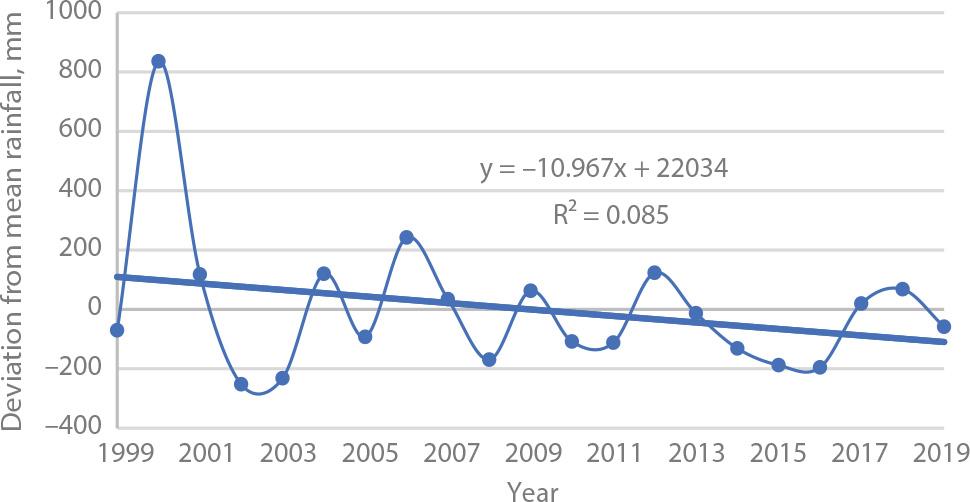
Annual deviation of rainfall from the mean in uMkhanyakude district (1999–2019)
Source: South African Sugarcane Research Institute meteorological data.
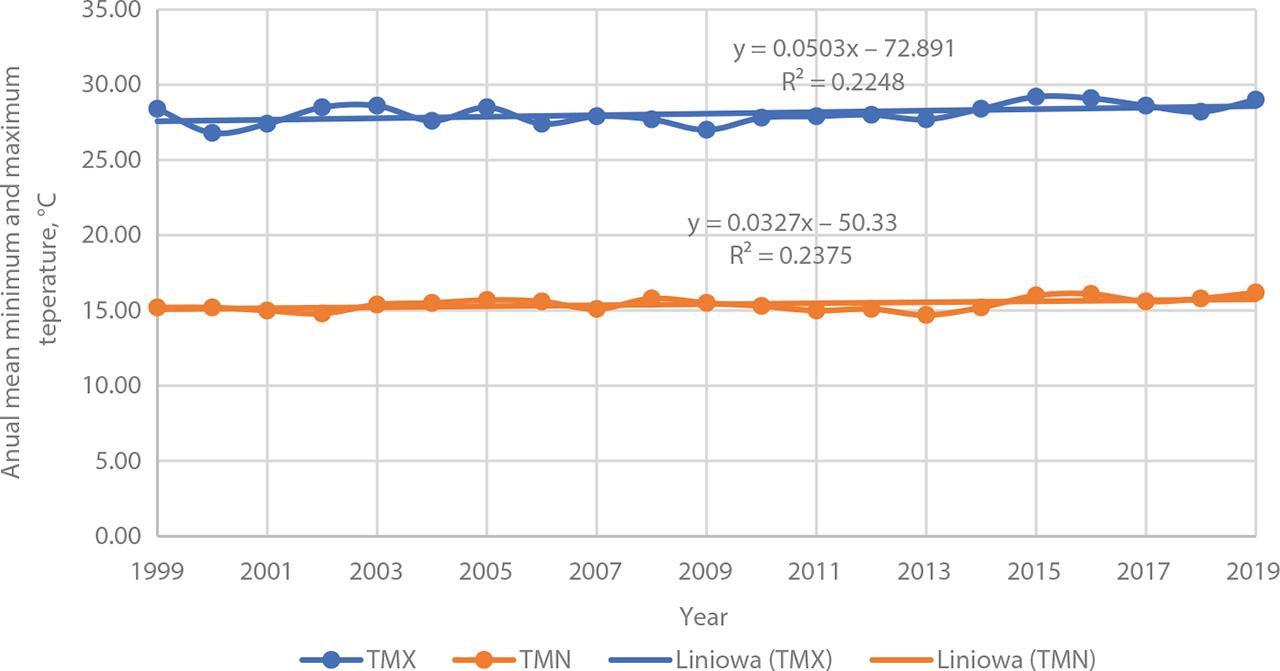
Annual minimum and maximum temperature in uMkhayakude district (1999–2019)
Source: South African Sugarcane Research Institute meteorological data.
Table 3 summarizes the perceptions of smallholder farmers on climate variables. The majority of smallholder farmers indicated that summer (80.25%) and winter (81.25%) rainfall has decreased over the period 1999–2019. The majority (76.75%) of the farmers also indicated that summer temperatures had increased. However, farmers perceived the incidence of floods (65.25%) to have decreased in the 20-year period. Conversely, most farmers (71%) indicated that the incidence of drought had increased in the uMkhanyakude district. These farmers’ perceptions of climate change are in tandem with the rainfall and temperature trends from meteorological records. Similar findings on farmers’ perceptions regarding climate change have been reported in South Africa (Shisanya and Mafongoya, 2017; Hitayezu et al., 2017; Ubisi et al., 2017) and in other African countries such as Ethiopia (Asrat and Simane, 2018), Zimbabwe (Moyo et al., 2012), and Malawi (Chingala et al., 2017). Similarly, the IPCC (2007) predicted that the Southern African region will get drier and warmer over the years. Maddison (2007) and Jiri et al. (2015) noted that farmers’ perceptions of changes in temperature and rainfall are critical determinants in farm-level adaptation.
Proportion of farmers who noticed long term changes in climate variables
| Noticed changes in the past 20 years | Increased | Decreased | Remained the same | I do not know |
|---|---|---|---|---|
| Summer season rainfall | 14 | 80.25 | 4.50 | 1.25 |
| Winter rainfall | 10.50 | 81.25 | 6.75 | 1.50 |
| Length of summer season rainfall | 13.25 | 78.00 | 7.00 | 1.75 |
| Summer temperatures | 76.75 | 19.25 | 2.50 | 1.50 |
| Winter temperatures | 42.25 | 47.50 | 9.25 | 1.00 |
| Frequency of drought | 71 | 19.75 | 7.50 | 1.75 |
| Frequency of floods | 12.25 | 65.25 | 15.80 | 9.25 |
Source: 2020 Household survey.
Focus group discussions were conducted to supplement quantitative data. Table 4 presents an appraisal of farmers’ climate events recollection against meteorological records for uMkhanyakude district. Farmers’ recollections of extreme weather events did match meteorological records. Table 4 indicates that the study area was dominated by drought in the 20-year period. These findings show that uMkhanyakude district is getting drier. The findings are consistent with the work of Shisanya and Mafongoya (2017) who assessed climate change perceptions in the uMzinyathi district of KwaZulu-Natal and found that drought was prevalent in the area. The implication is that there could be less water for farming which could lead to food and nutrition insecurity among smallholder farmers in the study area.
Farmers’ perceptions of extreme weather events in the uMkhanyakude district
| Year | Farmers’ observations | Evidence from meteorological records |
|---|---|---|
| 2000 | Floods | Rainfall for the year 2000 was above average (836 mm above average) |
| 2002–2003 | Drought | The years 2002 and 2003 received below average rainfall, 332 mm and 353 mm, respectively |
| 2005 | Drought | 2005 received slightly below average rainfall (492 mm) with January (144.3 mm) and November (109.1 mm) receiving the most rainfall |
| 2008 | Drought | 2008 recorded below average rainfall (415 mm) with November (81.4 mm) and December (86 mm) receiving the most rainfall |
| 2010–2011 | Drought | The years 2010 and 2011 received below average rainfall, 476 mm and 473, respectively |
| 2014–2016 | Severe drought | 2014–2016 were dry years receiving below average rainfall. |
Source: household survey, 2020.
The Variance Inflation Factor (VIF) was used to test for multicollinearity between independent variables, where values of less than 10 are acceptable (Gujarati, 2004). With a mean VIF of 1.04, multicollinearity was not a problem between the independent variables. A binary logistic regression model was estimated to determine the socio-economic factors influencing climate change perception. Table 5 presents the results of the binary logistic model. The model is highly significant (p = 0.0000), indicating that the model is a good fit.
Determinants of climate change perception, logit results
| Variable | Odds ratio | SE | P>|z| | VIF |
|---|---|---|---|---|
| AGE | 1.099 | 0.027 | 0.000*** | 1.04 |
| EDUCAT | 1.158 | 0.078 | 0.028** | 1.03 |
| LAND_SIZE | 5.406 | 3.945 | 0.021** | 1.07 |
| H_ADULTS | 1.876 | 0.517 | 0.022** | 1.03 |
| FARM_ASSOC | 0.234 | 0.154 | 0.027** | 1.05 |
| ACCESS_IRRIG | 1.778 | 0.058 | 0.001*** | 1.02 |
| Constant | 0.022 | 0.038 | 0.027** | – |
| LR chi2(12) | 68.46 | |||
| Prob > chi2 | 0.0000*** | |||
| Pseudo R2 | 0.4867 | |||
| Number of observations | 400 | |||
| Mean VIF | 1.04 |
*** and ** denote statistical significance at 1% and 5% levels, respectively.
Source: household survey, 2020.
This study found that involvement in farmers’ associations (FARM_ASSOC) has a negative influence on climate change perception. Farmers who are involved in farmers’ associations are less like to perceive climate change. The result is not in line with the a priori expectation. Studies conducted in Africa (i.e., Mudombi et al., 2014; Elia, 2017) found that smallholder farmers trust information from people close to them. This result may be area-specific, showing fragmented social relations in the study area which impacts negatively on the flow of climate change information.
The positive and significant effect of age (AGE) of the household head on climate change perception implies that older farmers are more likely to perceive climate change. This finding was expected as farmers’ ability to notice climatic changes is influenced by their knowledge and personal experiences, which they accumulate with advancement in years (Mudombi et al., 2014; Debela et al., 2015). This finding also corroborates findings from other studies conducted in South Africa (i.e., Maponya et al., 2013; Hitayezu et al., 2017) and in other parts of Africa (i.e., Deressa et al., 2010; Asrat et al., 2018; Debela et al., 2015).
Attainment of higher levels of education increases the likelihood of perceiving climate change by 1.158 odds. Higher levels of education increase awareness of climate change as an issue of immediate concern. Farmers who attained education can receive, process, and recognise changes in the environment and understand information relating to climate change (Amir et al., 2020; Kimani and Bhardwaj, 2015; Mutunga et al., 2018). Empirical studies have shown that the level of education correlates to the level of knowledge and the simplicity of making sound decisions (Jiri et al., 2015; Anley et al., 2007; Dolisca et al., 2006). In the same vein, higher levels of education coupled with farming experience should improve farmers’ perceptions of climate change. Other studies (i.e., Mustapha et al., 2012; Ndambiri et al., 2012) conducted across African farming systems have also shown that education plays an important role in influencing farmers’ perception of climate change.
The results of the study show a positive and significant relationship between adult equivalents (H_ADULTS) and climate change perception. An increase of one adult equivalent increases climate change perception by 1.876 odds. As posited by Ojo and Baiyegunhi (2021) and Hitayezu et al., (2017), an increase in adult equivalent members in a household increases the probability of perceiving environmental changes as a result of the negative impacts of climate change. This possibly occurs because more members of the household are exposed to climate change information through different platforms such as media.
The results show a positive and significant relationship between land size (LAND_SIZE) and climate change perception. A one hectare increase in landholding increases climate change perception by 5.406 odds. A plausible explanation for this result is the fact that the perception of climate change takes place faster on larger farm sizes compared to smaller farm sizes (Ojo and Baiyegunhi, 2021). This result is in consonance with the findings from Bryan et al. (2013) and Thinda et al. (2020).
The coefficient of access to irrigation (ACCESS_IRRIG) is statistically significant and positively related to climate change perception. Access to irrigation increases climate change perception by 1.778 odds. The plausible explanation for this result may be traced to the fact that farmers have to irrigate more often due to higher temperatures and inadequate rainfall and this triggers the perception of climate change.
Climate change is an emerging stressor that threatens the livelihoods of smallholder farmers in developing countries. Climatic changes manifest in extreme weather, unexpected temperatures, and rainfall changes. This study assessed the determinants of climate change perception using cross-sectional data from a sample of 400 smallholder farmers in the KwaZulu-Natal province of South Africa. A binary logistic regression model was used to analyse the determinants of climate change perception. The study revealed that farmers noticed a decline in rainfall and an increase in temperatures over the 20-year period (1999–2019). Drought has been a prominent feature in the study area. The study, however, has a noteworthy limitation. The use of seasonal data may lead to a potential bias as farmers may emphasise recent climatic events more than the broader historical context.
While climate change is an environmental problem, the scope of its impacts is strongly determined by underlying socio-economic variables. The study concludes that climate change perception in the uMkhanyakude district is influenced by access to irrigation, land size, adult equivalents, age of the household head, level of education, and membership in farmers’ organizations. Policies aimed at addressing the impacts of climate change should place an emphasis on dealing with drought, which has been a prominent phenomenon in the study area and Southern African region. In addition, it is recommended that government policies geared toward the support of extensive educational programmes should consider the determinants of climate change perception.