Fig. 1.
Fig. 2.
Fig. 3.
Fig. 4.
Fig. 5.
Fig. 6.
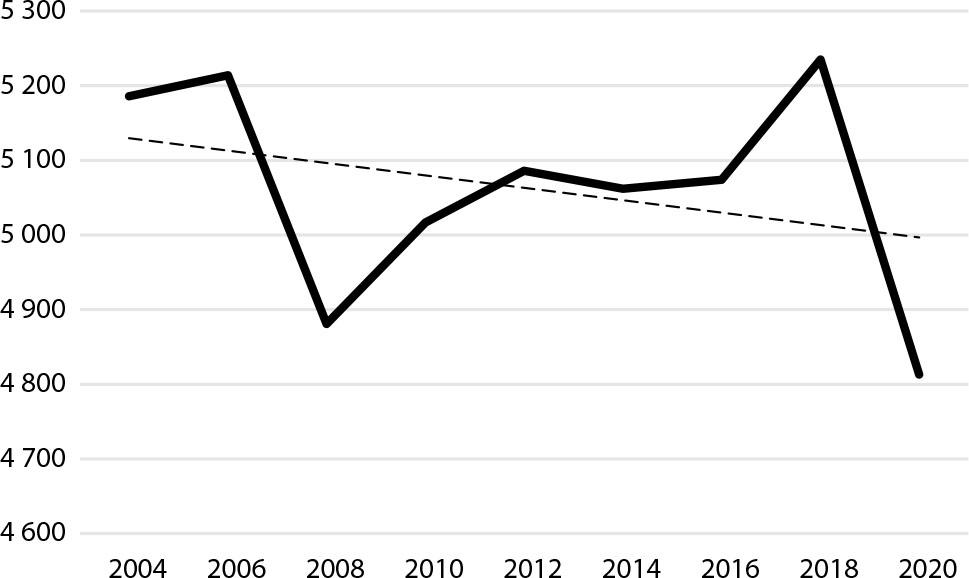
Fig. 7.
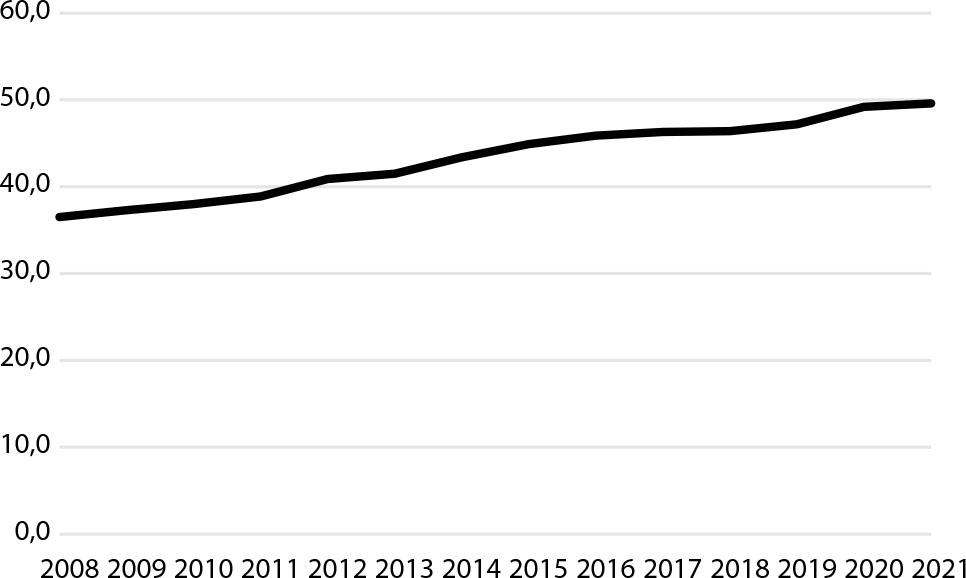
Fig. 8.
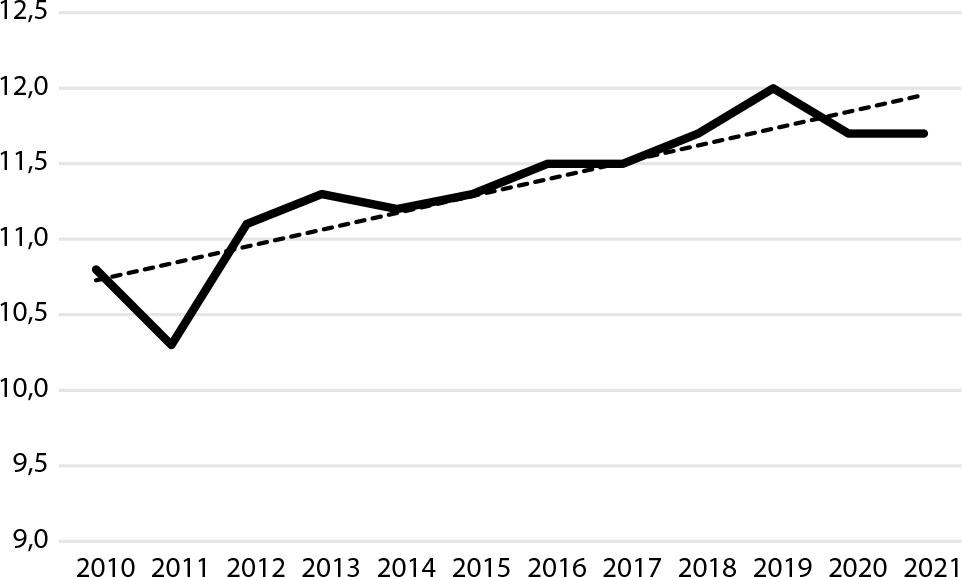
Fig. 9.
Information of thematic areas and chosen indicators used
| Name of thematic areas | Name of chosen indicators | Relevance of indicator | Unit of measure | Frequency of dissemination |
|---|---|---|---|---|
| Production and consumption | Waste generation per capita | The indicator is part of the CE monitoring framework. Minimizing the generation of waste is a key part of the CE Action Plan. | Kilogram per capita | Every 2 years |
| Waste management | Recycling rate of municipal rate | The indicator measures the share of recycled municipal waste in the total municipal waste generation. It gives an indication of how waste from final consumers is used as a resource in the CE. | Percentage | Every year |
| Secondary raw materials | Circular material use rate | Circular material use is defined as the ratio of the circular use of materials to the overall material use. The indicator measures the share of material recycled and fed back into the economy. | Percentage of total material use | Every year |
| Competitiveness and innovation | Persons employed in CE | The indicator measures “Number of persons employed” in the following three sectors: the recycling sector, repair and reuse sector and rental and leasing sector. | Percentage of total employment | Every year |
Waste generation kg per capita in the EU and other countries (every 2 years 2004–2020)
| Specification | 2012 | 2014 | 2016 | 2018 | 2020 | Change 2012 = 100 |
|---|---|---|---|---|---|---|
| 1 | 2 | 3 | 4 | 5 | 6 | 7 |
| EU | 5.086 | 5.062 | 5.074 | 5.235 | 4.813 | 94.63 |
| Belgium | 4.847 | 5.171 | 5.573 | 5.967 | 5.899 | 121.70 |
| Bulgaria | 22.072 | 24.872 | 16.907 | 18.470 | 16.785 | 76.05 |
| Czechia | 2.205 | 2.223 | 2.402 | 3.560 | 3.598 | 163.17 |
| Denmark | 2.989 | 3.687 | 3.663 | 3.702 | 3.453 | 115.52 |
| Germany | 4.576 | 4.785 | 4.858 | 4.891 | 4.824 | 105.42 |
| Estonia | 16.627 | 16.587 | 18.451 | 17.539 | 12.171 | 73.20 |
| Ireland | 2.764 | 3.256 | 3.207 | 2.874 | 3.248 | 117.51 |
| Greece | 6.549 | 6.404 | 6.712 | 4.215 | 2.705 | 41.30 |
| Spain | 2.535 | 2.378 | 2.774 | 2.945 | 2.230 | 87.97 |
| France | 5.264 | 4.893 | 4.836 | 5.112 | 4.593 | 87.25 |
| Croatia | 846 | 879 | 1.286 | 1.355 | 1.483 | 175.30 |
| Italy | 2.594 | 2.597 | 2.702 | 2.855 | 2.942 | 113.42 |
| Cyprus | 2.171 | 2.321 | 2.897 | 2.646 | 2.488 | 114.60 |
| Latvia | 1.135 | 1.315 | 975 | 920 | 1.501 | 132.25 |
| Lithuania | 1.901 | 2.114 | 2.327 | 2.527 | 2.396 | 126.04 |
| Luxembourg | 15.816 | 12.713 | 17.217 | 14.828 | 14.618 | 92.43 |
| Hungary | 1.644 | 1.688 | 1.624 | 1.879 | 1.648 | 100.24 |
| Malta | 3.467 | 3.849 | 4.287 | 5.173 | 5.823 | 167.96 |
| Netherlands | 7.233 | 7.848 | 8.281 | 8.429 | 7.175 | 99.20 |
| Austria | 5.699 | 6.537 | 7.008 | 7.428 | 7.728 | 135.60 |
| Poland | 4.266 | 4.714 | 4.793 | 4.621 | 4.492 | 105.30 |
| Portugal | 1.271 | 1.381 | 1.427 | 1.546 | 1.612 | 126.83 |
| Romania | 12.432 | 8.871 | 9.012 | 10.425 | 7.338 | 59.03 |
| Slovenia | 2.210 | 2.273 | 2.661 | 3.964 | 3.576 | 161.81 |
| Slovakia | 1.558 | 1.636 | 1.953 | 2.277 | 2.340 | 150.19 |
| Finland | 16.961 | 17.572 | 22.359 | 23.253 | 20.993 | 123.77 |
| Sweden | 16.420 | 17.226 | 14.272 | 13.628 | 14.664 | 89.31 |
| Iceland | 1.651 | 2.490 | 3.182 | 3.667 | 2.895 | 175.35 |
| Liechtenstein* | 12.727 | 15.278 | 13.325 | 11.448 | : | 89.95 |
| Norway | 2.136 | 2.066 | 2.127 | 2.662 | 2.610 | 122.19 |
| UK* | 3.791 | 4.071 | 4.147 | 4.249 | : | 112.08 |
| Montenegro | 1.634 | 1.757 | 2.708 | 1.965 | 2.007 | 122.83 |
| North Macedonia | 4.111 | 1.058 | 688 | 549 | 716 | 17.42 |
| Serbia | 7.640 | 6.890 | 6.937 | 7.319 | 8.502 | 111.28 |
| Türkiye | 896 | 947 | 953 | 1.195 | 1.291 | 144.08 |
| Bosnia and Herz.* | 1.161 | 1.447 | 1.744 | 1.930 | : | 166.24 |
| Kosovo | 649 | 574 | 1.607 | 1.648 | 1.448 | 223.11 |
Circular material use rate in the European Union and other countries (2010–2021, %)
| Specification | 2012 | 2013 | 2014 | 2015 | 2016 | 2017 | 2018 | 2019 | 2020 | 2021 | Change 2012=100 |
|---|---|---|---|---|---|---|---|---|---|---|---|
| 1 | 2 | 3 | 4 | 5 | 6 | 7 | 8 | 9 | 10 | 11 | 12 |
| EU | 11.1 | 11.3 | 11.2 | 11.3 | 11.5 | 11.5 | 11.7 | 12. | 11.7 | 11.7 | 105.41 |
| Belgium | 17 | 17 | 18 | 18 | 18 | 19 | 20 | 24 | 22 | 21 | 121.30 |
| Bulgaria | 1.9 | 2.5 | 2.7 | 3.1 | 4.4 | 3.5 | 2.5 | 2.3 | 5.9 | 4.9 | 257.89 |
| Czechia | 6.3 | 6.7 | 6.8 | 6.9 | 7.5 | 9.1 | 10.5 | 11.3 | 11.6 | 11.4 | 180.95 |
| Denmark | 6 | 8 | 9 | 8 | 8 | 8 | 8 | 8 | 8 | 8 | 121.88 |
| Germany | 11.2 | 11.3 | 11.3 | 12. | 12.2 | 11.8 | 12.4 | 12.9 | 12.9 | 12.7 | 113.39 |
| Estonia | 19.1 | 14.6 | 10.9 | 11.3 | 11.6 | 12.4 | 13.5 | 15.6 | 15.6 | 15.1 | 79.06 |
| Ireland | 1.8 | 1.7 | 2. | 1.9 | 1.7 | 1.7 | 1.6 | 1.6 | 1.7 | 2. | 111.11 |
| Greece | 1.9 | 1.8 | 1.4 | 1.9 | 2.3 | 2.8 | 3.3 | 4.1 | 4.4 | 3.4 | 178.95 |
| Spain | 9.8 | 8.9 | 7.7 | 7.5 | 8.2 | 8.8 | 9. | 9.6 | 9.3 | 8. | 81.63 |
| France | 16.9 | 17.3 | 17.8 | 18.7 | 19.4 | 18.8 | 19.7 | 20. | 19.2 | 19.8 | 117.16 |
| Croatia | 3.6 | 3.9 | 4.8 | 4.6 | 4.6 | 5.2 | 5. | 5.2 | 5.7 | 5.7 | 158.33 |
| Italy | 13.9 | 16. | 16.1 | 17.2 | 17.8 | 18.4 | 18.8 | 19.5 | 20.6 | 18.4 | 132.37 |
| Cyprus | 2 | 2 | 2 | 2 | 2 | 2 | 3 | 3 | 4 | 3 | 140.00 |
| Latvia | 1.3 | 3.8 | 5.3 | 5.3 | 6.5 | 5.4 | 4.7 | 4.3 | 5.1 | 6.2 | 476.92 |
| Lithuania | 3.8 | 3.1 | 3.7 | 4.1 | 4.6 | 4.5 | 4.3 | 3.9 | 4. | 4. | 105.26 |
| Luxembourg | 18.5 | 15.4 | 11.3 | 9.7 | 7.1 | 10.6 | 10.8 | 10.5 | 9.9 | 3.8 | 20.54 |
| Hungary | 6.1 | 6.2 | 5.4 | 5.8 | 6.5 | 6.9 | 7. | 7.3 | 5.2 | 6.8 | 111.48 |
| Malta | 3.9 | 6.3 | 6.4 | 4.6 | 4.2 | 6.5 | 8.3 | 7.7 | 13.3 | 11.4 | 292.31 |
| Netherlands | 26.5 | 27.1 | 26.6 | 25.8 | 28.5 | 29.7 | 28.9 | 30. | 30. | 33.8 | 127.55 |
| Austria | 7.5 | 8.7 | 9.6 | 10.7 | 11.2 | 11.4 | 11.1 | 11.5 | 10.8 | 12.3 | 164.00 |
| Poland | 10.6 | 11.8 | 12.6 | 11.6 | 10.2 | 9.9 | 9.8 | 10.3 | 7.5 | 9.1 | 85.85 |
| Portugal | 2. | 2.5 | 2.4 | 2.1 | 2.1 | 2. | 2.2 | 2.3 | 2.3 | 2.5 | 125.00 |
| Romania | 2.6 | 2.5 | 2.1 | 1.7 | 1.7 | 1.7 | 1.5 | 1.3 | 1.5 | 1.4 | 53.85 |
| Slovenia | 9.3 | 9.3 | 8.5 | 8.6 | 8.7 | 9.8 | 10. | 11.4 | 9.9 | 11. | 118.28 |
| Slovakia | 4.1 | 4.6 | 4.8 | 5.1 | 5.3 | 5. | 4.9 | 6.4 | 10.5 | 8.3 | 202.44 |
| Finland | 15.3 | 10.1 | 7.3 | 6.4 | 5.3 | 5.6 | 5.9 | 6.3 | 5.9 | 2. | 13.07 |
| Sweden | 8.2 | 7.2 | 6.4 | 6.7 | 6.8 | 6.7 | 6.6 | 6.5 | 6.8 | 6.6 | 80.49 |
Recycling rate of municipal waste in the EU and other Countries in 2008–2021 (%)
| Specification | 2012 | 2013 | 2014 | 2015 | 2016 | 2017 | 2018 | 2019 | 2020 | 2021 | Change 2012=100 |
|---|---|---|---|---|---|---|---|---|---|---|---|
| EU | 40.9 | 41.5 | 43.4 | 44.9 | 45.9 | 46.3 | 46.4 | 47.2 | 49.2 | 49.6 | 121.27 |
| Belgium | 53.4 | 52.8 | 53.8 | 53.5 | 53.5 | 53.9 | 54.4 | 54.7 | 51.4 | 53.3 | 99.81 |
| Bulgaria* | 25 | 28.5 | 23.1 | 29.4 | 31.8 | 34.6 | 31.5 | 34.6 | 65.5 | : | 262.00 |
| Czechia | 23.2 | 24.2 | 25.4 | 29.7 | 33.6 | 32.1 | 32.2 | 33.3 | 40.5 | 43.3 | 186.64 |
| Denmark | 42.5 | 43.3 | 45.4 | 47.4 | 48.3 | 47.6 | 49.9 | 51.5 | 45 | 34.3 | 80.71 |
| Germany | 65.2 | 63.8 | 65.6 | 66.7 | 67.1 | 67.2 | 67.1 | 66.7 | 70.3 | 71.1 | 109.05 |
| Estonia | 19.1 | 17.6 | 31.1 | 28.3 | 27.9 | 28.2 | 28 | 30.8 | 28.9 | 30.3 | 158.64 |
| Ireland* | 36.6 | : | 39.8 | : | 40.7 | 40.4 | 37.7 | 37.4 | 40.8 | : | 111.48 |
| Greece* | 17 | 15.8 | 15.4 | 15.8 | 17.2 | 18.9 | 20.1 | 21 | : | : | 123.53 |
| Spain | 29.8 | 32.5 | 30.8 | 30 | 33.9 | 36.1 | 34.8 | 38 | 40.5 | 36.7 | 123.15 |
| France | 37.7 | 38.7 | 39.7 | 40.7 | 39.7 | 40.2 | 40.7 | 41 | 41.7 | 45.1 | 119.63 |
| Croatia | 14.7 | 14.9 | 16.4 | 18 | 21 | 23.6 | 25.3 | 30.2 | 29.5 | 31.4 | 213.61 |
| Italy | 38.4 | 39.4 | 41.6 | 44.3 | 45.9 | 47.8 | 49.8 | 51.4 | 51.4 | : | 133.85 |
| Cyprus | 12.5 | 13.9 | 14.8 | 16.6 | 16.1 | 16 | 16.7 | 16.6 | 16.6 | 15.3 | 122.40 |
| Latvia | 14.6 | 25.9 | 27 | 28.7 | 25.2 | 24.8 | 25.2 | 41 | 39.7 | 44.1 | 302.05 |
| Lithuania | 23.5 | 27.8 | 30.5 | 33.2 | 48 | 48.1 | 52.6 | 49.7 | 45.3 | 44.3 | 188.51 |
| Luxembourg | 47.4 | 46.3 | 47.7 | 47.4 | 49.2 | 48.9 | 49 | 48.9 | 52.8 | 55.3 | 116.67 |
| Hungary | 25.5 | 26.4 | 30.5 | 32.2 | 34.7 | 35 | 37.4 | 35.9 | 32 | 34.9 | 136.86 |
| Malta | 14.8 | 12.5 | 11.7 | 10.9 | 12.7 | 11.5 | 10.4 | 9.1 | 10.9 | 13.6 | 91.89 |
| Netherlands | 49.4 | 49.8 | 50.9 | 51.8 | 53.5 | 54.6 | 55.9 | 56.9 | 56.9 | 57.8 | 117.00 |
| Austria* | 57.7 | 57.7 | 56.3 | 56.9 | 57.6 | 57.8 | 57.7 | 58.2 | 62.3 | : | 107.97 |
| Poland | 12 | 15.1 | 26.5 | 32.5 | 34.8 | 33.8 | 34.3 | 34.1 | 38.7 | 40.3 | 335.83 |
| Portugal | 26.1 | 25.8 | 30.4 | 29.8 | 30.9 | 29.1 | 29.1 | 28.9 | 26.8 | 30.5 | 116.86 |
| Romania | 14.8 | 13.2 | 13.1 | 13.3 | 13.4 | 14 | 11.1 | 11.5 | 11.9 | 11.3 | 76.35 |
| Slovenia | 42.1 | 34.8 | 36 | 54.1 | 55.5 | 57.8 | 58.9 | 59.2 | 59.3 | 60 | 142.52 |
| Slovakia | 13.4 | 10.8 | 10.4 | 14.9 | 23 | 29.8 | 36.3 | 38.5 | 45.3 | 48.9 | 364.93 |
| Finland | 33.3 | 32.5 | 32.5 | 40.6 | 42.1 | 40.5 | 42.3 | 43.5 | 42.2 | 37.1 | 111.41 |
| Sweden | 46.9 | 48.2 | 49.3 | 47.6 | 48.4 | 46.8 | 45.8 | 46.6 | 38.3 | 39.5 | 84.22 |
| Iceland* | 28 | 29.9 | 29.7 | 0 | 0 | 0 | 0 | : | 26.2 | : | 93.57 |
| Norway | 39.8 | 39.2 | 42.2 | 42.8 | 38.2 | 38.8 | 40.7 | 40.9 | 41 | 38.2 | 95.98 |
| Switzerland | 50 | 51 | 53.5 | 52.7 | 52.5 | 52.5 | 52.5 | 53 | 52.8 | 53.3 | 106.60 |
| UK* | 42.6 | 43.2 | 43.4 | 43.3 | 44 | 43.8 | 44.1 | : | : | : | 103.52 |
Total employment in CE sectors in the EU and other countries (2012–2021, %)
| Specifcation | 2012 | 2013 | 2014 | 2015 | 2016 | 2017 | 2018 | 2019 | 2020 | 2021 | Change 2012 = 100 |
|---|---|---|---|---|---|---|---|---|---|---|---|
| 1 | 2 | 3 | 4 | 5 | 6 | 7 | 8 | 9 | 10 | 11 | 12 |
| EU | 1.9 | 1.9 | 2. | 1.9 | 2. | 2. | 2. | 2. | 2.1 | 2.1 | 110.53 |
| Belgium | 1.4 | 1.4 | 1.3 | 1.4 | 1.3 | 1.3 | 1.3 | 1.3 | 1.3 | 1.3 | 92.86 |
| Bulgaria | 1.5 | 1.4 | 1.4 | 1.4 | 1.5 | 1.5 | 1.5 | 1.5 | 1.5 | 1.5 | 100.00 |
| Czechia | 2.4 | 2.3 | 2.2 | 2.3 | 2.3 | 2.3 | 2.2 | 2.3 | 2.3 | 2.3 | 95.83 |
| Denmark | 1.2 | 1.2 | 1.2 | 1.2 | 1.2 | 1.2 | 1.2 | 1.2 | 1.2 | 1.2 | 100.00 |
| Germany | 1.5 | 1.4 | 1.5 | 1.5 | 1.6 | 1.6 | 1.7 | 1.6 | 1.7 | 1.7 | 113.33 |
| Estonia | 1.8 | 1.9 | 2. | 2. | 1.9 | 1.9 | 2.1 | 2. | 2.2 | 2.2 | 122.22 |
| Ireland | 1.2 | 1.3 | 1.3 | 1.3 | 1.3 | 1.4 | 1.4 | 1.4 | 1.5 | 1.4 | 116.67 |
| Greece | 1.4 | 1.3 | 1.5 | 1.3 | 1.5 | 1.4 | 1.5 | 1.5 | 1.3 | 1.3 | 92.86 |
| Spain | 1.9 | 2. | 2. | 2.1 | 2.1 | 2.1 | 2.2 | 2.2 | 2.3 | 2.3 | 121.05 |
| France | 1.8 | 1.8 | 1.8 | 1.7 | 1.7 | 1.9 | 1.8 | 1.8 | 1.8 | 1.8 | 100.00 |
| Croatia | 2.7 | 2.8 | 2.9 | 2.9 | 2.8 | 2.9 | 3.1 | 3.5 | 3. | 3.1 | 114.81 |
| Italy | 2.3 | 2.4 | 2.4 | 2.5 | 2.5 | 2.4 | 2.3 | 2.5 | 2.5 | 2.4 | 104.35 |
| Cyprus | 1.4 | 1.5 | 1.5 | 1.7 | 1.8 | 1.8 | 1.9 | 1.9 | 1.9 | 2. | 142.86 |
| Latvia | 2.4 | 2.4 | 2.6 | 2.6 | 2.7 | 2.6 | 2.5 | 2.4 | 2.7 | 2.8 | 116.67 |
| Lithuania | 2.4 | 2.6 | 2.6 | 2.6 | 2.6 | 2.6 | 2.6 | 2.7 | 2.8 | 2.8 | 116.67 |
| Luxembourg | 0.5 | 0.5 | 0.5 | 0.5 | 0.5 | 0.5 | 0.5 | 0.4 | 0.4 | 0.4 | 80.00 |
| Hungary | 2.8 | 2.5 | 2.2 | 2.4 | 2.5 | 2.5 | 2.6 | 2.3 | 2.3 | 2.3 | 82.14 |
| Malta | 2.5 | 2.4 | 2.3 | 2.2 | 2.3 | 2.1 | 2.1 | 2. | 1.9 | 1.9 | 76.00 |
| Netherlands | 1.1 | 1.1 | 1.1 | 1.1 | 1.1 | 1.1 | 1.1 | 1.1 | 1.1 | 1.1 | 100.00 |
| Austria | 1.1 | 1.2 | 1.1 | 1.1 | 1.1 | 1.1 | 1.1 | 1.1 | 1.1 | 1.1 | 100.00 |
| Poland | 2.5 | 2.6 | 2.5 | 2.6 | 2.6 | 2.6 | 2.6 | 2.7 | 2.7 | 2.7 | 108.00 |
| Portugal | 1.8 | 1.8 | 1.8 | 1.8 | 1.8 | 1.9 | 2. | 1.8 | 1.8 | 1.8 | 100.00 |
| Romania | 1 | 1 | 1 | 1 | 1 | 1 | 1 | 1 | 1 | 1 | 120.00 |
| Slovenia | 1.6 | 1.6 | 1.6 | 1.6 | 1.6 | 1.6 | 1.7 | 2. | 1.5 | 1.5 | 93.75 |
| Slovakia | 2 | 2 | 2 | 2 | 2 | 2 | 2 | 2 | 2 | 2 | 110.00 |
| Finland | 1.7 | 1.7 | 1.7 | 1.7 | 1.6 | 2. | 2.3 | 1.8 | 1.6 | 1.5 | 88.24 |
| Sweden | 1.6 | 1.6 | 1.6 | 1.6 | 1.7 | 1.7 | 1.6 | 1.6 | 1.7 | 1.7 | 106.25 |
| UK* | 1.7 | 1.7 | 1.6 | 1.7 | 1.8 | 1.7 | 1.8 | 1.7 | : | : | 100.00 |