The CE is a systems solution framework that tackles global challenges like climate change, biodiversity loss, waste, and pollution (Ellen Macarthur Foundation, 2023). CE transforms goods at the end of their life into resources for others, reducing waste and energy consumption (Stahel, 2016). Stahel emphasizes the economic and environmental benefits, including a potential reduction in greenhouse-gas emissions and a workforce growth. Moreover, global trends confirm that the CE is a proven way of creating new jobs and boosting economic growth not only in EU but also other countries around the world (Boshkov and Djidrov, 2021). Recently, the CE has drawn attention all over the world as a method to cope with the present model of production and consumption (Hamam et al., 2021). CE has significant environmental, economic, and social benefits on the global scale. It is a paradigm for economic development and a policy initiative. The CE concept attracts increasing attention from governments, scholars, companies, and citizens as a necessary step to achieve sustainable development (Corona et al., 2019). This is evidenced by the recent EU policy (European Commission, 2015), national policy targets, business sectors reports, and the increasing number of scientific articles. CE is an economic system that is based on business models which replace the ‘end-of-life’ concept with reducing, alternatively reusing, and reusing materials in production/distribution and consumption processes, with the aim of accomplishing sustainable development (Kirchherr et al., 2017). Therefore, the CE, as opposed to the current linear economy, is seen as a sustainable economic system. The concepts behind those strategies consist of sustainable and eco-design, energy and material efficiency measures, strategies defined within the three-R’s waste hierarchy (reduce-reuse-recycle), business model innovation, etc. (Reichel et al., 2016). It has been thought that, in Europe alone, the CE could create direct primary-resource benefits. Various policy instruments adopted to promote resource efficiency, eco-design, and waste management exist in several countries (Berg et al., 2018).
One of the main topics regarding CE is the food system. The increasing population and demand for food, inefficient resource use and food distribution, environmental impacts, and high rates of food wasted at all stages of the food system are all desiring for transition through more sustainability. Looking at Figure 5, food production generates various environmental impacts, such as increased CO2 emissions.
The CE has potential to create economic and social benefits such as new employment, opportunities and increased welfare for low-income households and further improvement in trade balances (Ellen Macarthur Foundation, 2023). Current inefficiency in the food economy tells us to lose productivity, energy, and natural resources (Jurgilevich et al., 2016). Changing our food system to one based on the principles of the CE is one of the most important things on the way to sustainability. A CE regarding the food system implies reducing the amount of waste generated in the food system, re-use of food, utilization of by-products, and food waste. Therefore, with the CE, it can build a food system that ensures food never generates waste. CE offers solutions in moving towards a sustainable food system.
Several academic authors have conducted studies on the theory and conceptualization of CE and the development of innovative CE models in the agri-food sector (Esposito et al., 2020). Despite existing literature on CE in the EU, a research gap exists in understanding sector-specific challenges. The purpose of this paper is to provide an insight — particularly on the EU’s concept of CE in the context of a circular food system. Furthermore, in this study, CE principles, the environmental impacts of food, and potential solutions in the food system stages based on relationship of food and the CE will be analyzed for policy recommendations. Integration of environmental and economic aspects within CE practices, impeding a comprehensive understanding of how these initiatives contribute to both environmental sustainability and economic growth, will contribute to the existing gap. Therefore, the additional objective is to understand if the CE could help reduce the environmental impacts of current agri-food economic systems. In addition to this, potential solutions are discussed for food production, consumption, and waste management.
The CE is thought of as a regenerative scheme in which resource inputs, waste, by-products, energy losses, and emissions are reduced by slowing down, closing, and limiting material and energy cycle through more efficient design, maintenance, repair, reuse, durable regeneration, renovation, and recycling (Geissdoerfer et al., 2017). Franceschelli (2018) stated that the extending of sustainable business model innovation in the agro-food sector is essential since the business relates to the environmental and social dimension. Figure 1 shows that CE consists of five different components, namely, design of products and services, production of products and services, trade and logistics, consumption, reuse, repair, and recycle and processing of raw and recycled materials.
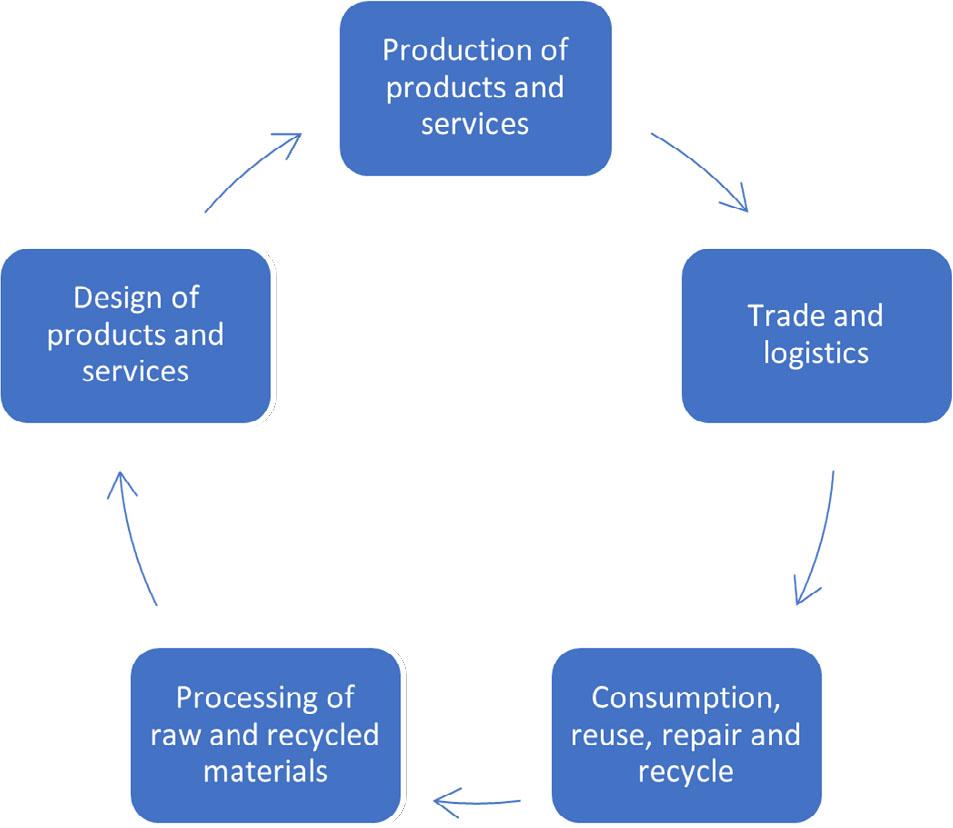
The key components of the circular economy
Source: Berg et al., 2018.
Potential Benefits of Circular Economy’s Implementation:
Minimized pollution, climate emissions, waste, and use of raw materials
Preservation of natural systems
Increased competitiveness
Employment opportunities
Social benefits.
Figure 2 represents the CE system diagram, known as the butterfly diagram, which illustrates the continuous flow of materials in a CE (Ellen Macarthur Foundation, 2023). There are two main cycles – the technical cycle and the biological cycle. In the technical cycle, products and materials are kept in circulation through processes such as reuse, repair, remanufacturing, and recycling. In the biological cycle, the nutrients from biodegradable materials are returned to the Earth to regenerate nature. The main idea is to get the materials and feed them back into the system by recycling. The next level, namely, repair and maintenance, keeps things in use at a higher level, especially if we can catch something before a catastrophic failure that needs, for example, an engine to be remanufactured. Such an engine is a phenomenal piece of equipment that has had millions of hours of R&D put into it and which works effectively. Maximizing how to keep energy and materials in use for as long as possible is also important. Lastly, on the technical side, is sharing – in a sophisticated manner as part of the figure which is related to some of the other loops that are mentioned above. Technical products keep them in use and with the highest value for as long as possible by intelligently designing them. The biological cycle side is quite different, although the principles are very similar. Similarly, regeneration is a critical opportunity: if we can collect all the biological materials like household waste and the food waste of food production and feed them back into the system, then we could regenerate them.
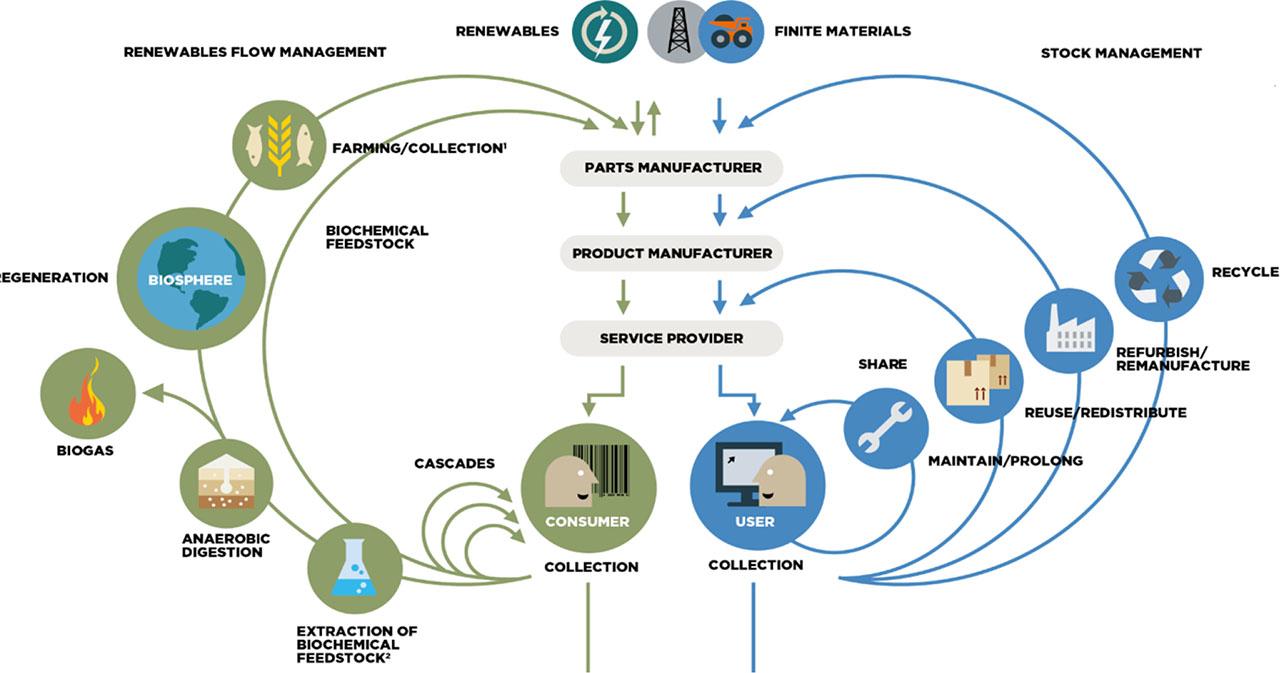
The butterfly diagram: Visualizing the circular economy
Source: Ellen MacArthur Foundation, 2023.
Briefly, CE is made of two different types of technical material on the right side and biological material on the left side (Ellen MacArthur Foundation, 2019). The technical cycle could be anything that does not biodegrade, like metals and most plastics. Consequently, this includes things that we would want to recover within a CE and feedback into the system. It could be through recycling, for example, chemical and physical recycling – anything that does not biodegrade. On the other hand, the biological cycle is the side of the CE that would biodegrade, for instance, anything in food, cotton, wood form, etc. It could be almost anything that would physically biodegrade and return to the soil.
The optimal use of existing natural resources has been a long-standing human research area. The contemporary concept of the CE originated from the integration of ecological economics, environmental economics, and industrial ecology. These disciplines emerged as a response to address the environmental impact caused by industrialized nations (Murray et al., 2015). The discussion of the CE has also grown rapidly, especially at the policy level literature.
Currently, Europe is a founder when it comes to CE policy development. In 2014, the European Commission published its communication towards a CE: a zero-waste program for Europe (European Commission, 2023). In 2015, the European Commission launched an important initiative to support the transition to a more CE in European countries. The EU’s adoption of CE measures in 2015 emphasizes the importance of waste management and recycling (Mashovic et al., 2022). Also, the Commission presented the CE action plan in 2020 with the objective of improving sustainable product design, waste reduction, and consumer empowerment. The EU’s transition to a CE aims to reduce pressure on natural resources and create sustainable growth and jobs. The focused sectors known for their high resource consumption are electronics, plastics, textiles, and construction, among others. In 2021, the Parliament adopted a resolution on the new CE action plan demanding additional measures to achieve a carbon-neutral, environmentally sustainable, toxic-free, and fully circular economy by 2050. This CE action plan is one of the main elements of the European Green Deal, Europe’s new agenda for sustainable growth. Also, a new action plan announces initiatives along the total life cycle of products. It targets how products are designed, promotes CE processes, triggers sustainable consumption, and targets to make sure that waste is prevented, and the resources used are saved in the EU economy for as long as possible (European Commission, 2020). It introduces legislative and non-legislative features targeting areas where action at the EU level brings real added value. Overall, it has been thought that the shift from a linear economic model to a CE has huge potential for sustainable development in the EU and candidate countries, as analyzed in following sections.
The new CE action plan 2020 aims to:
focus on the sectors that use the most resources and where the potential for circularity is high, such as: electronics and ICT, batteries and vehicles, packaging, plastics, textiles, construction and buildings, food, water, and nutrients
ensure less waste
make circularity work for people, regions, and cities
lead global efforts on circular economy.
The main target of the EU is to transition to a CE to make Europe cleaner and more competitive. It aims at accelerating the transformational change required by the European Green Deal, while building on CE actions. Designing sustainable products and empowering consumers by providing cost-saving opportunities and circularity in production processes are key components of the EU’s sustainable product policy framework in this new CE action plan. Up to 80% of products’ environmental impacts are determined at the design phase, as interpreted in Fig. 2 butterfly diagram. Design is the most significant concept that should be emphasized in CE.
The sustainability challenge requires extensive and coordinated actions, which will form an integral part of the sustainable product policy framework outlined in section 2. Those actions will help to alleviate the impacts of climate emergencies and will feed into the EU strategies, such as Farm to Fork. The key product value chains determined by the EU are electronics and ICT, batteries and vehicles, packaging, plastics, textiles, construction and buildings, food, and nutrients.
CE can significantly reduce the negative impacts of resource extraction and use on the environment and contribute to protecting and restoring biodiversity in Europe. Biological resources are a key input to the economy of the EU and will play an even more important role in the future. Thus, the biological side of the CE butterfly diagram (Fig. 2) is substantial to maintain the sustainability of renewable bio-based materials, including through actions following the Bioeconomy Strategy and Action Plan.
While the food value chain accounts for significant resources and environmental pressures, roughly 20% of the total food produced is lost or wasted in the EU. Therefore, along with the Sustainable Development Goals and data review of CE thematic areas and indicators especially about ‘waste’ in section 3, the Commission will propose a target on food waste reduction as a key action under the forthcoming EU Farm-to-Fork Strategy, which will comprehensively address the food value chain.
Stahel (2016) emphasizes the potential environmental advantages of CE, suggesting a possible 70% decrease in greenhouse gas emissions. One-quarter of the world’s greenhouse gas emissions result from food and agriculture (Ritchie, 2019). The global food system, which encompasses production and post-farm processes such as processing and distribution, is a key contributor to emissions. Food is responsible for approximately 26% of global GHG emissions. Half of the world’s habitable land is used for agriculture. Habitable land is land that is ice- and desert-free. 70% of global freshwater withdrawals are used for agriculture. Tackling what people eat and how we produce our food plays a key role in tackling climate change, reducing water stress and pollution, restoring lands back to forests or grasslands, and protecting the world’s wildlife (Ritchie, 2019). Thus, food production is responsible for one-quarter of the world’s greenhouse gas emissions. Figure 3 summarizes food’s share of total emissions and breaks it down by source (Poore and Nemecek, 2018).
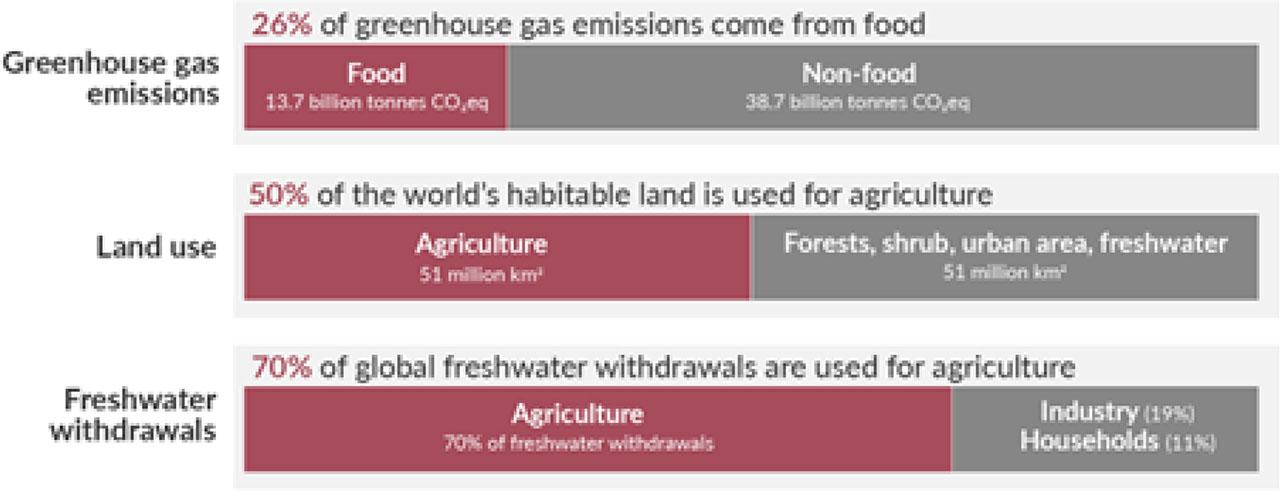
The environmental impacts of food and agriculture (World)
Source: Ritchie et al., 2022.
There are four main contributors to food’s emissions. These are shown by category in Fig. 4.
Livestock & fisheries account for 31% of food emissions: Livestock – animals raised for meat, dairy, eggs, and seafood production – contribute to emissions in several ways, such as methane from cattle by enteric fermentation.
Crop production accounts for 27% of food emissions: 21% of food’s emissions come from crop production for direct human consumption, and 6% comes from the production of animal feed.
Land use accounts for 24% of food emissions: twice as many emissions results from land use for livestock: 16% for crops and 8% for human consumption. Land use refers to the sum of land use change, savannah burning, and organic soil cultivation.
Supply chains account for 18% of food emissions: whilst supply chain emissions may seem high at 18%, they are essential for reducing emissions by preventing food waste. Food waste emissions are large: one-quarter of emissions from food production end up as wastage either from supply chain losses or consumers. Durable packaging, refrigeration, and food processing can all help to prevent food waste.
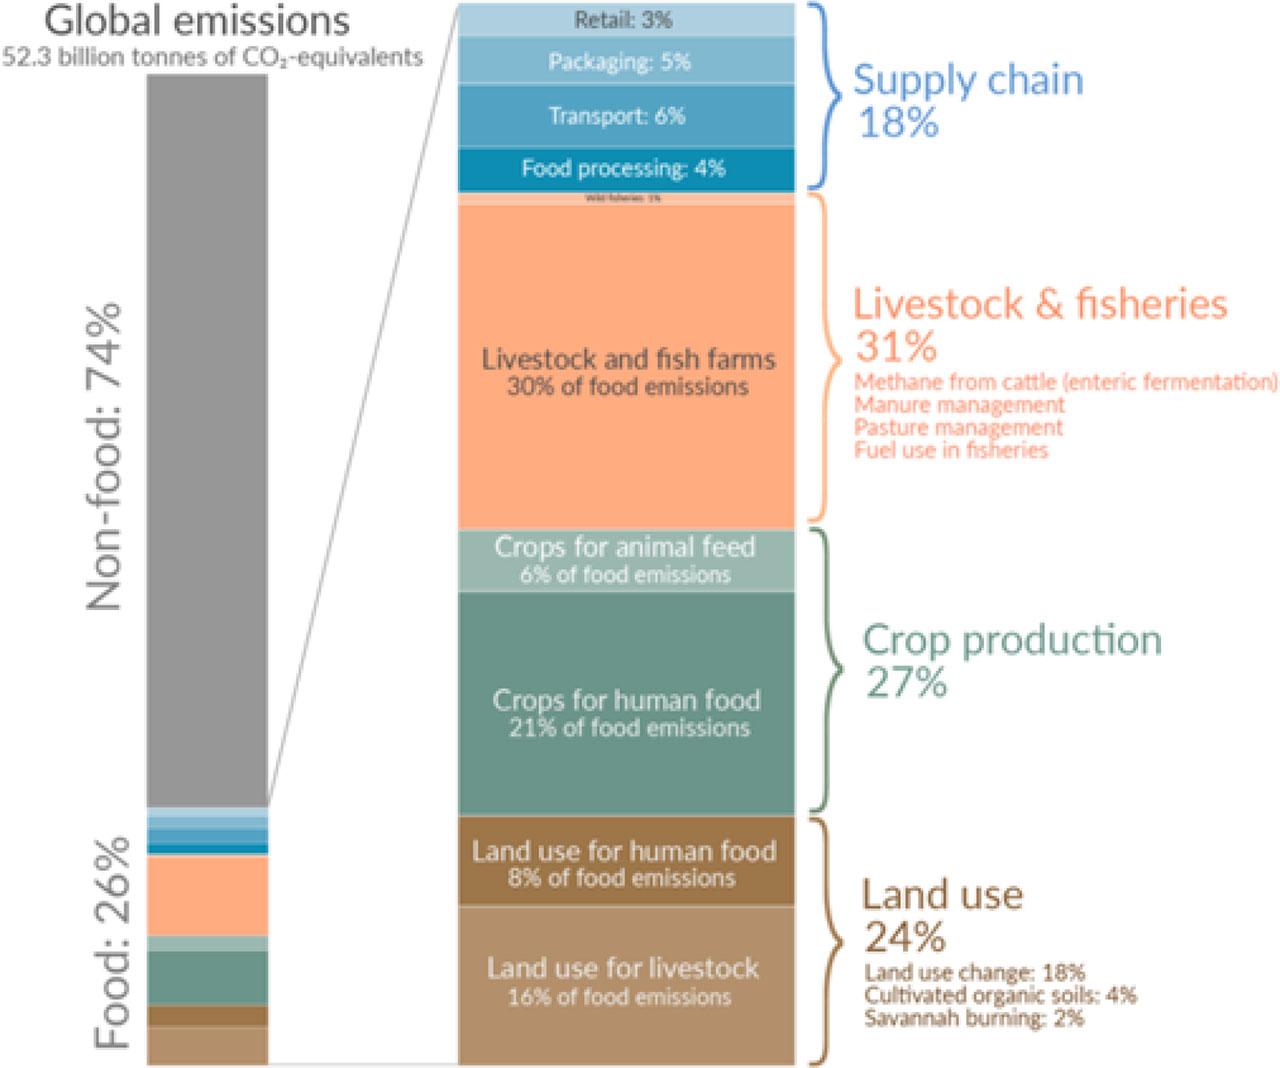
The global greenhouse gas emissions from food production (world)
Source: Ritchie et al., 2022.
Reducing emissions from food production will be one of greatest challenges in the coming decades. For example, it is essential to input, such as fertilizers, to meet growing food demands. Another solution would be changes to diets, food waste reduction, improvements in agricultural efficiency, and technologies that make low-carbon food alternatives scalable and affordable.
Looking at Fig. 5, certain types of meats such as beef and lamb produce carbon dioxide more than any others.
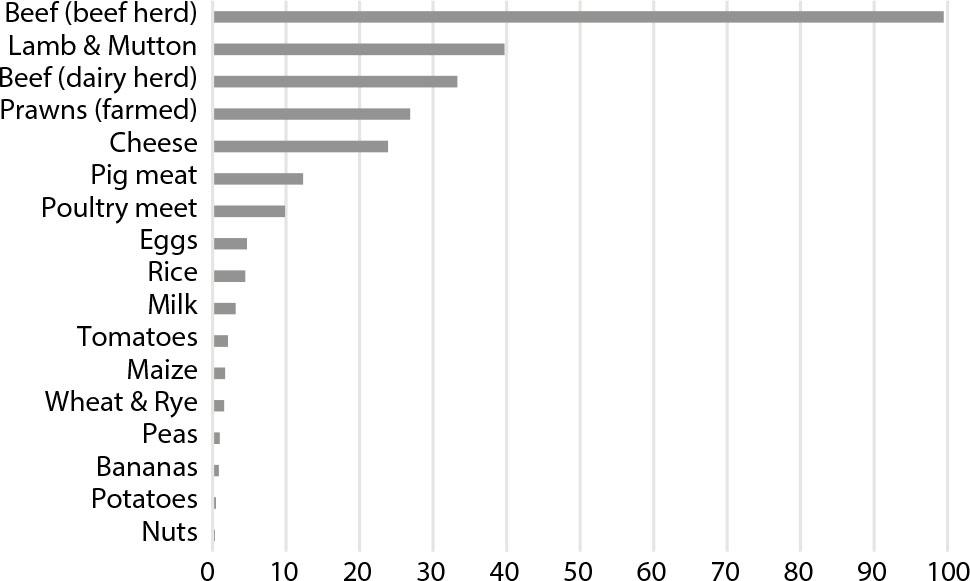
Greenhouse gas emissions per kilogram of food product (world)
Emissions are measured in carbon dioxide-equivalents. This means non-CO2 gases are weighted by the amount of warming they cause over a 100-year period.
Source: Ritchie et al., 2022.
The CE is based on three principles, driven by design:
Eliminate waste and pollution,
Circulate products and materials,
Regenerate nature.
There are 5 thematic areas that are emphasized by EU policy in terms of CE: production and consumption, waste management, secondary raw materials and competitiveness, innovation, and lastly, global sustainability and resilience. In this study, we will analyze the first four with one of their sub-indicators to understand and conceptualize CE in terms of EU frameworks. Definitions of thematic areas and used indicators are explained in Table 1 before analyzing chosen indicators more deeply in the results section.
Waste generation is one of the important sub-indicators to analyze production and consumption. The indicator is defined as total waste generated in a country including major mineral wastes, divided by the average population of the country.
Recycling rate of municipal waste is one of the used sub-indicators to analyze waste management. The indicator measures the share of recycled municipal waste in the total municipal waste generation. Recycling includes material recycling, composting, and anaerobic digestion. The ratio is expressed in percent (%) as both terms are measured in the same unit, namely tons.
Circular material use rate measures the share of material recycled and feeds back into the economy – thus saving extraction of primary raw materials – in overall material use. The circular material use, also known as circularity rate, is defined as the ratio of the circular use of materials to the overall material use. The overall material use is measured by summing up the aggregate domestic material consumption (DMC) and the circular use of materials. DMC is defined in economy-wide material flow accounts.
Persons employed in CE sub-indicator is measured as “Number of persons employed” in the following three sectors: the recycling sector, repair and reuse sector, and rental and leasing sector. First, the trendline of the indicator in Figure 6 will be presented and then the values will be analyzed country by country.
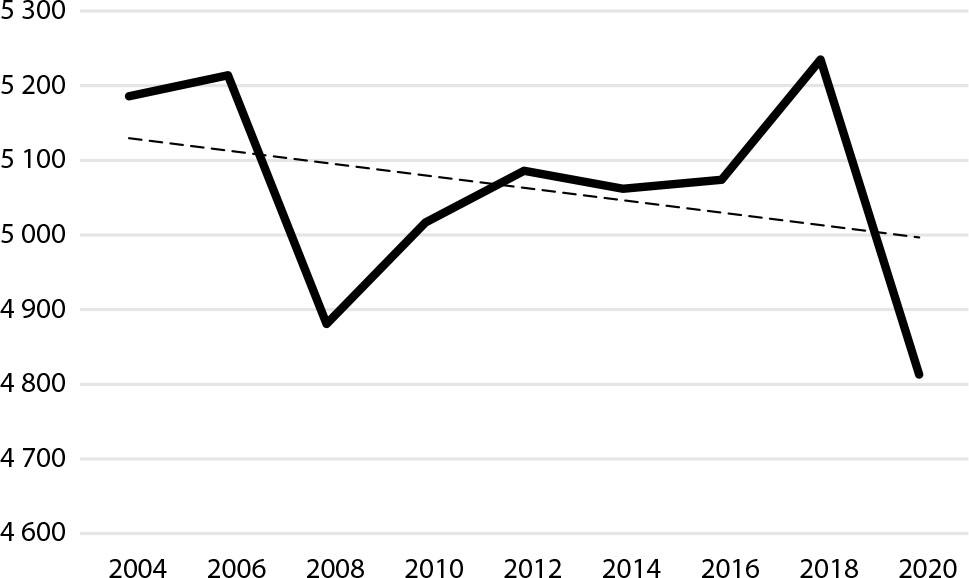
Trendline of waste generation kg per capita in the European Union (2004–2020)
Source: Eurostat, 2023.
Information of thematic areas and chosen indicators used
| Name of thematic areas | Name of chosen indicators | Relevance of indicator | Unit of measure | Frequency of dissemination |
|---|---|---|---|---|
| Production and consumption | Waste generation per capita | The indicator is part of the CE monitoring framework. Minimizing the generation of waste is a key part of the CE Action Plan. | Kilogram per capita | Every 2 years |
| Waste management | Recycling rate of municipal rate | The indicator measures the share of recycled municipal waste in the total municipal waste generation. It gives an indication of how waste from final consumers is used as a resource in the CE. | Percentage | Every year |
| Secondary raw materials | Circular material use rate | Circular material use is defined as the ratio of the circular use of materials to the overall material use. The indicator measures the share of material recycled and fed back into the economy. | Percentage of total material use | Every year |
| Competitiveness and innovation | Persons employed in CE | The indicator measures “Number of persons employed” in the following three sectors: the recycling sector, repair and reuse sector and rental and leasing sector. | Percentage of total employment | Every year |
Source: own elaboration.
In the tables, dynamic analysis is used to interpret the change in terms of percentage. A basic formula was used as follows:
x1 – refers to initial year, which is 2012
x2 – refers to last year, which is 2021 or 2020.
This way, the study will help to interpret yearly changes with the ‘change 2012=100’ row in the afore-mentioned tables.
The average values and the trendline can be seen in Figure 6.
Average waste generation per capita is between approximately 4800 and 5200 kgs in the EU. There is a downward trendline over the years and sharp decreasing after the years 2008 (the financial crisis) and 2020 (COVID-19 Pandemic). Notably, the sudden rise in waste generation after 2008 until 2012 may be due to increased industrial activities before or during that period. The period between 2012 and 2020 indicates a decline in waste generation, suggesting potential positive impacts from implemented environmental policies.
While Bulgaria, Estonia, Luxembourg, Finland, and Sweden have the highest waste generation per capita values, candidate countries such as Türkiye and other EU states like Hungary, Portugal, Spain, Croatia, and Latvia have the lowest values. Looking at Poland in the table, it is mostly steady, especially after 2010 (Table 2). An increase in waste generation in the mentioned countries signals potential concerns about their waste management infrastructure. Comparing waste generation amounts between EU countries and non-EU countries shows the importance of cross-border collaboration to address common environmental challenges.
Waste generation kg per capita in the EU and other countries (every 2 years 2004–2020)
| Specification | 2012 | 2014 | 2016 | 2018 | 2020 | Change 2012 = 100 |
|---|---|---|---|---|---|---|
| 1 | 2 | 3 | 4 | 5 | 6 | 7 |
| EU | 5.086 | 5.062 | 5.074 | 5.235 | 4.813 | 94.63 |
| Belgium | 4.847 | 5.171 | 5.573 | 5.967 | 5.899 | 121.70 |
| Bulgaria | 22.072 | 24.872 | 16.907 | 18.470 | 16.785 | 76.05 |
| Czechia | 2.205 | 2.223 | 2.402 | 3.560 | 3.598 | 163.17 |
| Denmark | 2.989 | 3.687 | 3.663 | 3.702 | 3.453 | 115.52 |
| Germany | 4.576 | 4.785 | 4.858 | 4.891 | 4.824 | 105.42 |
| Estonia | 16.627 | 16.587 | 18.451 | 17.539 | 12.171 | 73.20 |
| Ireland | 2.764 | 3.256 | 3.207 | 2.874 | 3.248 | 117.51 |
| Greece | 6.549 | 6.404 | 6.712 | 4.215 | 2.705 | 41.30 |
| Spain | 2.535 | 2.378 | 2.774 | 2.945 | 2.230 | 87.97 |
| France | 5.264 | 4.893 | 4.836 | 5.112 | 4.593 | 87.25 |
| Croatia | 846 | 879 | 1.286 | 1.355 | 1.483 | 175.30 |
| Italy | 2.594 | 2.597 | 2.702 | 2.855 | 2.942 | 113.42 |
| Cyprus | 2.171 | 2.321 | 2.897 | 2.646 | 2.488 | 114.60 |
| Latvia | 1.135 | 1.315 | 975 | 920 | 1.501 | 132.25 |
| Lithuania | 1.901 | 2.114 | 2.327 | 2.527 | 2.396 | 126.04 |
| Luxembourg | 15.816 | 12.713 | 17.217 | 14.828 | 14.618 | 92.43 |
| Hungary | 1.644 | 1.688 | 1.624 | 1.879 | 1.648 | 100.24 |
| Malta | 3.467 | 3.849 | 4.287 | 5.173 | 5.823 | 167.96 |
| Netherlands | 7.233 | 7.848 | 8.281 | 8.429 | 7.175 | 99.20 |
| Austria | 5.699 | 6.537 | 7.008 | 7.428 | 7.728 | 135.60 |
| Poland | 4.266 | 4.714 | 4.793 | 4.621 | 4.492 | 105.30 |
| Portugal | 1.271 | 1.381 | 1.427 | 1.546 | 1.612 | 126.83 |
| Romania | 12.432 | 8.871 | 9.012 | 10.425 | 7.338 | 59.03 |
| Slovenia | 2.210 | 2.273 | 2.661 | 3.964 | 3.576 | 161.81 |
| Slovakia | 1.558 | 1.636 | 1.953 | 2.277 | 2.340 | 150.19 |
| Finland | 16.961 | 17.572 | 22.359 | 23.253 | 20.993 | 123.77 |
| Sweden | 16.420 | 17.226 | 14.272 | 13.628 | 14.664 | 89.31 |
| Iceland | 1.651 | 2.490 | 3.182 | 3.667 | 2.895 | 175.35 |
| Liechtenstein* | 12.727 | 15.278 | 13.325 | 11.448 | : | 89.95 |
| Norway | 2.136 | 2.066 | 2.127 | 2.662 | 2.610 | 122.19 |
| UK* | 3.791 | 4.071 | 4.147 | 4.249 | : | 112.08 |
| Montenegro | 1.634 | 1.757 | 2.708 | 1.965 | 2.007 | 122.83 |
| North Macedonia | 4.111 | 1.058 | 688 | 549 | 716 | 17.42 |
| Serbia | 7.640 | 6.890 | 6.937 | 7.319 | 8.502 | 111.28 |
| Türkiye | 896 | 947 | 953 | 1.195 | 1.291 | 144.08 |
| Bosnia and Herz.* | 1.161 | 1.447 | 1.744 | 1.930 | : | 166.24 |
| Kosovo | 649 | 574 | 1.607 | 1.648 | 1.448 | 223.11 |
The last available values are used for these countries.
Source: Eurostat, 2023.
The trendline of the recycling rate of municipal waste has a positive outcome, with the slope going upward. This is targeted and expected by EU environmental policy. This positive trend in recycling rates indicates a holistic effort toward sustainable waste management practices across the EU. By the end of 2021, the EU has reached almost 50% recycled municipal waste rate in the total municipal waste generation (Fig. 7).
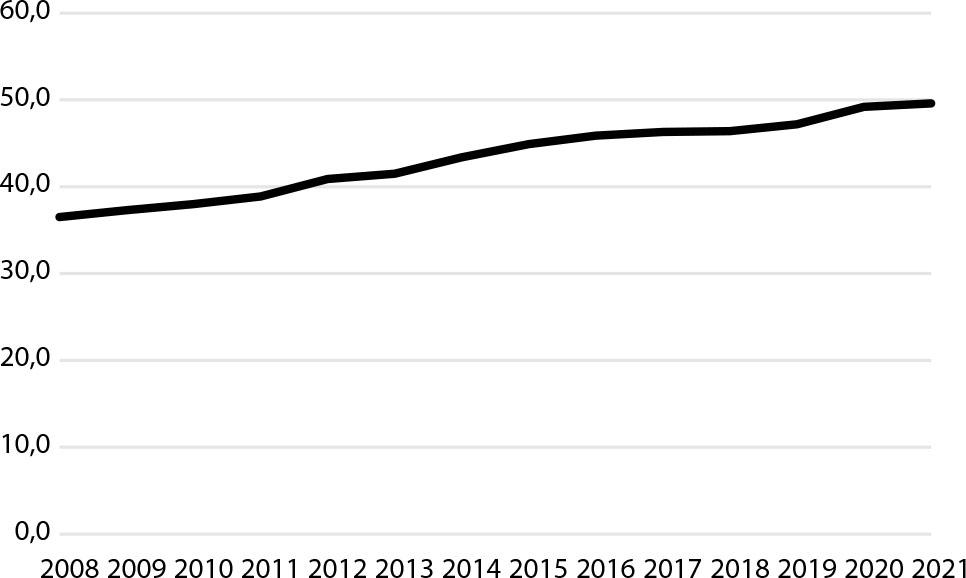
Recycling rate of municipal waste (%) in EU and other countries
Source: Eurostat, 2023.
Germany and Slovenia have the highest percentage of recycling rate of municipal waste. On the other hand, Romania and Malta have the lowest ratios. Bulgaria, Croatia, Latvia, Poland, and Slovakia have the biggest yearly constant value change with over 200. There is an opportunity for knowledge exchange between countries with lower rates to improve their waste management strategies. Table 3 shows the need for standardized practices and regulations across countries to maintain a more integrated approach to recycling on a European scale.
Recycling rate of municipal waste in the EU and other Countries in 2008–2021 (%)
| Specification | 2012 | 2013 | 2014 | 2015 | 2016 | 2017 | 2018 | 2019 | 2020 | 2021 | Change 2012=100 |
|---|---|---|---|---|---|---|---|---|---|---|---|
| EU | 40.9 | 41.5 | 43.4 | 44.9 | 45.9 | 46.3 | 46.4 | 47.2 | 49.2 | 49.6 | 121.27 |
| Belgium | 53.4 | 52.8 | 53.8 | 53.5 | 53.5 | 53.9 | 54.4 | 54.7 | 51.4 | 53.3 | 99.81 |
| Bulgaria* | 25 | 28.5 | 23.1 | 29.4 | 31.8 | 34.6 | 31.5 | 34.6 | 65.5 | : | 262.00 |
| Czechia | 23.2 | 24.2 | 25.4 | 29.7 | 33.6 | 32.1 | 32.2 | 33.3 | 40.5 | 43.3 | 186.64 |
| Denmark | 42.5 | 43.3 | 45.4 | 47.4 | 48.3 | 47.6 | 49.9 | 51.5 | 45 | 34.3 | 80.71 |
| Germany | 65.2 | 63.8 | 65.6 | 66.7 | 67.1 | 67.2 | 67.1 | 66.7 | 70.3 | 71.1 | 109.05 |
| Estonia | 19.1 | 17.6 | 31.1 | 28.3 | 27.9 | 28.2 | 28 | 30.8 | 28.9 | 30.3 | 158.64 |
| Ireland* | 36.6 | : | 39.8 | : | 40.7 | 40.4 | 37.7 | 37.4 | 40.8 | : | 111.48 |
| Greece* | 17 | 15.8 | 15.4 | 15.8 | 17.2 | 18.9 | 20.1 | 21 | : | : | 123.53 |
| Spain | 29.8 | 32.5 | 30.8 | 30 | 33.9 | 36.1 | 34.8 | 38 | 40.5 | 36.7 | 123.15 |
| France | 37.7 | 38.7 | 39.7 | 40.7 | 39.7 | 40.2 | 40.7 | 41 | 41.7 | 45.1 | 119.63 |
| Croatia | 14.7 | 14.9 | 16.4 | 18 | 21 | 23.6 | 25.3 | 30.2 | 29.5 | 31.4 | 213.61 |
| Italy | 38.4 | 39.4 | 41.6 | 44.3 | 45.9 | 47.8 | 49.8 | 51.4 | 51.4 | : | 133.85 |
| Cyprus | 12.5 | 13.9 | 14.8 | 16.6 | 16.1 | 16 | 16.7 | 16.6 | 16.6 | 15.3 | 122.40 |
| Latvia | 14.6 | 25.9 | 27 | 28.7 | 25.2 | 24.8 | 25.2 | 41 | 39.7 | 44.1 | 302.05 |
| Lithuania | 23.5 | 27.8 | 30.5 | 33.2 | 48 | 48.1 | 52.6 | 49.7 | 45.3 | 44.3 | 188.51 |
| Luxembourg | 47.4 | 46.3 | 47.7 | 47.4 | 49.2 | 48.9 | 49 | 48.9 | 52.8 | 55.3 | 116.67 |
| Hungary | 25.5 | 26.4 | 30.5 | 32.2 | 34.7 | 35 | 37.4 | 35.9 | 32 | 34.9 | 136.86 |
| Malta | 14.8 | 12.5 | 11.7 | 10.9 | 12.7 | 11.5 | 10.4 | 9.1 | 10.9 | 13.6 | 91.89 |
| Netherlands | 49.4 | 49.8 | 50.9 | 51.8 | 53.5 | 54.6 | 55.9 | 56.9 | 56.9 | 57.8 | 117.00 |
| Austria* | 57.7 | 57.7 | 56.3 | 56.9 | 57.6 | 57.8 | 57.7 | 58.2 | 62.3 | : | 107.97 |
| Poland | 12 | 15.1 | 26.5 | 32.5 | 34.8 | 33.8 | 34.3 | 34.1 | 38.7 | 40.3 | 335.83 |
| Portugal | 26.1 | 25.8 | 30.4 | 29.8 | 30.9 | 29.1 | 29.1 | 28.9 | 26.8 | 30.5 | 116.86 |
| Romania | 14.8 | 13.2 | 13.1 | 13.3 | 13.4 | 14 | 11.1 | 11.5 | 11.9 | 11.3 | 76.35 |
| Slovenia | 42.1 | 34.8 | 36 | 54.1 | 55.5 | 57.8 | 58.9 | 59.2 | 59.3 | 60 | 142.52 |
| Slovakia | 13.4 | 10.8 | 10.4 | 14.9 | 23 | 29.8 | 36.3 | 38.5 | 45.3 | 48.9 | 364.93 |
| Finland | 33.3 | 32.5 | 32.5 | 40.6 | 42.1 | 40.5 | 42.3 | 43.5 | 42.2 | 37.1 | 111.41 |
| Sweden | 46.9 | 48.2 | 49.3 | 47.6 | 48.4 | 46.8 | 45.8 | 46.6 | 38.3 | 39.5 | 84.22 |
| Iceland* | 28 | 29.9 | 29.7 | 0 | 0 | 0 | 0 | : | 26.2 | : | 93.57 |
| Norway | 39.8 | 39.2 | 42.2 | 42.8 | 38.2 | 38.8 | 40.7 | 40.9 | 41 | 38.2 | 95.98 |
| Switzerland | 50 | 51 | 53.5 | 52.7 | 52.5 | 52.5 | 52.5 | 53 | 52.8 | 53.3 | 106.60 |
| UK* | 42.6 | 43.2 | 43.4 | 43.3 | 44 | 43.8 | 44.1 | : | : | : | 103.52 |
The last available values are used for these countries.
Source: Eurostat, 2023.
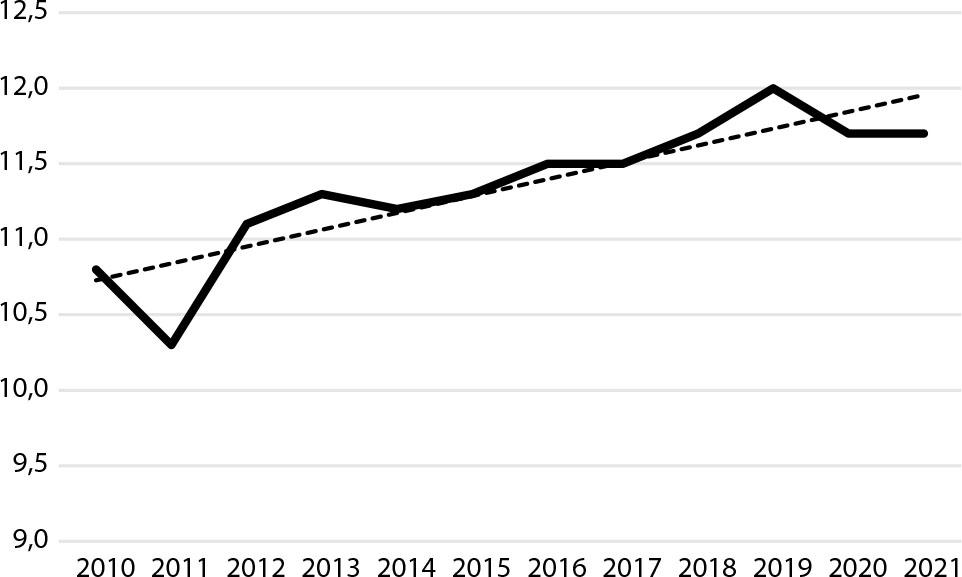
A higher circularity rate value indicates that more secondary materials substitute for primary raw materials, thus reducing the environmental impacts of extracting primary material. Figure 8 shows that the circular materials use rate has been rising, despite a sharp fall between 2010 and 2011. This sharp decline raises questions about potential external factors affecting material use strategies. The trendline slope is upward and there is stability after 2020.
Circular material use rate in EU and other countries (%)
Source: Eurostat, 2023.
Netherlands has the highest ratio by far, with 33.8%. Germany, Estonia, France, and Italy’s rates are above the EU countries average. Poland’s used ratio of circular material was 10.3%, 7.5%, and 9.1%, respectively, between 2019 and 2021 (Table 4). Between the years 2012 and 2021, most of the EU countries have achieved an increase in their circular material use rate except these countries: Estonia Spain, Luxembourg, Poland, Romania, Finland, and Sweden.
Circular material use rate in the European Union and other countries (2010–2021, %)
| Specification | 2012 | 2013 | 2014 | 2015 | 2016 | 2017 | 2018 | 2019 | 2020 | 2021 | Change 2012=100 |
|---|---|---|---|---|---|---|---|---|---|---|---|
| 1 | 2 | 3 | 4 | 5 | 6 | 7 | 8 | 9 | 10 | 11 | 12 |
| EU | 11.1 | 11.3 | 11.2 | 11.3 | 11.5 | 11.5 | 11.7 | 12. | 11.7 | 11.7 | 105.41 |
| Belgium | 17 | 17 | 18 | 18 | 18 | 19 | 20 | 24 | 22 | 21 | 121.30 |
| Bulgaria | 1.9 | 2.5 | 2.7 | 3.1 | 4.4 | 3.5 | 2.5 | 2.3 | 5.9 | 4.9 | 257.89 |
| Czechia | 6.3 | 6.7 | 6.8 | 6.9 | 7.5 | 9.1 | 10.5 | 11.3 | 11.6 | 11.4 | 180.95 |
| Denmark | 6 | 8 | 9 | 8 | 8 | 8 | 8 | 8 | 8 | 8 | 121.88 |
| Germany | 11.2 | 11.3 | 11.3 | 12. | 12.2 | 11.8 | 12.4 | 12.9 | 12.9 | 12.7 | 113.39 |
| Estonia | 19.1 | 14.6 | 10.9 | 11.3 | 11.6 | 12.4 | 13.5 | 15.6 | 15.6 | 15.1 | 79.06 |
| Ireland | 1.8 | 1.7 | 2. | 1.9 | 1.7 | 1.7 | 1.6 | 1.6 | 1.7 | 2. | 111.11 |
| Greece | 1.9 | 1.8 | 1.4 | 1.9 | 2.3 | 2.8 | 3.3 | 4.1 | 4.4 | 3.4 | 178.95 |
| Spain | 9.8 | 8.9 | 7.7 | 7.5 | 8.2 | 8.8 | 9. | 9.6 | 9.3 | 8. | 81.63 |
| France | 16.9 | 17.3 | 17.8 | 18.7 | 19.4 | 18.8 | 19.7 | 20. | 19.2 | 19.8 | 117.16 |
| Croatia | 3.6 | 3.9 | 4.8 | 4.6 | 4.6 | 5.2 | 5. | 5.2 | 5.7 | 5.7 | 158.33 |
| Italy | 13.9 | 16. | 16.1 | 17.2 | 17.8 | 18.4 | 18.8 | 19.5 | 20.6 | 18.4 | 132.37 |
| Cyprus | 2 | 2 | 2 | 2 | 2 | 2 | 3 | 3 | 4 | 3 | 140.00 |
| Latvia | 1.3 | 3.8 | 5.3 | 5.3 | 6.5 | 5.4 | 4.7 | 4.3 | 5.1 | 6.2 | 476.92 |
| Lithuania | 3.8 | 3.1 | 3.7 | 4.1 | 4.6 | 4.5 | 4.3 | 3.9 | 4. | 4. | 105.26 |
| Luxembourg | 18.5 | 15.4 | 11.3 | 9.7 | 7.1 | 10.6 | 10.8 | 10.5 | 9.9 | 3.8 | 20.54 |
| Hungary | 6.1 | 6.2 | 5.4 | 5.8 | 6.5 | 6.9 | 7. | 7.3 | 5.2 | 6.8 | 111.48 |
| Malta | 3.9 | 6.3 | 6.4 | 4.6 | 4.2 | 6.5 | 8.3 | 7.7 | 13.3 | 11.4 | 292.31 |
| Netherlands | 26.5 | 27.1 | 26.6 | 25.8 | 28.5 | 29.7 | 28.9 | 30. | 30. | 33.8 | 127.55 |
| Austria | 7.5 | 8.7 | 9.6 | 10.7 | 11.2 | 11.4 | 11.1 | 11.5 | 10.8 | 12.3 | 164.00 |
| Poland | 10.6 | 11.8 | 12.6 | 11.6 | 10.2 | 9.9 | 9.8 | 10.3 | 7.5 | 9.1 | 85.85 |
| Portugal | 2. | 2.5 | 2.4 | 2.1 | 2.1 | 2. | 2.2 | 2.3 | 2.3 | 2.5 | 125.00 |
| Romania | 2.6 | 2.5 | 2.1 | 1.7 | 1.7 | 1.7 | 1.5 | 1.3 | 1.5 | 1.4 | 53.85 |
| Slovenia | 9.3 | 9.3 | 8.5 | 8.6 | 8.7 | 9.8 | 10. | 11.4 | 9.9 | 11. | 118.28 |
| Slovakia | 4.1 | 4.6 | 4.8 | 5.1 | 5.3 | 5. | 4.9 | 6.4 | 10.5 | 8.3 | 202.44 |
| Finland | 15.3 | 10.1 | 7.3 | 6.4 | 5.3 | 5.6 | 5.9 | 6.3 | 5.9 | 2. | 13.07 |
| Sweden | 8.2 | 7.2 | 6.4 | 6.7 | 6.8 | 6.7 | 6.6 | 6.5 | 6.8 | 6.6 | 80.49 |
Source: Eurostat, 2023.
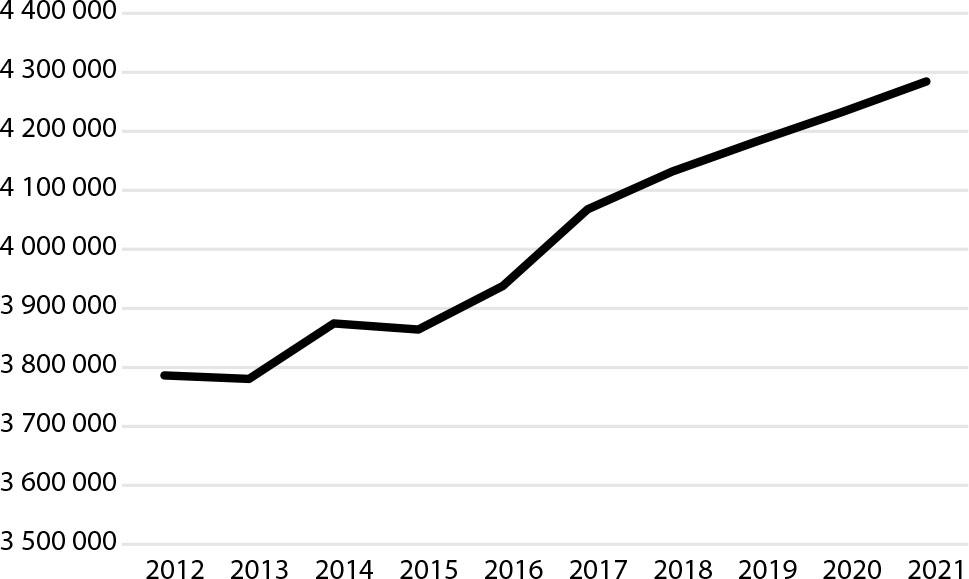
Looking at Figure 9, the number of persons employed in CE sectors has been increasing, particularly after the publication of the EU zero-waste policy in 2014. This surge aligns with the EU’s ambitious goal of generating an additional 700,000 jobs by 2030 through the mentioned comprehensive CE Action Plan.
Persons employed in circular economy sectors in EU and other countries
Source: Eurostat, 2023.
Examining the employment percentages in CE sectors, Czechia, Croatia, Latvia, Lithuania, and Poland emerge as notable leaders. Contrastingly, Luxembourg has the lowest value, with only 0.4 percentage (Table 5). The incremental changes across the years highlight the sector’s resilience, steadily contributing to employment opportunities across the EU. This current and possible future expansion in the workforce should be underscored as an important economic advantage.
Total employment in CE sectors in the EU and other countries (2012–2021, %)
| Specifcation | 2012 | 2013 | 2014 | 2015 | 2016 | 2017 | 2018 | 2019 | 2020 | 2021 | Change 2012 = 100 |
|---|---|---|---|---|---|---|---|---|---|---|---|
| 1 | 2 | 3 | 4 | 5 | 6 | 7 | 8 | 9 | 10 | 11 | 12 |
| EU | 1.9 | 1.9 | 2. | 1.9 | 2. | 2. | 2. | 2. | 2.1 | 2.1 | 110.53 |
| Belgium | 1.4 | 1.4 | 1.3 | 1.4 | 1.3 | 1.3 | 1.3 | 1.3 | 1.3 | 1.3 | 92.86 |
| Bulgaria | 1.5 | 1.4 | 1.4 | 1.4 | 1.5 | 1.5 | 1.5 | 1.5 | 1.5 | 1.5 | 100.00 |
| Czechia | 2.4 | 2.3 | 2.2 | 2.3 | 2.3 | 2.3 | 2.2 | 2.3 | 2.3 | 2.3 | 95.83 |
| Denmark | 1.2 | 1.2 | 1.2 | 1.2 | 1.2 | 1.2 | 1.2 | 1.2 | 1.2 | 1.2 | 100.00 |
| Germany | 1.5 | 1.4 | 1.5 | 1.5 | 1.6 | 1.6 | 1.7 | 1.6 | 1.7 | 1.7 | 113.33 |
| Estonia | 1.8 | 1.9 | 2. | 2. | 1.9 | 1.9 | 2.1 | 2. | 2.2 | 2.2 | 122.22 |
| Ireland | 1.2 | 1.3 | 1.3 | 1.3 | 1.3 | 1.4 | 1.4 | 1.4 | 1.5 | 1.4 | 116.67 |
| Greece | 1.4 | 1.3 | 1.5 | 1.3 | 1.5 | 1.4 | 1.5 | 1.5 | 1.3 | 1.3 | 92.86 |
| Spain | 1.9 | 2. | 2. | 2.1 | 2.1 | 2.1 | 2.2 | 2.2 | 2.3 | 2.3 | 121.05 |
| France | 1.8 | 1.8 | 1.8 | 1.7 | 1.7 | 1.9 | 1.8 | 1.8 | 1.8 | 1.8 | 100.00 |
| Croatia | 2.7 | 2.8 | 2.9 | 2.9 | 2.8 | 2.9 | 3.1 | 3.5 | 3. | 3.1 | 114.81 |
| Italy | 2.3 | 2.4 | 2.4 | 2.5 | 2.5 | 2.4 | 2.3 | 2.5 | 2.5 | 2.4 | 104.35 |
| Cyprus | 1.4 | 1.5 | 1.5 | 1.7 | 1.8 | 1.8 | 1.9 | 1.9 | 1.9 | 2. | 142.86 |
| Latvia | 2.4 | 2.4 | 2.6 | 2.6 | 2.7 | 2.6 | 2.5 | 2.4 | 2.7 | 2.8 | 116.67 |
| Lithuania | 2.4 | 2.6 | 2.6 | 2.6 | 2.6 | 2.6 | 2.6 | 2.7 | 2.8 | 2.8 | 116.67 |
| Luxembourg | 0.5 | 0.5 | 0.5 | 0.5 | 0.5 | 0.5 | 0.5 | 0.4 | 0.4 | 0.4 | 80.00 |
| Hungary | 2.8 | 2.5 | 2.2 | 2.4 | 2.5 | 2.5 | 2.6 | 2.3 | 2.3 | 2.3 | 82.14 |
| Malta | 2.5 | 2.4 | 2.3 | 2.2 | 2.3 | 2.1 | 2.1 | 2. | 1.9 | 1.9 | 76.00 |
| Netherlands | 1.1 | 1.1 | 1.1 | 1.1 | 1.1 | 1.1 | 1.1 | 1.1 | 1.1 | 1.1 | 100.00 |
| Austria | 1.1 | 1.2 | 1.1 | 1.1 | 1.1 | 1.1 | 1.1 | 1.1 | 1.1 | 1.1 | 100.00 |
| Poland | 2.5 | 2.6 | 2.5 | 2.6 | 2.6 | 2.6 | 2.6 | 2.7 | 2.7 | 2.7 | 108.00 |
| Portugal | 1.8 | 1.8 | 1.8 | 1.8 | 1.8 | 1.9 | 2. | 1.8 | 1.8 | 1.8 | 100.00 |
| Romania | 1 | 1 | 1 | 1 | 1 | 1 | 1 | 1 | 1 | 1 | 120.00 |
| Slovenia | 1.6 | 1.6 | 1.6 | 1.6 | 1.6 | 1.6 | 1.7 | 2. | 1.5 | 1.5 | 93.75 |
| Slovakia | 2 | 2 | 2 | 2 | 2 | 2 | 2 | 2 | 2 | 2 | 110.00 |
| Finland | 1.7 | 1.7 | 1.7 | 1.7 | 1.6 | 2. | 2.3 | 1.8 | 1.6 | 1.5 | 88.24 |
| Sweden | 1.6 | 1.6 | 1.6 | 1.6 | 1.7 | 1.7 | 1.6 | 1.6 | 1.7 | 1.7 | 106.25 |
| UK* | 1.7 | 1.7 | 1.6 | 1.7 | 1.8 | 1.7 | 1.8 | 1.7 | : | : | 100.00 |
Source: Eurostat, 2023.
A circular economy for food will help people and nature thrive. Changing the food system to one based on the principles of the CE is one of the most powerful things people can do to tackle climate change and build biodiversity (Ellen Macarthur Foundation, 2023). It is expected to provide healthy nutritious food. The current food system not only does not work for most of the living people but also for the environment. Industrial farming has turned agriculture into a leading source of GHG and pollution and is driving the extinction of species. Building a better food system would be attainable thanks to regenerating food production and eliminating food waste.
Transitioning to a CE means moving towards a food system that builds natural capital and allows nature to thrive. Regenerative food production means growing food in ways that generate positive outcomes for nature such as healthy and stable soils, improved local biodiversity, improved air, and water quality. It is implemented through practices in local contexts, such as using diverse crop varieties and cover crops, rotational grazing, and agroforestry and results in agricultural land that more closely resembles natural ecosystems like forest and native grassland, providing habitat for a wide range of organisms. The CE can be used to build a food system that ensures food never creates waste. It prevents food waste, redistributes surplus edible food to people who need it and inedible food by-products, and human waste becomes inputs for new products.
Almost half of carbon emissions come from industry, agriculture, and land use, and more than 90% of biodiversity loss is due to the extraction and processing of natural resources. CE examples, not only in the EU but around the world, show how businesses, governments, and cities are transforming the world economy into one that works for people and the environment. Nature-positive food production, more diversity, reduction of food losses, and the transformation of organic by-products into useful materials and products are all key ingredients of a CE for food.
CE offers solutions in moving towards a sustainable food system. The CE aims at using materials as products first, then as re-used/recycled materials, and finally, as energy. Potential solutions are evaluated for food production, consumption, and waste management (Jurgilevich et al., 2016).
I. Food production: Regulation of nutrient flows should be conducted using a cross-sectoral approach, as it affects various users and sectors. Therefore, existing policy packages at the EU level need to be coordinated and comprehensive. On the other hand, localized food systems have the potential to increase environmental sustainability through nutrient cycling and waste reduction. Currently, the EU implements local food strategies, but strengthening local food systems is thought to increase the sustainability of the food systems (European Commission, 2013).
II. Food consumption: Consumers are a vital part of the transition towards CE by making more sustainable preferences and promoting them further. They need to support sustainable policies and experiments, which are the engine of some of the initiatives. For example, promoting sustainable consumption habits through campaigns, awareness, and educational programs are a few of the examples to increase their awareness regarding the topic.
III. Food Waste and Surplus Management: As analyzed in the data review section, waste generation and managing this waste are important components for CE. Nowadays, policies addressing food waste can be seen in the waste management part. Also, studies suggest reducing food surplus throughout the whole food supply chain as a prevention measure for food waste. Concerning food waste, it is extremely significant to differentiate between avoidable and unavoidable food waste, as this clarifies the priorities and ways of management and prevention. This is because prevention is only functional for avoidable food waste, followed by treatment of generated waste through recycling into animal feed and composting.
CE has significant environmental, economic, and social benefits on the global scale. There are different components consisting of CE. The CE concept attracts increasing attention from governments, scholars, companies, and citizens as a necessary step to achieve sustainable development (Corona et al., 2019). This is evidenced by the recent EU policy, national policy targets, business sectors reports, and the increasing number of scientific articles.
As we analyzed in Figure 2, namely the butterfly diagram, CE is made up of two different types of material: technical and biological. The technical cycle was basically anything that does not biodegrade, such as metals and plastics. On the other hand, the biological cycle was the side of the CE that would biodegrade, such as food and cotton. It is significant to distinguish between the two by illustrating them.
Currently, Europe leads when it comes to CE policy development. In 2014, the European Commission published its communication towards a circular economy: a zero-waste program for Europe. The primary aim of the EU is a transition to a circular economy to make Europe cleaner and more competitive. As interpreted in the Figure 2 butterfly diagram, design is the most significant concept that should be emphasized in CE. Designing sustainable products and empowering consumers by providing cost-saving opportunities and circularity in production processes are key components of the EU’s sustainable product policy framework in this new CE action plan. The food value chain has a negative impact for significant resources and environmental pressures in the EU. So, along with the SDGs and this study’s data review of CE thematic areas and indicators especially about ‘waste’, the Commission focused on raising awareness on targets regarding food waste reduction.
Basically, CE is based on three principles, driven by design: eliminate waste and pollution, circulate products and materials, and regenerate nature. There are 5 thematic areas that are emphasized by EU policy in terms of CE: production and consumption, waste management, secondary raw materials, competitiveness, and innovation. The first four thematic areas are analyzed in the data review section.
The waste generation kg per capita is important for production and the consumption indicator, which is defined as total waste generated in a country including major mineral wastes, divided by the average population of the country. Average waste generation per capita is around 5000 kgs in the EU. There is a downward trendline over the years (Fig. 3).
The recycling rate of municipal waste is one of the sub-indicators used to analyze waste management. The indicator measures the share of recycled municipal waste in the total municipal waste generation. The trendline of the recycling rate of municipal waste has a positive outcome with the sloping upward, which is targeted and expected by EU environmental policy. By the end of 2021, the EU had reached almost 50% of the recycled municipal waste rate in the total municipal waste generation (Fig. 7).
One of the secondary raw materials sub-indicators is circular material use rate. This sub-indicator measures the share of material recycled and fed back into the economy, thus saving the extraction of primary raw materials, in overall material use. Figure 8 shows that the number of circular materials use rates have been rising except for a sharp fall between 2010 and 2011 in the EU.
Persons employed in CE sub-indicator measures “Number of persons employed” in the following three sectors: the recycling sector, repair and reuse sector, and rental and leasing sector. It is one of the tangible socio-economic examples as it affects employment rate. Looking at Figure 9, the number of persons employed in CE sectors has been increasing, particularly after the publication of the EU zero-waste policy in 2014.
There are many topics to explore in CE, such as business, biodiversity, climate, fashion, food, etc. We focused on food as a global food system, which encompasses production and post-farm processes such as processing. Distribution is a key contributor to emissions, responsible for roughly one-quarter of global GHG emissions. Changing food systems to one based on the principles of the CE is one of the most powerful things humankinds can do to tackle climate change and build biodiversity. Featured CE examples around the world show how businesses, governments, and cities are transforming the world economy into one that works for people and the environment. Transitioning to a CE means moving towards a food system that builds natural capital and allows nature to thrive.
There are four main contributors to food’s emissions. These are mainly the supply chain, livestock and fisheries, crop production, and land use, as shown by category in Figure 4. With the CE, a food system can be built that ensures food never creates waste. Nature-positive food production, more diversity, reduction of food losses, and the transformation of organic by-products into useful materials and products are all key ingredients of a CE for food. Tackling what people eat and how individuals produce food plays a key role in tackling climate change, reducing water stress and pollution, restoring lands back to forests or grasslands, and protecting the world’s wildlife (Ritchie et al., 2022). Reducing emissions from food production will be one of the greatest challenges in the coming decades. For example, it is essential to input, such as fertilizers, to meet growing food demands. Another solution would be changes to diets, food waste reduction, improvements in agricultural efficiency, and technologies that make low-carbon food alternatives scalable and affordable. CE presents solutions in moving towards a sustainable food system. Potential solutions are evaluated for every stage of the food system: food production, consumption, and waste management, respectively, in the results section. Therefore, this manuscript contributes current insights by examining the CE’s impact on employment, waste management, and the food system, with a particular emphasis on the unique findings and recommendations highlighted in the conclusion section. The future directions for the study would involve further analysis of the effectiveness of CE policies, more sector-specific research, addressing obstacles to implementation, and monitoring global perspectives.