Fig. 1.
Fig. 2.
Fig. 3.
Fig. 4.
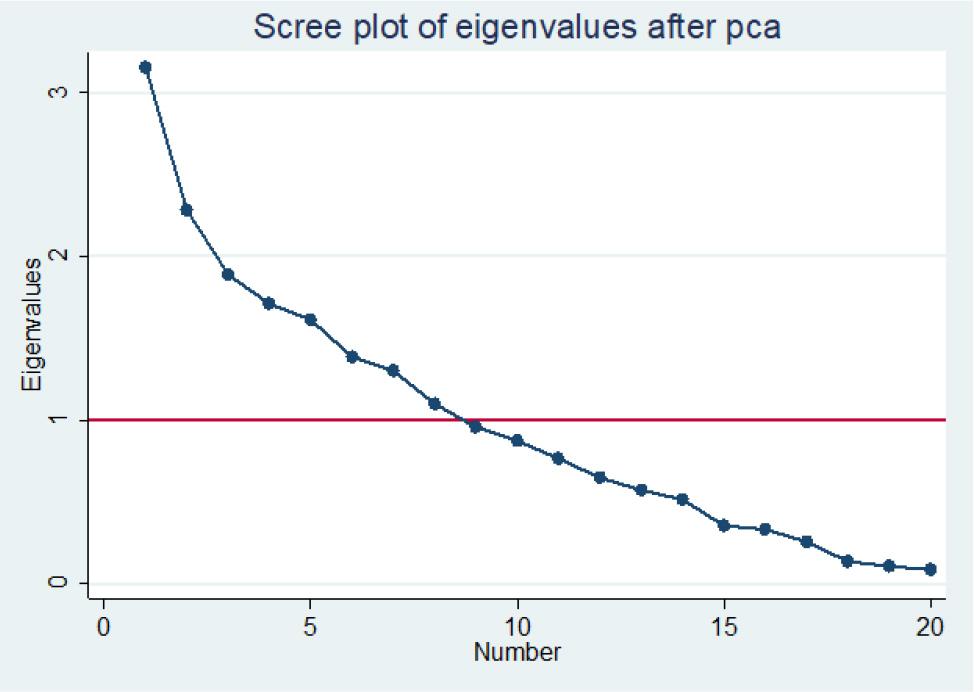
Fig. 5.
Fig. 6.
Unrotated principal component matrix
| Component | Eigenvalue | Difference | Proportion | Cumulative |
|---|---|---|---|---|
| Comp1 | 3.1557 | 0.8715 | 0.1578 | 0.1578 |
| Comp2 | 2.2842 | 0.3963 | 0.1142 | 0.2720 |
| Comp3 | 1.8879 | 0.1778 | 0.0944 | 0.3664 |
| Comp4 | 1.7101 | 0.0985 | 0.0855 | 0.4519 |
| Comp5 | 1.6116 | 0.2298 | 0.0806 | 0.5325 |
| Comp6 | 1.3818 | 0.0811 | 0.0691 | 0.6016 |
| Comp7 | 1.3007 | 0.2056 | 0.0650 | 0.6666 |
| Comp8 | 1.0950 | 0.1394 | 0.0548 | 0.7214 |
| Comp9 | 0.9556 | 0.0843 | 0.0478 | 0.7691 |
| Comp10 | 0.8713 | 0.1085 | 0.0436 | 0.8127 |
| Comp11 | 0.7629 | 0.1175 | 0.0381 | 0.8508 |
| Comp12 | 0.6454 | 0.0746 | 0.0323 | 0.8831 |
| Comp13 | 0.5707 | 0.0577 | 0.0285 | 0.9116 |
| Comp14 | 0.5130 | 0.1616 | 0.0257 | 0.9373 |
| Comp15 | 0.3515 | 0.0221 | 0.0176 | 0.9549 |
| Comp16 | 0.3294 | 0.0770 | 0.0165 | 0.9713 |
| Comp17 | 0.2523 | 0.1195 | 0.0126 | 0.9840 |
| Comp18 | 0.1329 | 0.0284 | 0.0066 | 0.9906 |
| Comp19 | 0.1045 | 0.0210 | 0.0052 | 0.9958 |
| Comp20 | 0.0834 | . | 0.0042 | 1.0000 |
How farmers used their agricultural credit
| Agricultural purpose | Frequency | Percentage (%) |
|---|---|---|
| Acquisition of new land | 7 | 25.0 |
| Land preparation (clearing, stumping among others) | 10 | 35.7 |
| Buying of inputs (fertilizers, agrochemicals, seedlings etc.) | 25 | 89.2 |
| Hiring of labour | 23 | 82.1 |
| Increase of acreage of cultivation | 14 | 50.0 |
Sectoral loan topology: No_ of loan A/Cs, gross loans and NPLs-December 2018
| No of loan A/Cs | % of total | Gross loans KShs. M | % of total | Gross NPLs KShs. M | % of total | |
|---|---|---|---|---|---|---|
| Personal/household | 6,728,258 | 93.63 | 661,460 | 26.63 | 45,672 | 14.42 |
| Trade | 255,409 | 3.55 | 475,423 | 19.14 | 81,622 | 25.77 |
| Real estate | 28,050 | 0.39 | 376,237 | 15.15 | 47,033 | 14.85 |
| Manufacturing | 15,213 | 0.21 | 323,817 | 13.04 | 51,791 | 16.35 |
| Transport and communication | 30,455 | 0.42 | 164,271 | 6.61 | 14,674 | 4.63 |
| Energy and water | 2,186 | 0.03 | 109,613 | 4.41 | 6,859 | 2.17 |
| Building and construction | 10,559 | 0.15 | 102,837 | 4.14 | 23,692 | 7.48 |
| Financial services | 14,986 | 0.21 | 95,780 | 3.86 | 6,049 | 1.91 |
| Agriculture | 95,158 | 1.32 | 89,961 | 3.62 | 30,452 | 9.62 |
| Tourism, restaurant and hotels | 4,548 | 0.06 | 72,134 | 2.9 | 6,392 | 2.02 |
| Mining and quarrying | 1,143 | 0.02 | 11,987 | 0.48 | 2,478 | 0.78 |
| Total | 7,185,965 | 100 | 2,483,518 | 100 | 316,712 | 100 |
Perceptions of all farmers (borrowers and non-borrowers)
| Regressor | Coefficient | Odds ratio | Standard error | p-value |
|---|---|---|---|---|
| Acquisition of agrochemicals and fertilizers | 2.040 | 7.691 | 0.811 | 0.012 |
| Increased use of hired labour | −1.111 | 0.329 | 0.580 | 0.056 |
| Increased use of optimal combination of inputs | −2.045 | 0.129 | 0.735 | 0.005 |
| Annual profit per acre | 3.262 | 26.114 | 0.612 | 0.000 |
| Constant | 1.447 | 4.251 | 0.717 | 0.044 |
Percentages of SHCFs perceptions on study variables
| Theme | Variable | SHFs borrowers (n = 87) | SHCFs non-borrowers Credit (n = 87) | Overall perception (n = 174) | |||
|---|---|---|---|---|---|---|---|
| perceptions | perceptions | perceptions | |||||
| yes | no | yes | no | yes | no | ||
| 1 | 2 | 3 | 4 | 5 | 6 | 7 | 8 |
| Demand for agricultural inputs | FDI1 | 10 | 90 | 5 | 95 | 7 | 93 |
| FDI2 | 6 | 94 | 2 | 98 | 4 | 96 | |
| FDI3 | 34 | 66 | 40 | 60 | 37 | 63 | |
| FDI4 | 87 | 13 | 79 | 21 | 83 | 17 | |
| FDI5 | 29 | 71 | 38 | 62 | 33 | 67 | |
| FDI6 | 31 | 69 | 48 | 52 | 40 | 60 | |
| Demand for labour | FDL1 | 28 | 72 | 23 | 77 | 25 | 75 |
| FDL2 | 53 | 47 | 44 | 56 | 48 | 52 | |
| FDL3 | 64 | 36 | 84 | 16 | 74 | 26 | |
| FDL4 | 23 | 77 | 22 | 78 | 22 | 78 | |
| FDL5 | 7 | 93 | 1 | 99 | 4 | 96 | |
| Improved efficiency | FIE1 | 87 | 13 | 82 | 18 | 84 | 16 |
| FIE2 | 41 | 59 | 56 | 44 | 49 | 51 | |
| FIE3 | 37 | 63 | 52 | 48 | 44 | 56 | |
| FIE4 | 13 | 87 | 8 | 92 | 10 | 90 | |
| FIE5 | 55 | 45 | 17 | 83 | 36 | 64 | |
| Returns | FRT1 | 77 | 23 | 78 | 22 | 78 | 22 |
| FRT2 | 25 | 75 | 32 | 68 | 29 | 71 | |
| FRT3 | 59 | 41 | 49 | 51 | 54 | 46 | |
| FRT4 | 32 | 68 | 29 | 71 | 30 | 70 | |
| Risk | RISKL | 48 | 52 | 56 | 44 | 52 | 48 |
| RISKD | 62 | 38 | 90 | 10 | 64 | 36 | |
The perceptions of farmers in FGDs as per the variables of the study
| Theme | Variable | Symbol | Number of FDG (borrowers) | Number of FDG (non-borrowers) |
|---|---|---|---|---|
| 1 | 2 | 3 | 4 | 5 |
| Demand for inputs | Payment of leasing land | FDI1 | 6 | 3 |
| Buying of land | FDI2 | 5 | 3 | |
| Accessing both printed and electronic information | FDI3 | 7 | 6 | |
| Acquisition of agrochemicals and fertilizers | FDI4 | 11 | 11 | |
| Acquisition of tree seedlings | FDI5 | 5 | 8 | |
| Acquisition of manure | FDI6 | 3 | 10 | |
| Demand for labor | Increased use of child labor on the coffee farm | FDL1 | 5 | 8 |
| Increased use of labor from other members of your family apart from children on the farm | FDL2 | 5 | 10 | |
| Increased use of hired labour | FDL3 | 11 | 11 | |
| Increased use of ox-plough | FDL4 | 8 | 4 | |
| Increased use of tractor | FDL5 | 6 | 3 | |
| Efficiency of production | Increased use of optimal combination of inputs | FIE1 | 11 | 11 |
| Increase in area of farming of coffee | FIE2 | 8 | 7 | |
| Replacement of old trees with improved varieties | FIE3 | 8 | 4 | |
| Increased access to extension services | FIE4 | 9 | 6 | |
| Increase of the cost of labour | FIE5 | 10 | 9 | |
| Returns/profits | Annual profit per acre | FRT1 | 11 | 11 |
| Increase in numbers of shares for farmers in SACCO | FRT2 | 9 | 6 | |
| Increase in farmers’ wealth | FRT3 | 10 | 8 | |
| Investing in other business | FRT4 | 7 | 5 | |
| Risk | Risk of making loss | RISKL | 3 | 9 |
| Risk of loan default | RISKD | 7 | 10 | |
Summary statistics of regressors and regressand
| Variable | Mean | Standard deviation | Skewness | Kurtosis |
|---|---|---|---|---|
| Acquisition of agrochemicals and fertilizers | 0.827 | 0.378 | −1.734 | 4.008 |
| Increased use of hired labour | 0.741 | 0.439 | −1.102 | 2.215 |
| Increased use of optimal combination of inputs | 0.844 | 0.363 | −1.904 | 4.628 |
| Annual profit per acre | 0.781 | 0.414 | −1.363 | 2.858 |
| Influence of agricultural credit on coffee productivity | 0.787 | 0.410 | −1.404 | 2.972 |
The perception of key informants as per the variables of the study
| Theme | Variable | Symbol | Number of KIs | Frequency |
|---|---|---|---|---|
| Demand for inputs | Acquisition of agrochemicals and fertilizers | FDI4 | 15 | 42 |
| Acquisition of tree seedlings | FDI5 | 9 | – | |
| Demand for labor | Increased use of child labor on the coffee farm | FDL1 | 4 | – |
| Increased use of hired labour | FDL3 | 13 | 36 | |
| Efficiency of production | Increased use of optimal combination of inputs | FIE1 | 15 | 40 |
| Increase in area of farming of coffee | FIE2 | 7 | ||
| Returns/profits | Annual profit per acre | FRT1 | 13 | 48 |
| Increase in farmers’ wealth | FRT3 | 10 | – | |
| Investing in other business | FRT4 | 8 | – | |
| Risk | Risk of loan default | RISKD | 11 | 27 |
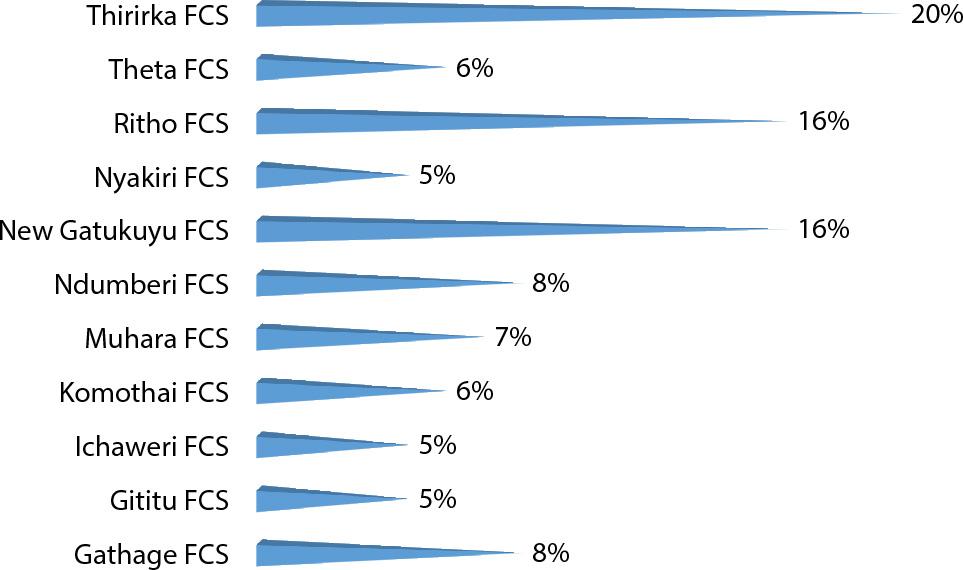
Sample size for the study
| S/No. | FCS | Number of Borrowers | Number of Non-borrowers |
|---|---|---|---|
| 1. | Gathage FCS | 7 | 7 |
| 2. | Gititu FCS | 4 | 4 |
| 3. | Ichaweri FCS | 4 | 4 |
| 4. | Komothai FCS | 5 | 5 |
| 5. | Muhara FCS | 6 | 6 |
| 6. | Ndumberi FCS | 7 | 7 |
| 7. | New Gatukuyu FCS | 14 | 14 |
| 8. | Nyakiri FCS | 4 | 4 |
| 9. | Ritho FCS | 14 | 14 |
| 10. | Theta FCS | 5 | 5 |
| 11. | Thirirka FCS | 17 | 17 |
| Total | 87 | 87 | |
Perceptions of non-borrowers
| Regressor | Coefficient | Odds ratio | Standard error | p-value |
|---|---|---|---|---|
| Acquisition of agrochemicals and fertilizers | 3.116 | 22.558 | 0.877 | 0.000 |
| Increased use of hired labour | −0.343 | 0.709 | 0.807 | 0.671 |
| Increased use of optimal combination of inputs | −1.706 | 0.181 | 0.998 | 0.088 |
| Annual profit per acre | −0.732 | 0.480 | 0.806 | 0.364 |
| Constant | 1.302 | 3.677 | 1.078 | 0.227 |
The cluster average scores (four clusters) n = 87 (borrowers)
| Variables | Cluster | |||
|---|---|---|---|---|
| 1 | 2 | 3 | 4 | |
| FDI4 | 1.00000 | 1.00000 | 0.11111 | 1.00000 |
| FDI5 | 0.00000 | 1.00000 | 0.44444 | 0.09091 |
| FDI6 | 0.29412 | 0.52941 | 0.22222 | 0.25000 |
| FDL1 | 0.35294 | 0.05882 | 0.22222 | 0.34091 |
| FDL2 | 0.58824 | 0.70588 | 0.66667 | 0.40909 |
| FDL3 | 0.88235 | 0.88235 | 0.00000 | 0.95455 |
| FDL4 | 0.29412 | 0.11765 | 0.22222 | 0.25000 |
| FDL5 | 0.17647 | 0.00000 | 0.00000 | 0.06818 |
| FIE1 | 0.82353 | 0.76471 | 0.33333 | 1.00000 |
| FIE2 | 0.11765 | 0.23529 | 0.77778 | 0.52273 |
| FIE3 | 0.41176 | 0.52941 | 0.11111 | 0.34091 |
| FIE4 | 0.17647 | 0.11765 | 0.11111 | 0.11364 |
| FIE5 | 0.23529 | 0.41176 | 0.33333 | 0.77273 |
| FRT1 | 1.00000 | 1.00000 | 0.33333 | 1.00000 |
| FRT2 | 0.23529 | 0.41176 | 0.44444 | 0.15909 |
| FRT3 | 0.05882 | 0.52941 | 0.77778 | 0.77273 |
| FRT4 | 0.94118 | 0.00000 | 0.22222 | 0.22727 |
Eigenvectors for principal components
| Variable | Comp1 | Comp2 | Comp3 | Comp4 | Comp5 | Comp6 | Comp7 | Comp8 | Unexplained |
|---|---|---|---|---|---|---|---|---|---|
| 1 | 2 | 3 | 4 | 5 | 6 | 7 | 8 | 9 | 10 |
| FDI1 | 0.1115 | −0.0533 | 0.2176 | 0.5258 | 0.1113 | −0.1245 | −0.1146 | −0.0830 | 0.3261 |
| FDI2 | −0.1065 | 0.4160 | 0.1683 | 0.0590 | −0.2442 | −0.0291 | 0.3567 | 0.1344 | 0.2270 |
| FDI3 | 0.0529 | −0.0357 | 0.2362 | 0.1486 | 0.3471 | 0.3461 | −0.0219 | −0.1446 | 0.4619 |
| FDI4 | 0.4944 | 0.1238 | 0.1275 | −0.0796 | −0.0902 | −0.0390 | 0.0355 | −0.0104 | 0.1352 |
| FDI5 | −0.1754 | 0.4825 | 0.2197 | −0.0218 | −0.1146 | −0.0646 | 0.1392 | 0.1408 | 0.2053 |
| FDI6 | −0.0561 | 0.1487 | 0.3917 | 0.1716 | 0.0591 | 0.1963 | −0.2046 | −0.1071 | 0.4737 |
| FDL1 | 0.1022 | −0.1254 | −0.3200 | 0.1789 | 0.2709 | 0.0899 | 0.2979 | 0.1219 | 0.4220 |
| FDL2 | −0.0378 | 0.1209 | −0.0923 | 0.3717 | 0.1264 | −0.4784 | 0.1781 | 0.1698 | 0.2950 |
| FDL3 | 0.4363 | 0.0877 | 0.1089 | −0.0427 | 0.1299 | 0.0315 | 0.1059 | 0.0977 | 0.3025 |
| FDL4 | 0.0545 | −0.1425 | −0.1907 | 0.1596 | −0.1286 | −0.4570 | −0.0343 | 0.0773 | 0.5087 |
| FDL5 | 0.1024 | −0.1024 | −0.1562 | 0.1538 | 0.0841 | 0.1361 | 0.3628 | −0.4202 | 0.4549 |
| FIE1 | 0.4239 | 0.0809 | 0.0317 | −0.0424 | 0.1117 | −0.0505 | −0.0855 | 0.0881 | 0.3713 |
| FIE2 | −0.1724 | −0.1088 | 0.3261 | −0.4406 | 0.3278 | −0.1250 | 0.2149 | 0.0523 | 0.0887 |
| FIE3 | 0.1225 | 0.1733 | −0.3451 | 0.0214 | −0.4618 | 0.3715 | −0.1569 | −0.0010 | 0.0921 |
| FIE4 | 0.0406 | −0.0718 | −0.0980 | 0.0474 | 0.0691 | 0.3618 | 0.4868 | 0.4404 | 0.2519 |
| FIE5 | 0.0889 | −0.0310 | −0.1681 | −0.2717 | 0.2354 | −0.0393 | −0.3485 | 0.4724 | 0.2994 |
| FRT1 | 0.4819 | 0.1443 | 0.1327 | −0.0771 | −0.0407 | −0.1207 | 0.0313 | −0.0579 | 0.1484 |
| FRT2 | −0.0809 | 0.0672 | 0.0818 | 0.3964 | 0.1277 | 0.2259 | −0.2757 | 0.4157 | 0.3029 |
| FRT3 | −0.0508 | 0.3582 | −0.3325 | −0.0361 | 0.4048 | −0.0079 | −0.1338 | −0.2802 | 0.1144 |
| FRT4 | 0.0633 | −0.5250 | 0.2606 | 0.0618 | −0.2787 | 0.0081 | 0.0269 | 0.0690 | 0.0916 |
Perceptions of borrowers
| Regressor | Coefficient | Odds ratio | Standard error | p-value |
|---|---|---|---|---|
| Acquisition of agrochemicals and fertilizers | 2.470 | 11.821 | 1.063 | 0.020 |
| Increased use of hired labour | −2.146 | 0.116 | 1.035 | 0.038 |
| Increased use of optimal combination of inputs | −4.278 | 0.013 | 1.515 | 0.005 |
| Annual profit per acre | 4.128 | 62.075 | 1.100 | 0.000 |
| Constant | 1.729 | 5.636 | 1.119 | 0.122 |