Fig. 1.
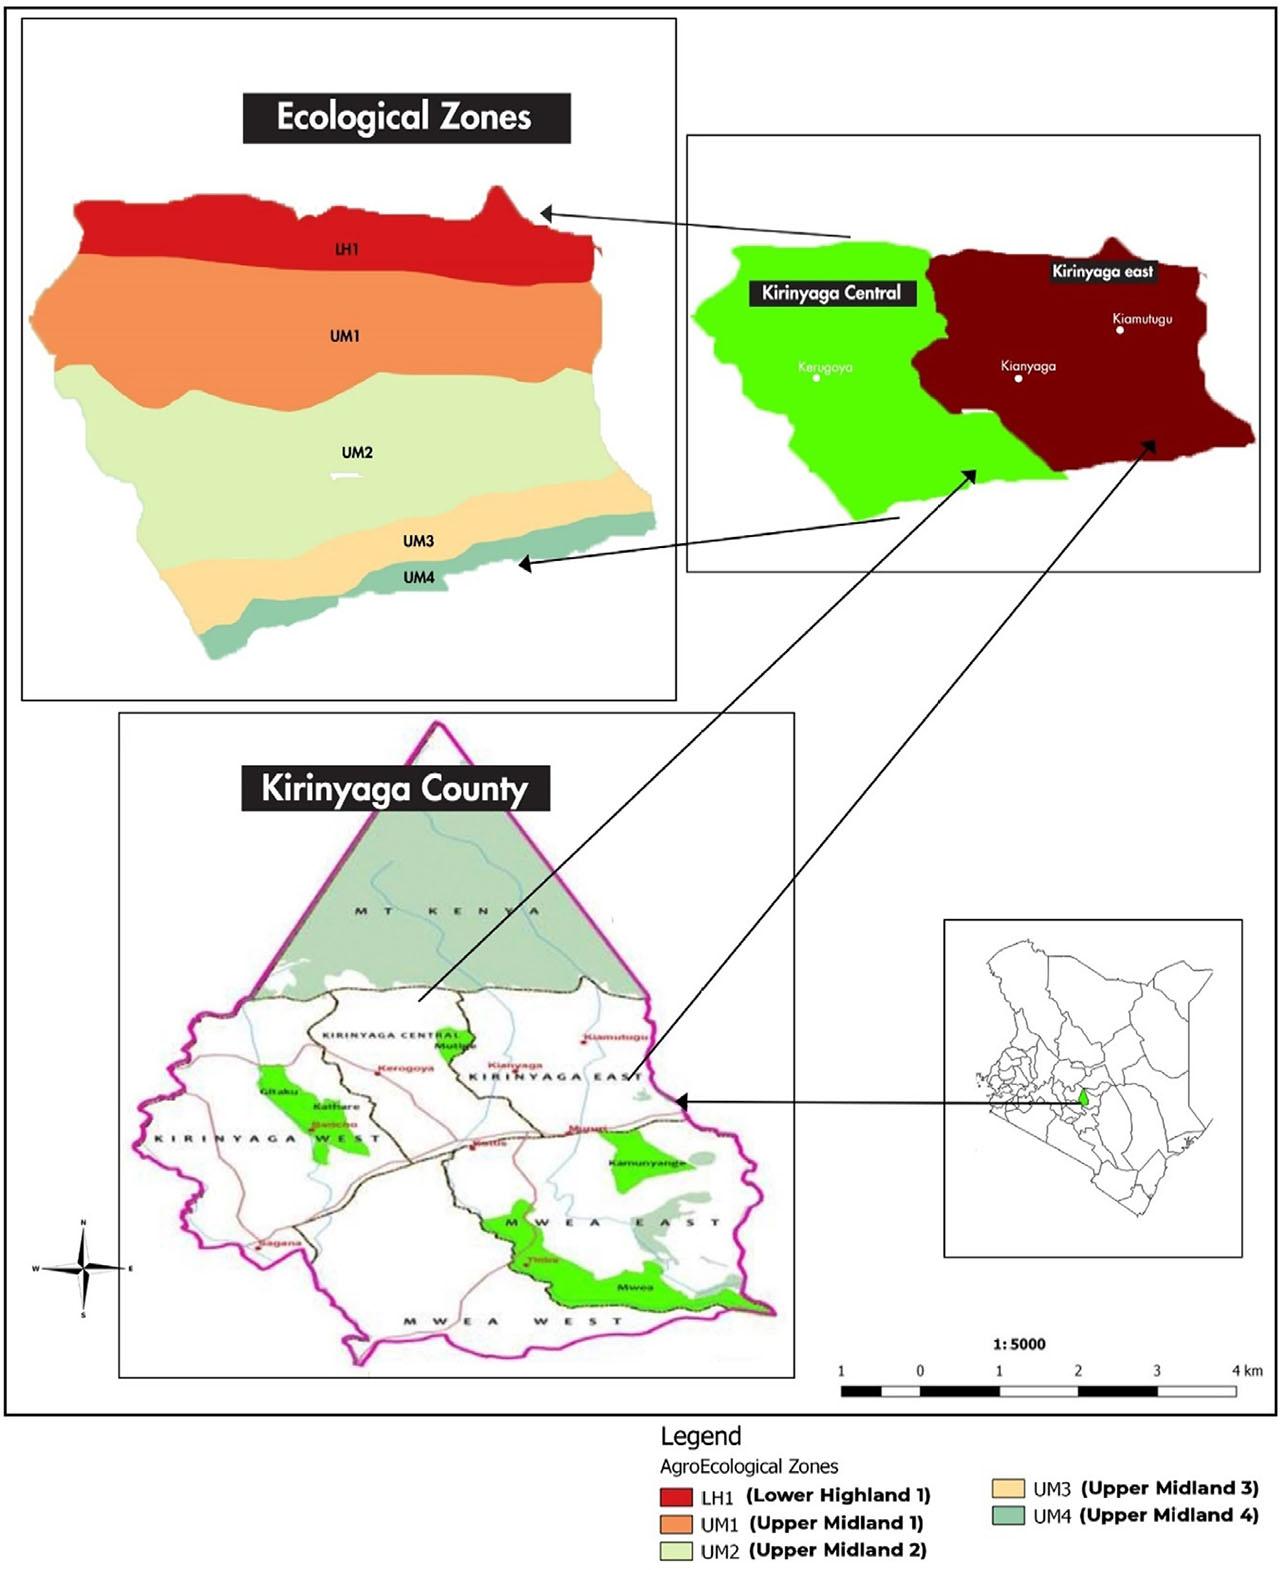
Fig. 2.
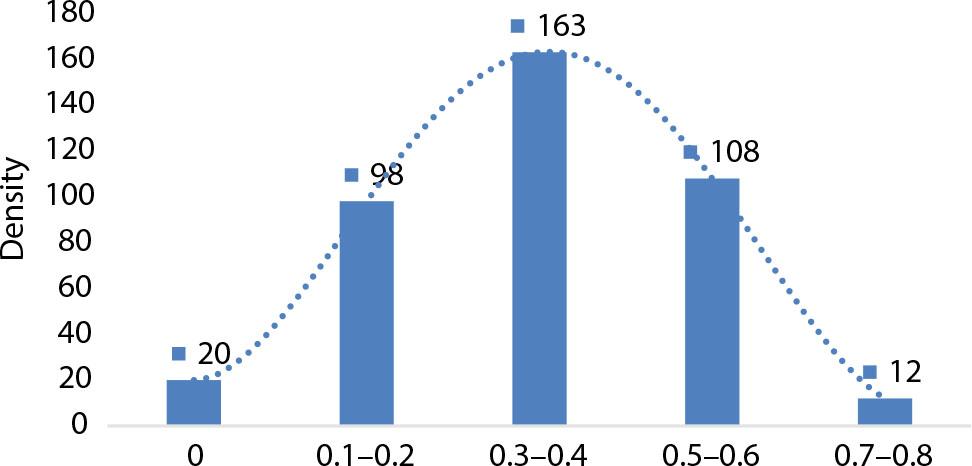
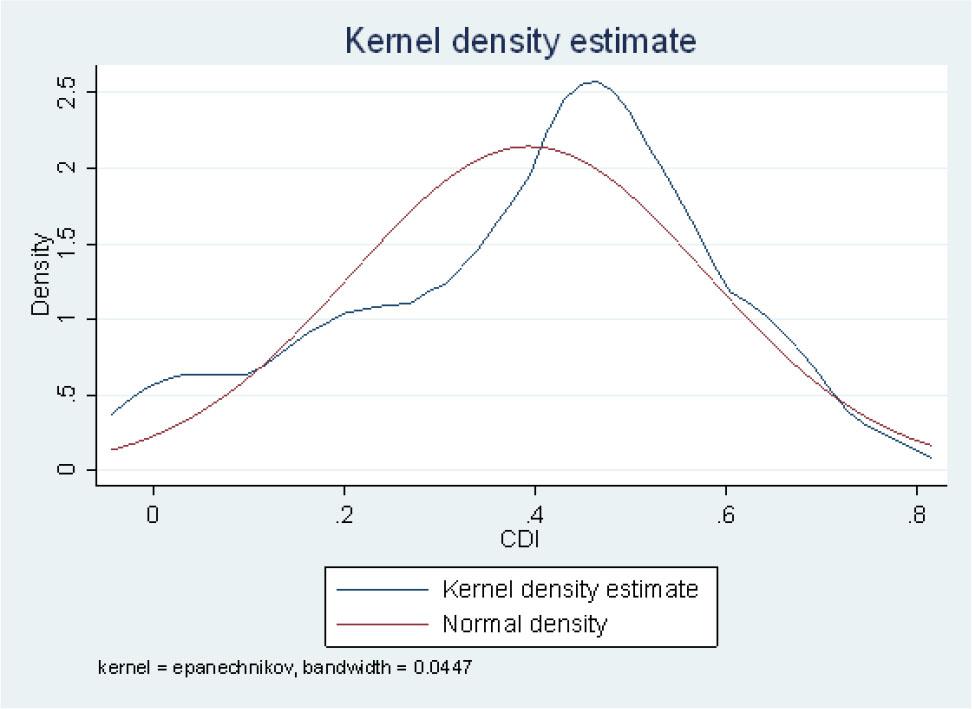
Fig. 3.
Demographic characteristics of categorical variables
| Variables | Category | Frequency | Percent. |
|---|---|---|---|
| Household head | Female | 125 | 31.17 |
| Male | 276 | 68.83 | |
| Diversification (years) | Less than 10 years | 150 | 37.4 |
| 10–20 years | 115 | 28.68 | |
| Above 20 years | 136 | 33.92 | |
| Extension (access) | No | 112 | 27.93 |
| Yes | 289 | 72.07 | |
| Extension often | Once | 17 | 5.88 |
| Twice | 53 | 18.34 | |
| Thrice | 85 | 29.41 | |
| More than thrice | 134 | 46 | |
| Group membership | No | 20 | 4.99 |
| Yes | 381 | 95.01 | |
| Group benefits | Agricultural information | 180 | 47.24 |
| Marketing information | 39 | 10.24 | |
| Credit access | 96 | 25.2 | |
| Input access | 66 | 17.32 | |
| Credit access | No | 51 | 12.72 |
| Yes | 350 | 87.28 | |
| Diversifiers | No | 21 | 5.24 |
| Yes | 380 | 94.76 |
Crop diversification level of sampled households
| Crop Diversification Index | Frequency | Percent. |
|---|---|---|
| 0–0.1 | 20 | 4.99 |
| 0.10–0.2 | 98 | 24.44 |
| 0.30–0.4 | 163 | 40.65 |
| 0.50–0.6 | 108 | 26.93 |
| 0.70–0.8 | 12 | 2.99 |
Sample size of smallholder coffee farmers in the study area
| Sub-County | AEZs | Location | Sub-Location | Population | Sample Size |
|---|---|---|---|---|---|
| Kirinyaga Central | UM1 | Mutira | Kabari | 911 | 20 |
| Inoi | Mbeti | 500 | 11 | ||
| UM2 | Kerugoya | Kaitheri | 1 900 | 42 | |
| Koroma | Nduini | 922 | 20 | ||
| UM3 | Kanyekini | Kianjege | 2 174 | 48 | |
| Kutus | Kangu | 370 | 08 | ||
| Kirinyaga East | UM1 | Ngariama | Rungeto | 600 | 13 |
| Karumandi | Kiaruri | 2 222 | 50 | ||
| UM2 | Baragwi | Rwambiti | 3 200 | 71 | |
| Njukiini | Ngiriambu | 2 800 | 62 | ||
| UM3 | Kirima | Mutige | 1 490 | 33 | |
| Kabare | Rukenya | 1 331 | 30 | ||
| Totals | 18 420 | 408 | |||
Truncated regression estimates for determinants of extent of crop diversification
| Variables | Coeff. | Std. Err | z | p-value |
|---|---|---|---|---|
| Gender of household head (Yes=1, No=0) | −0.053** | 0.018 | −2.960 | 0.003 |
| Age of household head (Years) | 0.011 | 0.01 | 1.100 | 0.241 |
| Access to extension services (Yes=1, No=0) | 0.052* | 0.020 | 2.540 | 0.011 |
| Distance to market (km) | 0.002 | 0.005 | 0.540 | 0.633 |
| Credit access (Yes=1, No) | 0.044 | 0.027 | 1.630 | 0.102 |
| Land size (ha) | 0.067** | 0.023 | 2.910 | 0.004 |
| Education level (years) | 0.005* | 0.002 | 1.980 | 0.048 |
| Household size (number) | 0.013* | 0.005 | 2.370 | 0.018 |
| Constant | 0.106*** | 0.027 | 3.926 | 0.000 |
| LR chi2(8) | 80.46 | Pseudo | 0.618 | |
| Prob > chi2 ( ) | 0.000 | Log likelihood | 105.327 | |
| No. Observation | 401 |
Demographic characteristics of discrete variables
| Variables | Mean | Std. Dev |
|---|---|---|
| Age (years) | 48.01 | 11.43 |
| Education level (years) | 10.82 | 3.19 |
| Household size (No.) | 3.63 | 1.05 |
| Distance (km) | 2.36 | 0.09 |
| Land size (ha) | 1.59 | 0.41 |
| Cropped land (ha) | 0.58 | 0.13 |
Summary of the explanatory variables used in the double-hurdle model
| Variable | Description | Exp sign |
|---|---|---|
| Explained variables | ||
| Crop diversification choice | Binary: 1 if the farmer uses at least 1 crop diversification strategy, 0 if otherwise | |
| Crop diversification extent | Crop Diversification Index (0–1) | |
| Explanatory variables | ||
| Gender of the household head | Binary: 1 if the gender of the farmer is male, 0 if otherwise | +/− |
| Age of the household head | Continuous: Age of household head (Years) | +/− |
| Education level of the household head | Continuous: Highest level of education attained | + |
| Extension access | Binary: 1 if the farmer had accessed extension services, 0 if otherwise | + |
| Group membership | Binary: 1 if the farmer was a member of a community organization, 0 if otherwise | + |
| Household size | Continuous: Number of dependents in the household | + |
| Distance to market | Continuous: Walking distance to market in km | +/− |
| Access to credit | Binary: 1 if the farmer had received inputs credit, 0 if otherwise | + |
| Total cultivated land size | Continuous: The total cultivated land size (Ha) | +/− |
Probit regression estimates for determinants of crop diversifications
| Variables | Coeff. | Std. Err | z | p-value | dy/dx |
|---|---|---|---|---|---|
| Gender of household head | −0.466 | 0.306 | −1.520 | 0.129 | −0.062 |
| Age of household head (years) | −0.006 | 0.011 | −0.550 | 0.581 | 0.001 |
| Household size (No.) | 0.143* | 0.087 | 1.980 | 0.099 | 0.016 |
| Access to Extension services | 0.704** | 0.261 | 2.700 | 0.007 | 0.065 |
| Cooperative membership | 0.563 | 0.487 | 1.160 | 0.247 | 0.013 |
| Distance to the market (km) | −0.102 | 0.069 | −1.470 | 0.141 | −0.003 |
| Credit access | −0.618 | 0.550 | −1.120 | 0.262 | 0.027 |
| Land size (ha) | 1.058** | 0.322 | 3.290 | 0.001 | 0.088 |
| Education level (years) | −0.008 | 0.041 | −0.200 | 0.838 | 0.0047 |
| _cons | −0.227*** | 0.008 | 28.375 | 0.000 | |
| lnsigma | |||||
| _cons | −1.833 | 0.040 | −46.130 | 0.000 | |
| /sigma | 0.160 | 0.006 | |||
| LR chi2(8) | 80.46 | Pseudo | 0.618 | ||
| Prob > chi2 ( ) | 0.000 | Log likelihood | 105.327 | ||
| No. Observation | 401 | ||||