
Figure 1
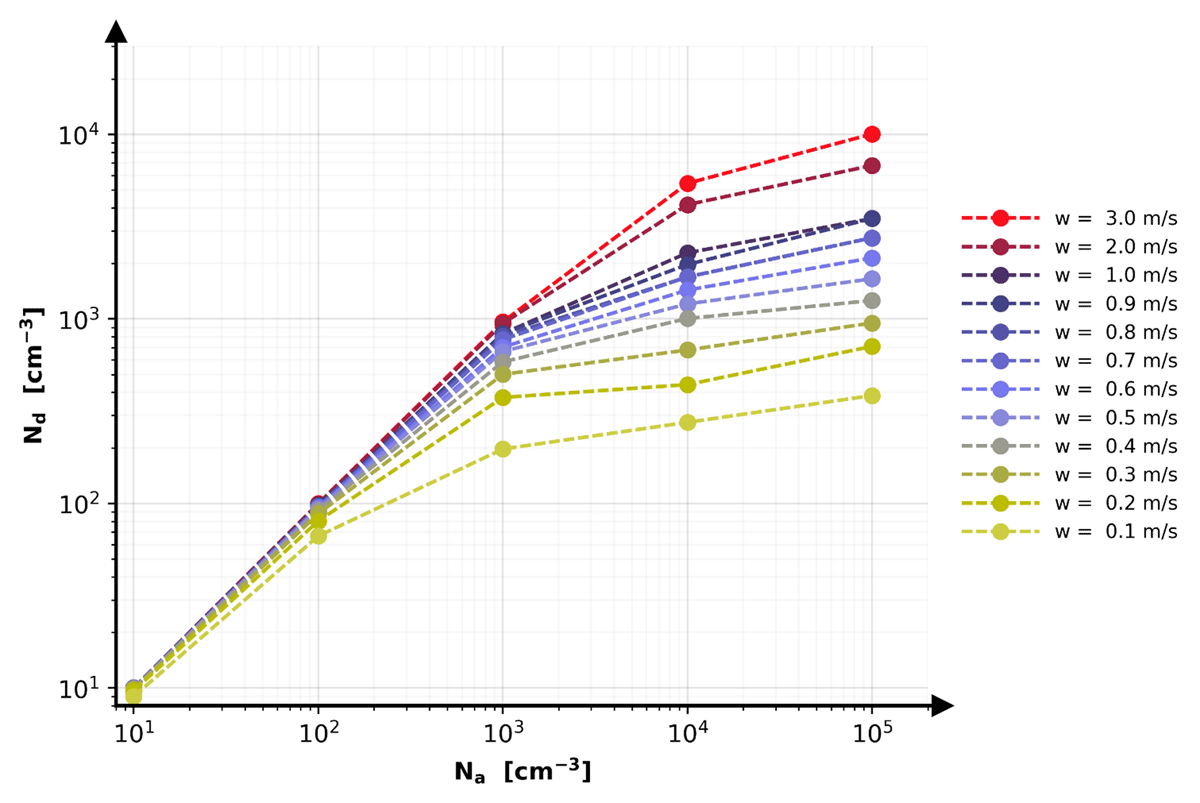
Parcel model simulations for different updraft speeds (in color) using PYRCEL. Each point represents one simulation. The droplet number concentration Nd as a function of the initial aerosol number concentration Na where Nd is diagnosed at the end of the model evaluation after the parcel is lifted for 2500 m. Particles are defined as cloud drops when their at the end of the simulation is larger than their at the point of maximum supersaturation.
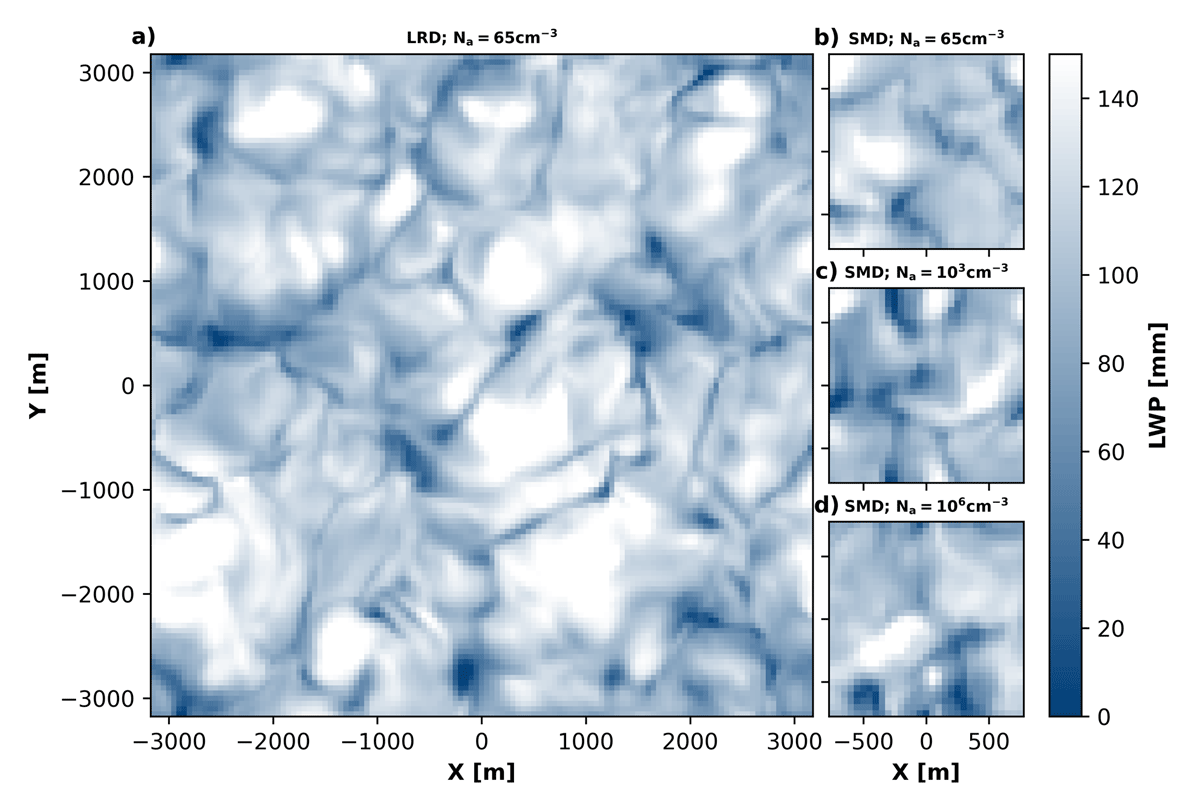
Figure 2
Liquid water path (LWP) after two hours of simulation for cases with on the LRD (a) and SMD (b, c, d) domains. In panel a) and (b) Na = 65 cm–3 while in panel (c) Na = 103 cm–3 and panel (d) Na = 105 cm–3.
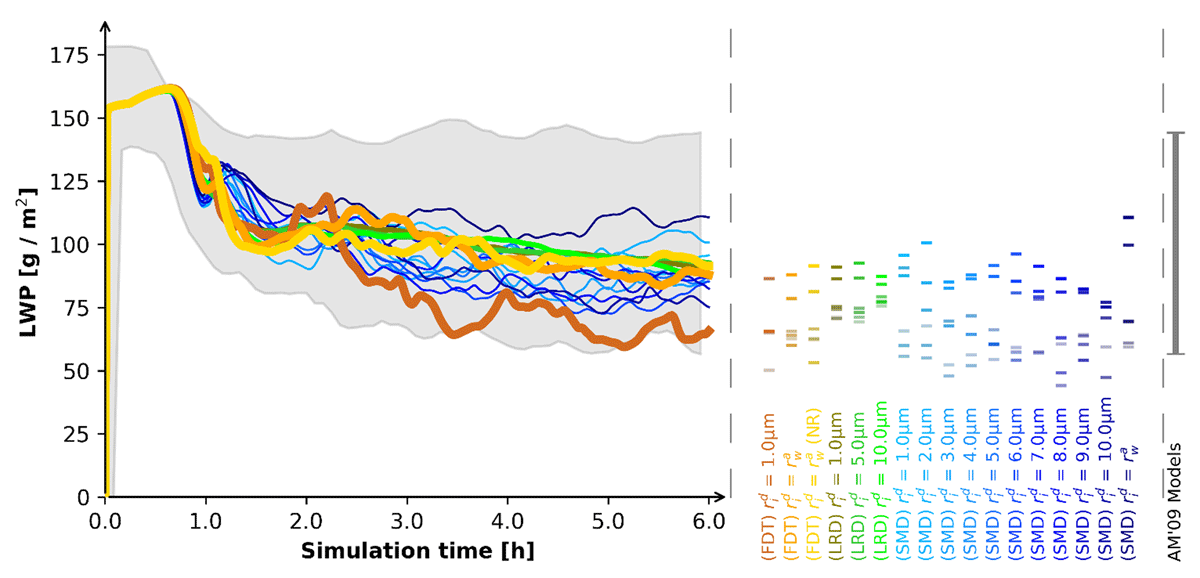
Figure 3
Comparison of liquid water path (LWP) between all our simulations with MIMICA (in color) and the simulations from Ackerman et al. (2009) in grey shading. The left panel shows the temporal evolution of the LWP for sensitivity simulations with aerosol number concentration Na = 65 cm–3. Each color corresponds to a specific sensitivity simulation, see text at the bottom of the central panel and main text for a description of the different sensitivity simulations. The central panel shows the LWP at the end of all sensitivity simulations with varying Na = {65, 100, 500, 103, 104, 105} cm–3 simulation (more transparent lines in the indicate higher Na). The right panel shows the range of simulated LWP by Ackerman et al. (2009).
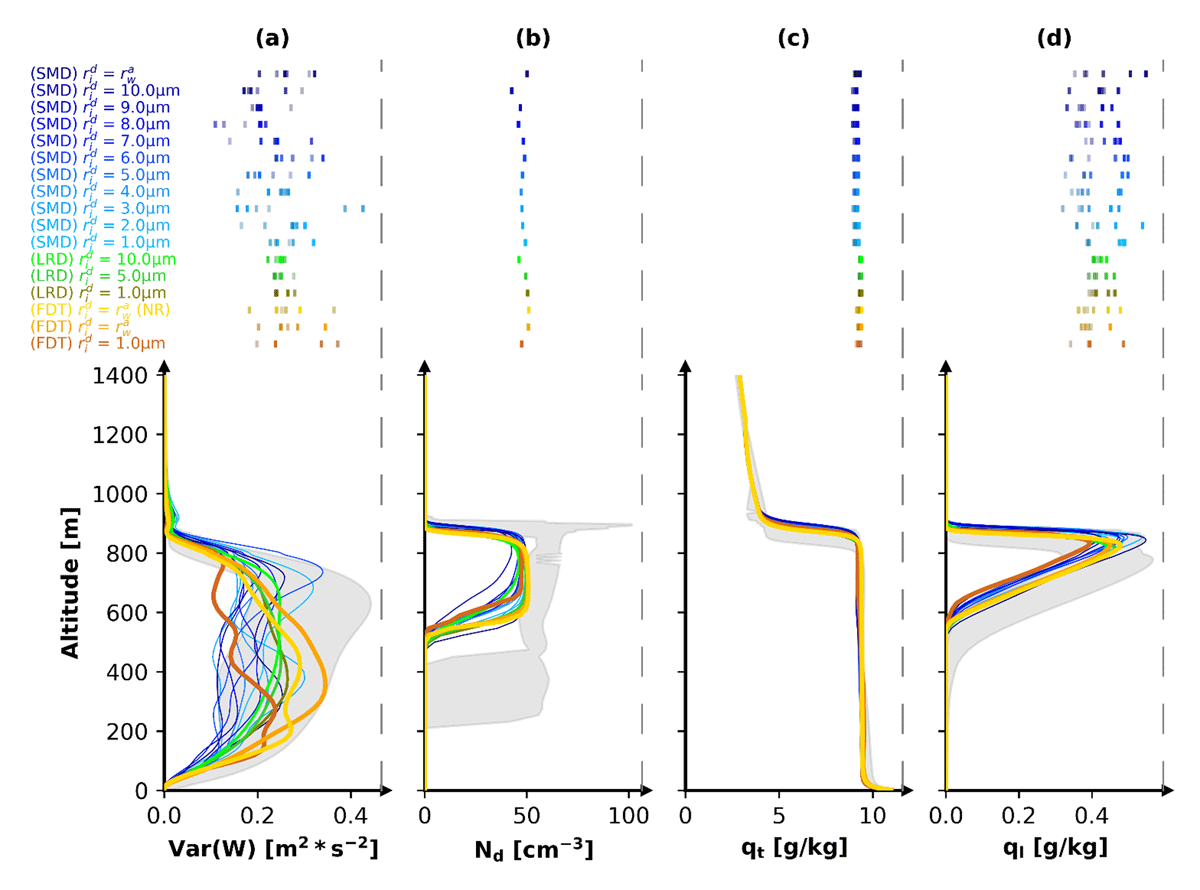
Figure 4
Modeled updraft variance (a), cloud droplet number Nd (b), total water content (c), and liquid water content (d) at the last modeled timestep. The upper row shows the maximum (median in panel c) value of the respective variable for all sensitivity simulations with MIMICA with varying aerosol number concentration Na = {65, 100, 500, 103, 104, 105} cm–3. Please see main text for a description of the different simulations. More transparent color indicates higher prescribed aerosol concentrations. The lower row shows profiles at the end of our simulations with Na = 65 cm–3 (colored lines). Gray shading indicates the modeled range (min/max) of the respective variable from the Ackerman et al. (2009) LES intercomparison.
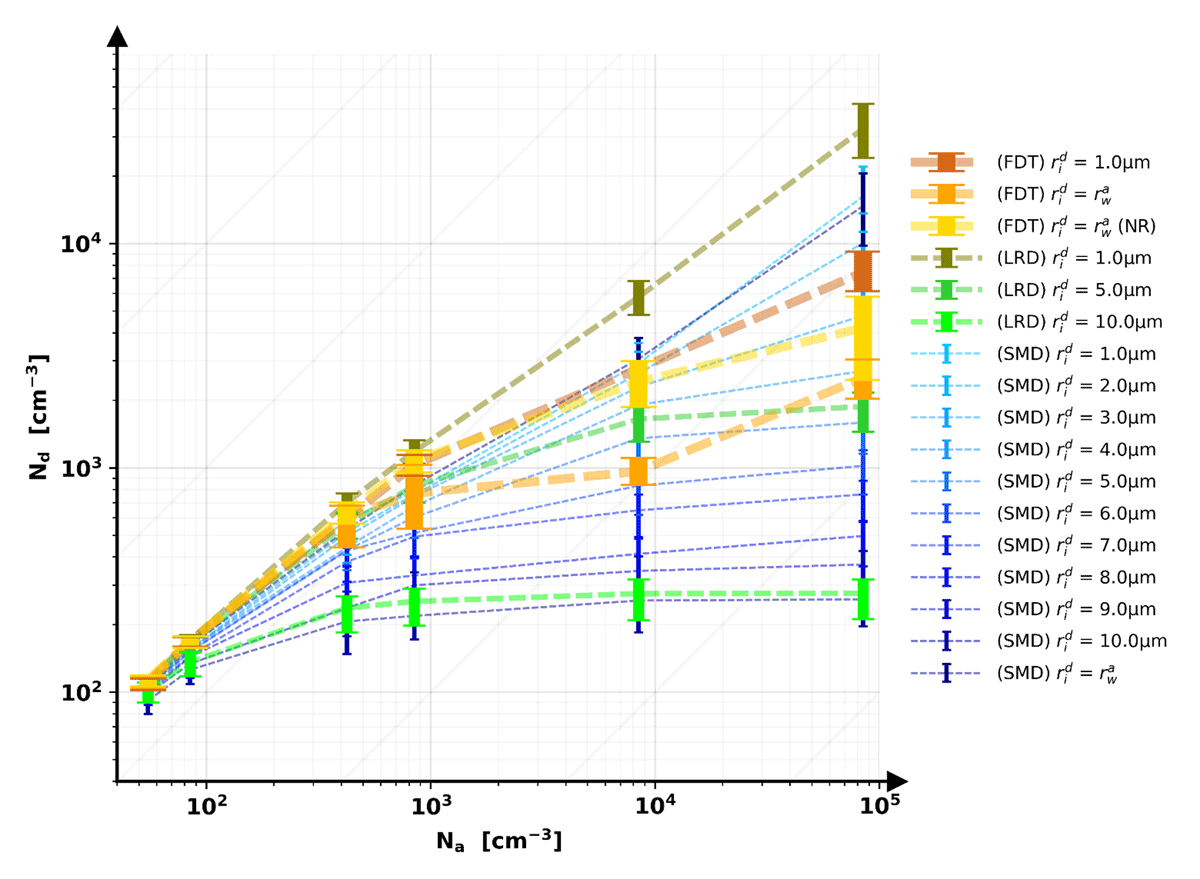
Figure 5
Susceptibility of in-cloud (ql > 0.1 g⁄kg) cloud droplet number concentration (Nd) to below cloud aerosol concentration (Na). Each point represents statistics from one simulation obtained from 3D MIMICA model output during the last of six hours of simulation. The error bars indicate the 25th and 75th percentiles. Blue lines show simulations on the small model domain (SMD) and darker blue colors indicate a larger initial droplet radius . Green lines show simulations on the large domain (LRD). Simulations with prescribed timestep (Δt = 0.1 s) are labeled FDT. All other simulations have time steps dictated by the CFL criterion. The orange, yellow and dark blue lines show simulations with initial droplet radius estimated from the wet aerosol PSD .
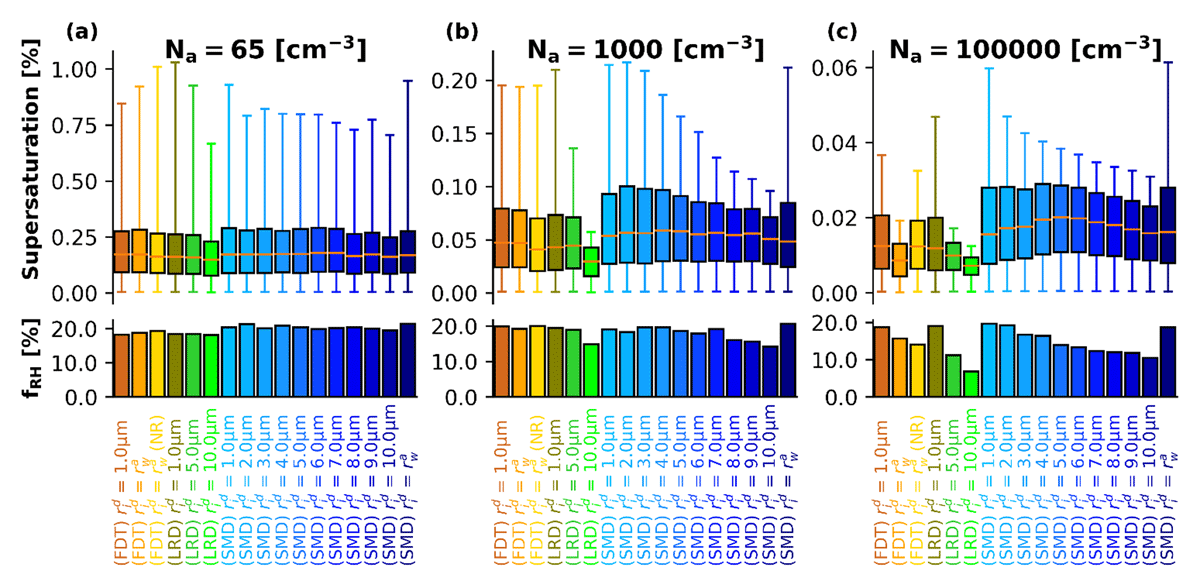
Figure 6
Supersaturation statistics for simulations with Na = {65, 1000, and 10000} [cm–3] (left, middle and right panel respectively). The statistics are obtained from the 3D output at the last model time step. The barplots (lower panels) indicate the fraction of supersaturated grid boxes (fRH) within the domain. The boxplots (upper panels) show the 25th and 75th percentiles (boxes) and 1st and 99th percentiles (whiskers) of supersaturation of all supersaturated gird boxes. Please note the different y-axes.