
Figure 1
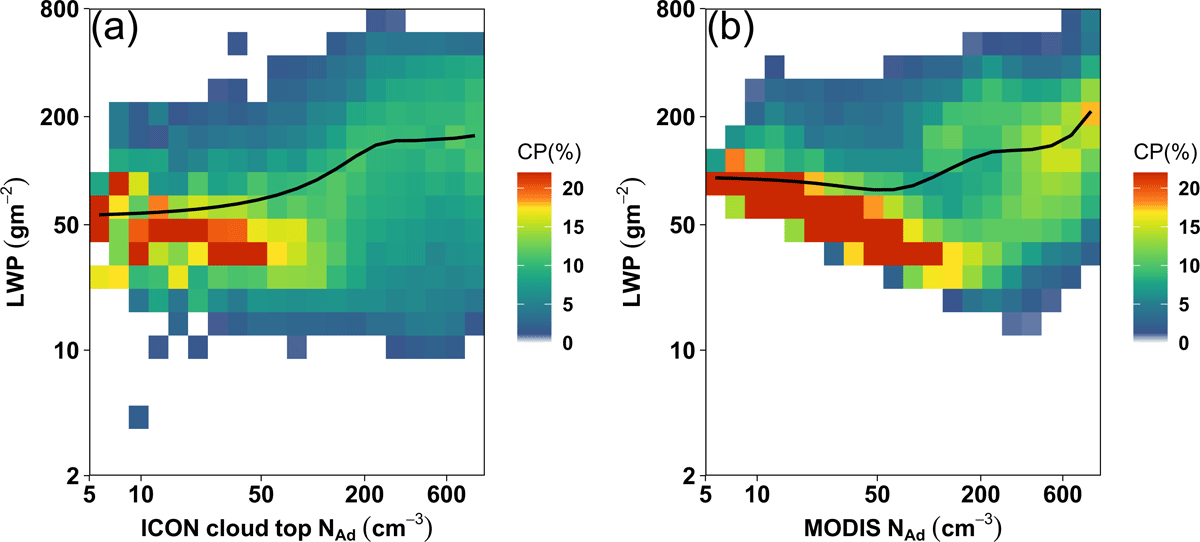
The NAd-LWP joint histogram in (a) the ICON-LES model, and (b) the MODIS-Level2 satellite retrieval, over Germany. The thick black line in each plot shows the mean LWP () at certain Nd bins (P (|Nd)). CP(%) is condition probability: the probability of finding a certain LWP given that a certain Nd has been observed.
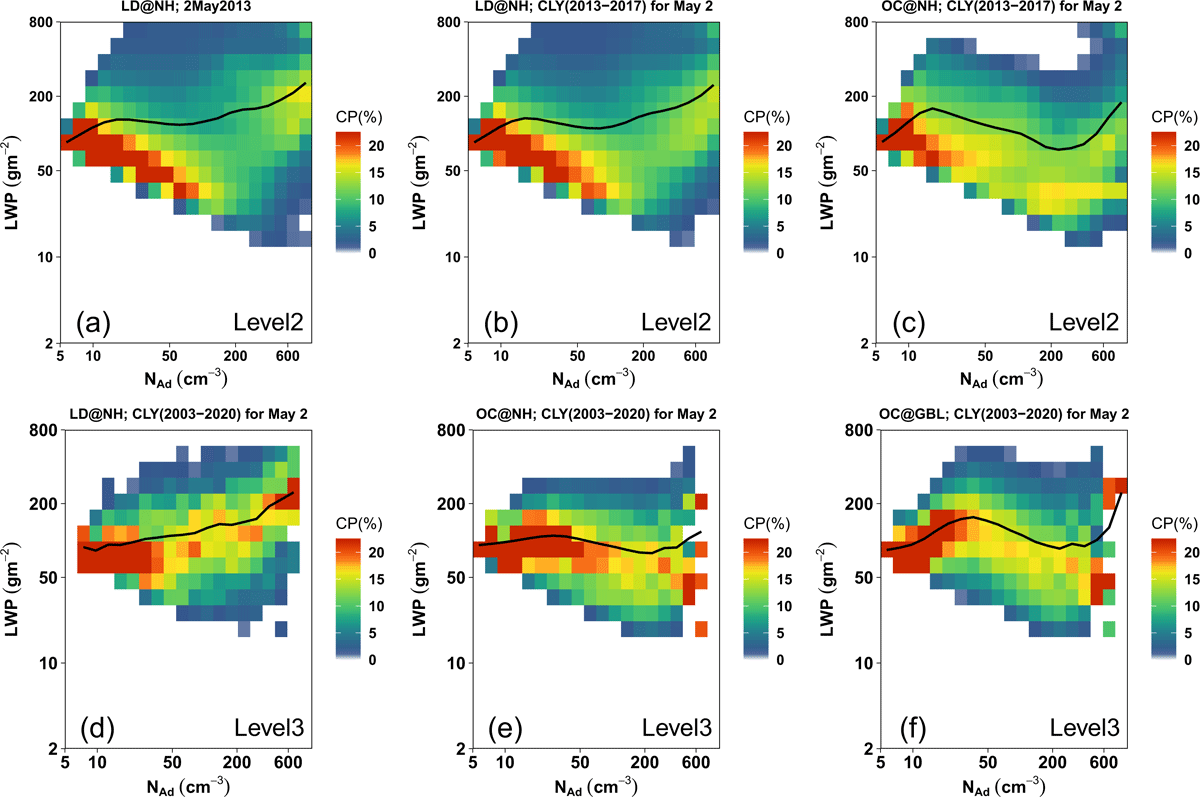
Figure 2
The NAd-LWP joint histogram for (a) the Northern hemisphere Land for the date 02 May 2013 using MODIS-Level2, (b) daily climatology (02 May 2013) for the Northern hemisphere Land for the period 2013–2017 using MODIS-Level2, (c) same as fig (b) but for the Northern hemisphere Ocean using MODIS-Level2, (d) daily climatology (02 May 2013) for the Northern hemisphere Land for the period 2003–2020 using MODIS-Level3, (e) same as fig (d) but for the Northern hemisphere Ocean using MODIS-Level3, and (f) daily climatology (02 May 2013) for the Global Ocean using MODIS-Level3. The figure description is the same as Figure 1.
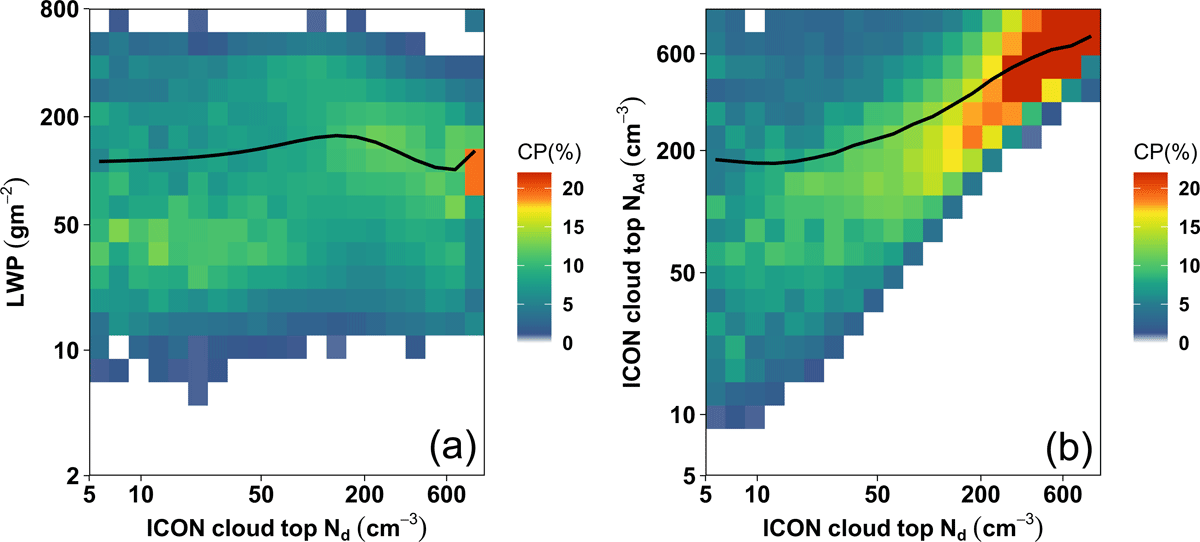
Figure 3
ICON-LES diagnostics to assess the satellite assumptions in retrieving Nd. (a) same as Figure 1a, but using Nd diagnosed at cloud-top, rather than NAd (over Germany), and (b) A comparison between model predicted Nd and model derived adiabatic NAd at the cloud-top (over Germany). The thick black line (3b) shows the mean NAd at certain Nd bins (P (|Nd)). CP(%) is condition probability: the probability of finding a certain NAd given that a certain Nd has been observed.
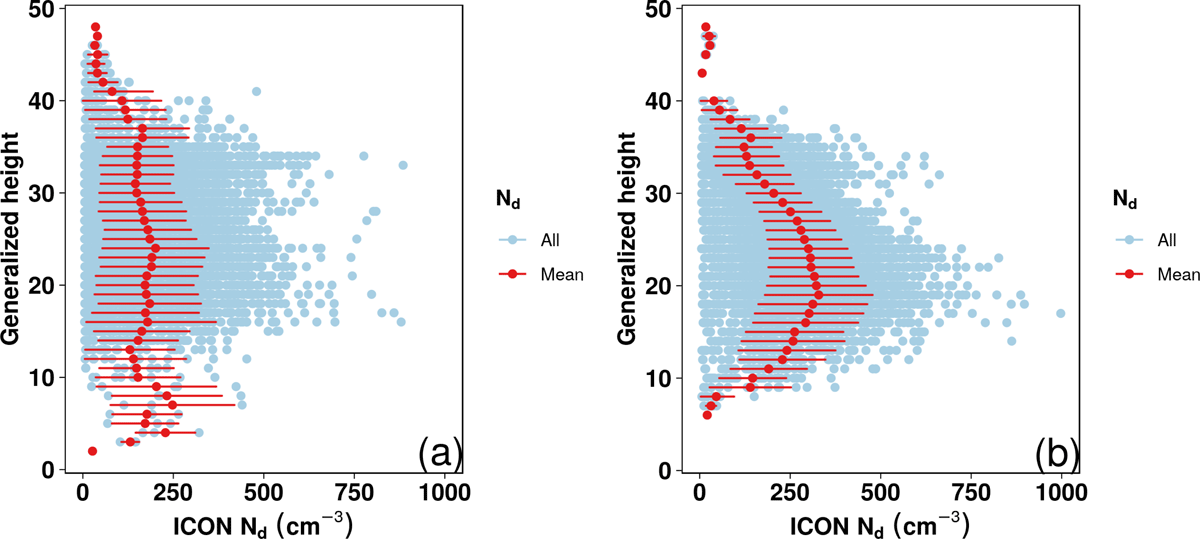
Figure 4
The ICON-LES Nd (cm–3) profile (over Germany) for (a) a shallow cloud regime, and (b) a convective cloud regime. The blue points indicate individual cloud profiles for the respective model grid, and the red points indicate the mean cloud profile with standard deviations.
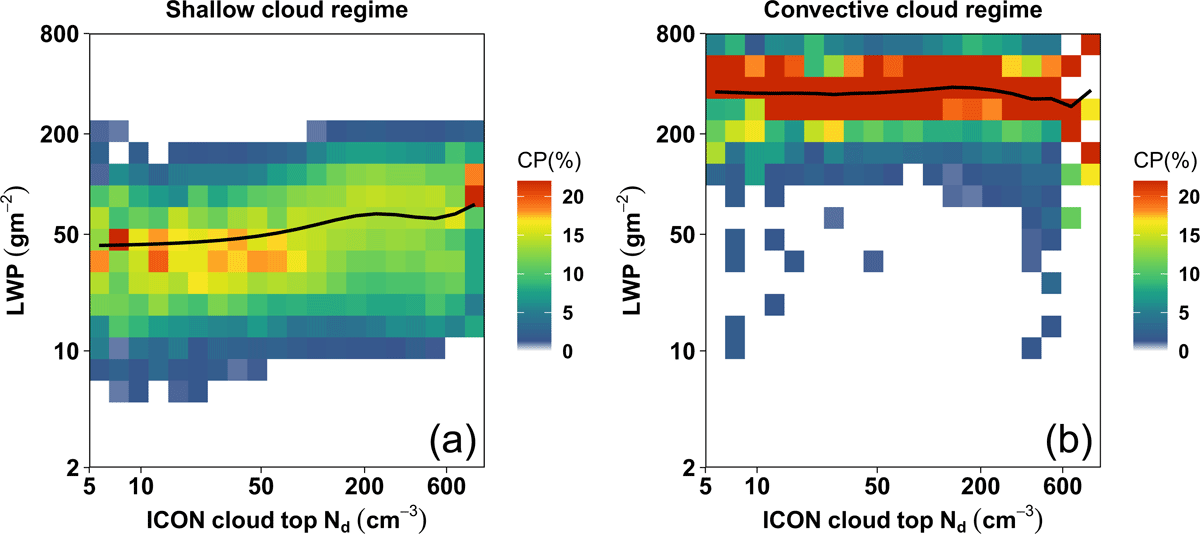
Figure 5
The Nd-LWP joint histogram (over Germany) for (a) the shallow cloud regime with the cloud depth between 100 to 600 m, and (b) the convective cloud regime with the cloud depth greater than 1000 m. The figure description is the same as Figure 1.