
Table 1
The PM2.5 measurement device for each location.
| STATION | PERIOD | DEVICE | PRECISION (± µG/M–) | NOTE |
|---|---|---|---|---|
| Vavihill | 28-09-1999 to 15-11-2017 | TEOM 1400 | 1.5 | |
| 10-05-2018 to 31-12-2022 | Palas FIDAS 200 | 0.1 | ||
| Malmö | 03-06-1999 to 01-01-2009 | TEOM 1400 | 1.5 | |
| 01-01-2009 to 31-12-2015 | TEOM 1400 + FDMS 8500 B/CB dryer | 1.5 | Combined system with dryer unit | |
| 01-01-2016 to 31-12-2021 | TEOM 1405F + FDMS 8500 B | 2 | Combined system with dryer unit | |
| 01-01-2022 to 31-12-2023 | Palas FIDAS 200 | 0.1 |
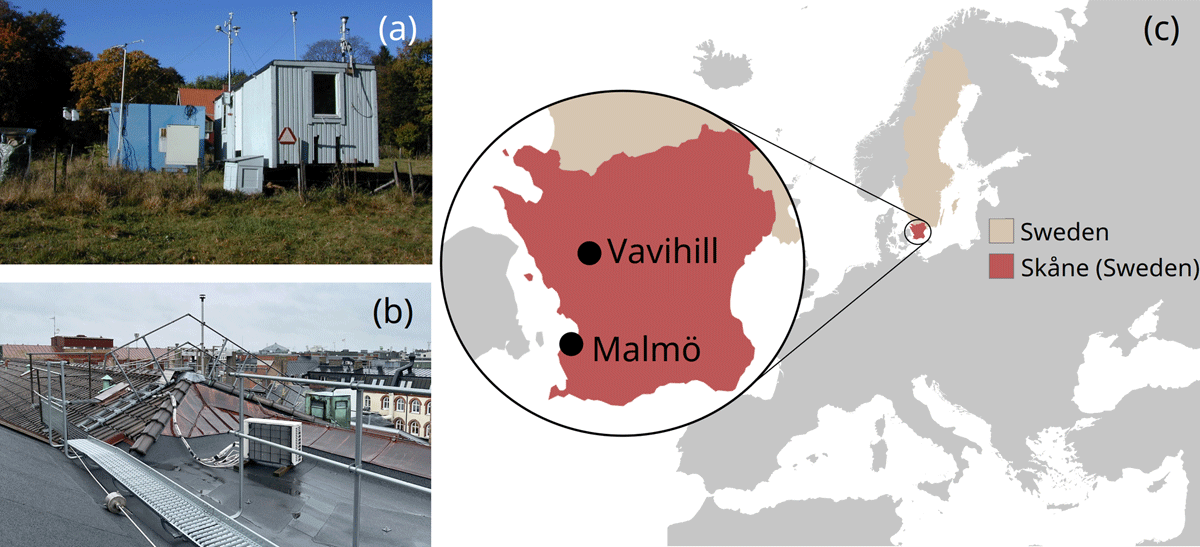
Figure 1
The location of the aerosol measuring stations. The pictures show (a) the measuring station in Vavihill, (b) the measuring station in Malmö, and (c) a map displaying their geographical locations.
Table 2
The meteorological data for each location.
| VAVIHILL | MALMÖ | ÄNGELHOLM | ||
|---|---|---|---|---|
| Air Pressure | Station | Helsingborg (25 km away from particle monitor) | Helsingborg (49 km away from particle monitor) | Ängelholm airport |
| Period | 01-08-1995 to 01-10-2024 | 02-08-1995 to 01-10-2024 | 05-01-1946 to 01-10-2024 | |
| Device | Vaisala PTB220 (15-04-2015 to 17-04-2025 and from 19-09-2004 to 23-05-2014) PTB201A (Remaining time). | Vaisala PTB220 (15-04-2015 to 17-04-2025 and from 19-09-2004 to 23-05-2014) PTB201A (Remaining time). | No information | |
| Wind | Station | Hörby (35 km away from particle monitor) | Malmö (6 km away from particle monitor) | Ängelholm airport |
| Period | 01-08-1995 to 01-10-2024 | 01-01-1990 to 01-12-2024 | 05-01-1946 to 01-03-2025 | |
| Device | Vaisala WAA15A (speed) Vaisala WAV15A (direction) | Vaisala WAA15A (speed) Vaisala WAV15A (direction) | No info | |
| Precipitation | Station | Hörby (35 km away from particle monitor) | Malmö (6 km away from particle monitor) | Ängelholm airport and Tånga. |
| Period | 01-08-1995 to 01-10-2024 | 21-11-1995 to 01-12-2024 | 18-01-1947 to 30-11-2001 (Ängelhom airport), and 19-12-1973 to 31-08-2024 (Tånga). | |
| Device | Geonor T200 | Geonor T200 | No information and beaker. |
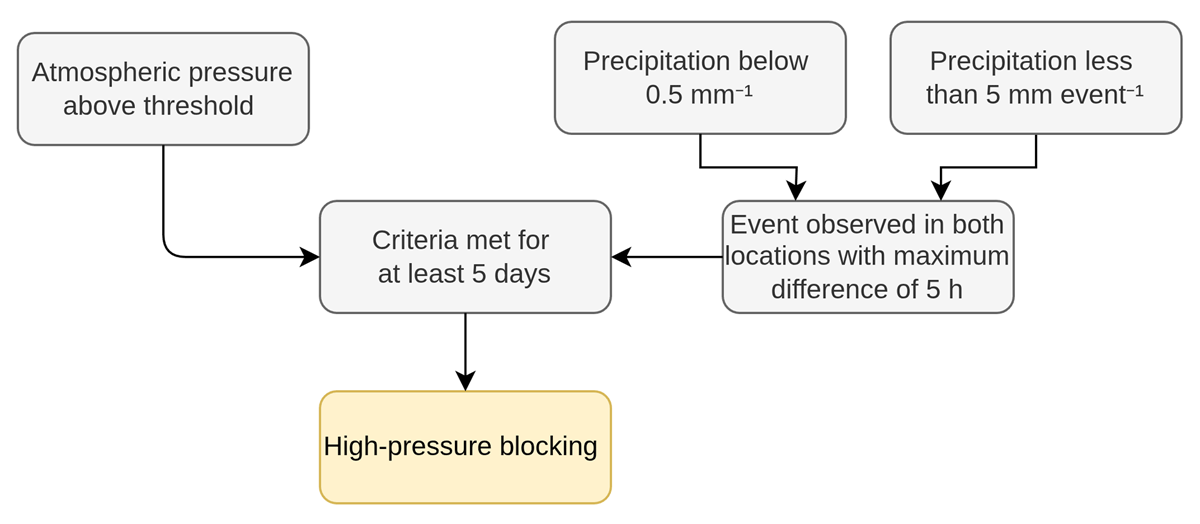
Figure 2
Selection procedure of high-pressure blocking events in Vavihill and Malmö.
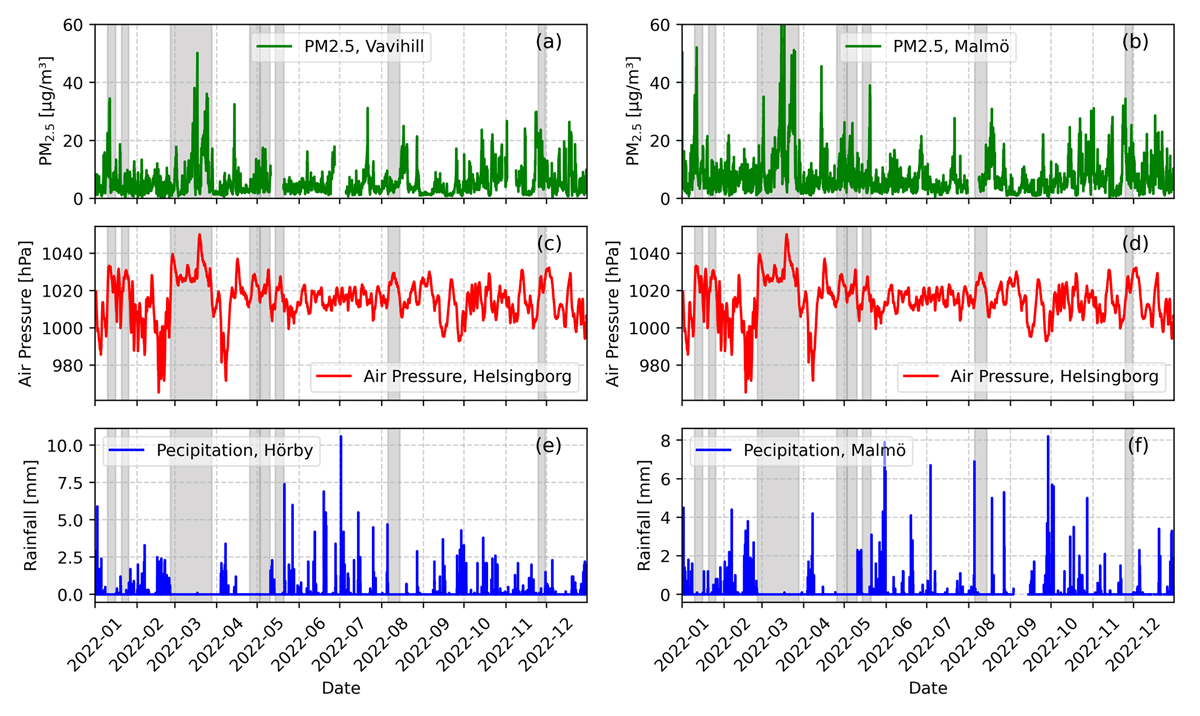
Figure 3
Example plots displaying the PM2.5, air pressure, and precipitation during the year 2022. The periods which were indicated as periods of high-pressure blocking events are shaded in grey. This displays a normal yearly distribution of high-pressure blocking events using the described method.
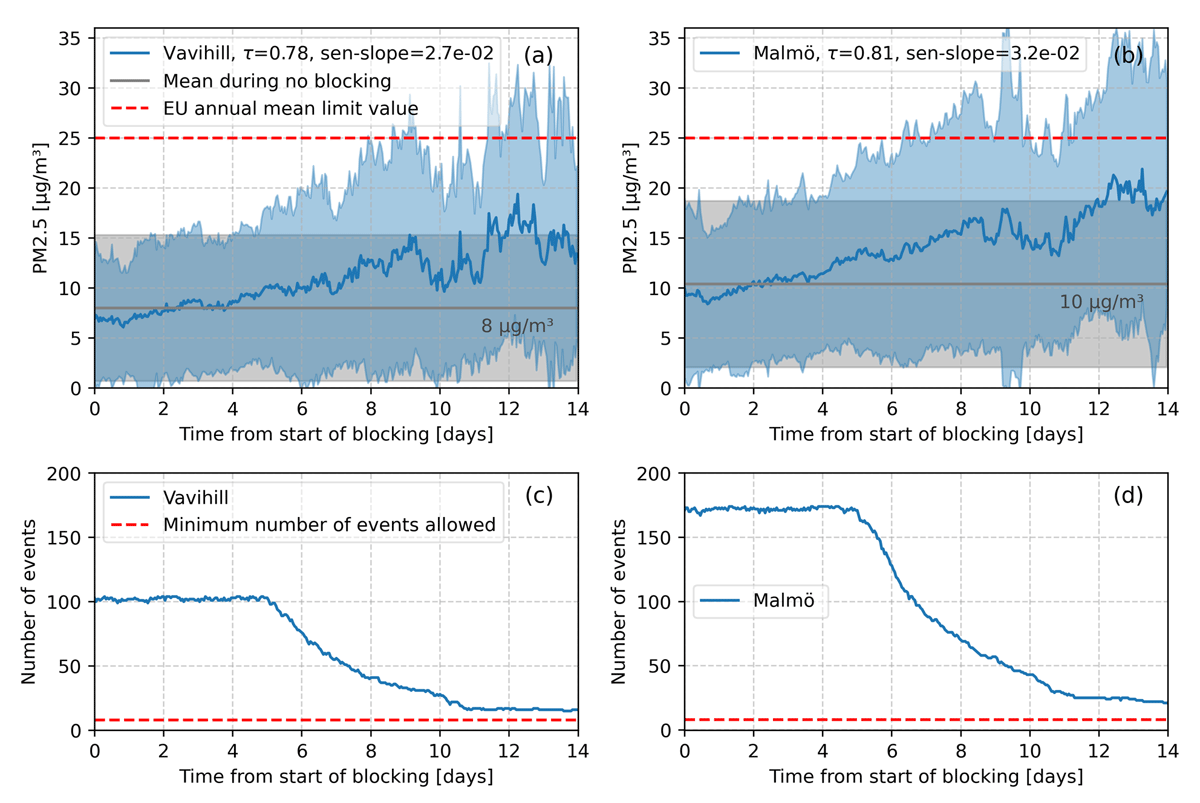
Figure 4
Mean concentrations of PM2.5 during high-pressure blocking events. The mean concentration can be seen in Vavihill (a) and in Malmö (b) by the blue line. The grey line shows the mean PM2.5 during non-high pressure blocking events. The shaded region indicates the standard deviation of the data. The number of high-pressure blocking events used in the analysis can be seen in (c) and (d), where the minimum number of events allowed is shown by the red line.
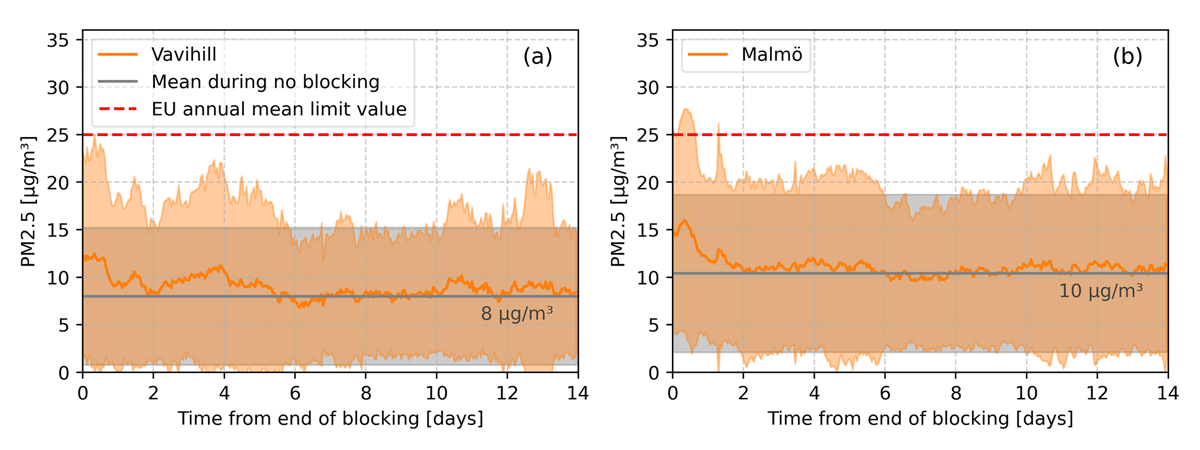
Figure 5
Mean concentrations of PM2.5 after end of high-pressure blocking events. Mean concentrations in Vavihill (a) and Malmö (b) are displayed by the orange line. The grey line shows the mean PM2.5 during non-high pressure blocking events. The shaded region indicates the standard deviation of the data.
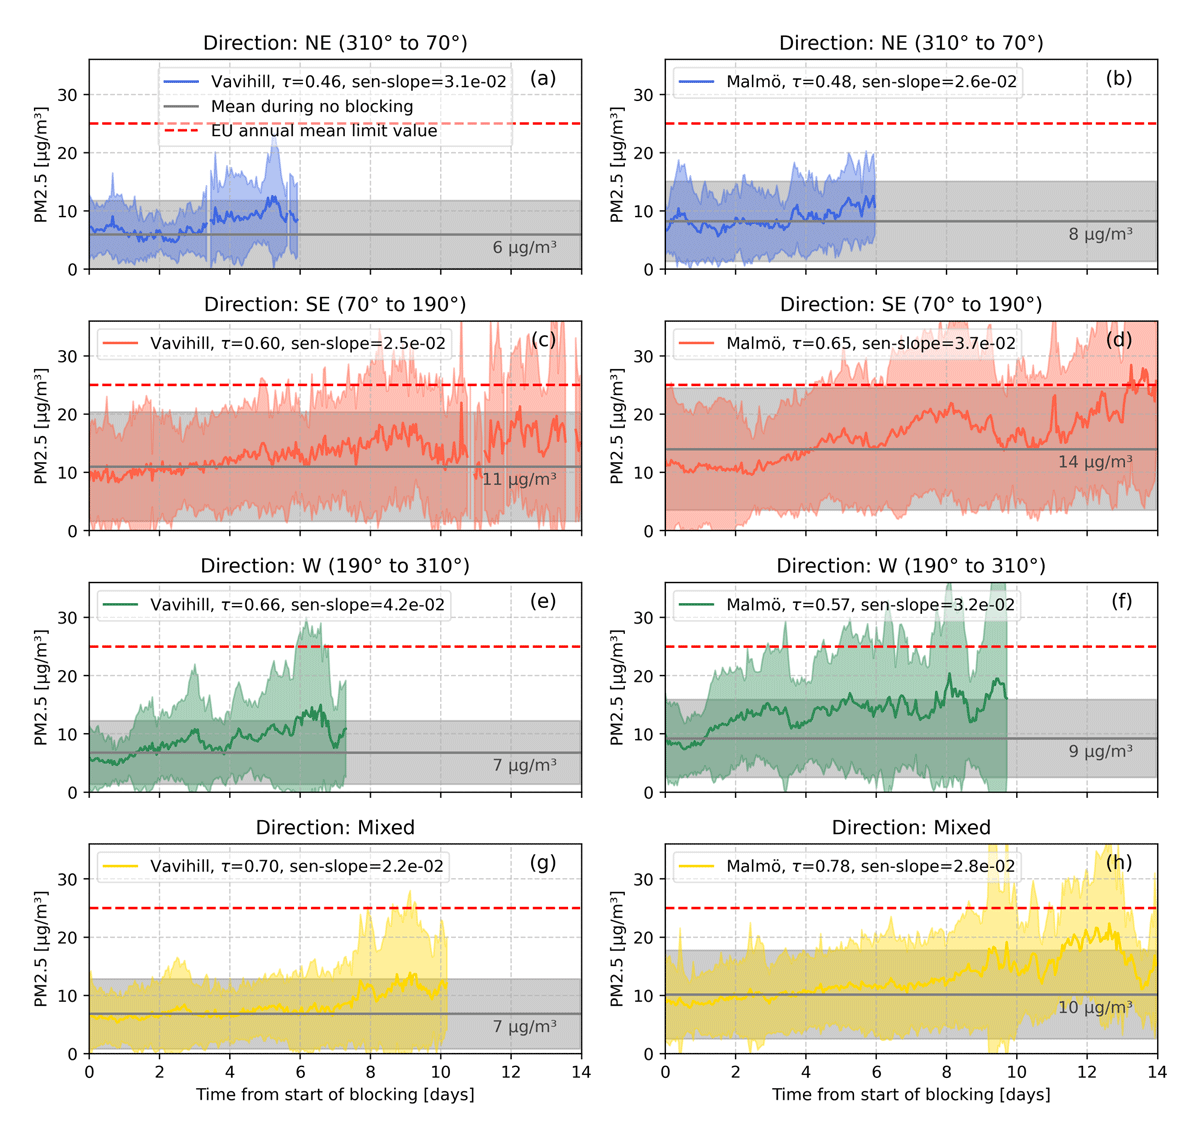
Figure 6
PM2.5 concentrations evolution in Vavihill and Malmö for different wind directions during high-pressure blocking events. This is shown by the different coloured lines, and the EU annual mean limit is displayed by the red line. The mean during no high-pressure blocking event for winds from each direction is seen by as the grey line. The shaded regions indicate the standard deviation of the data.
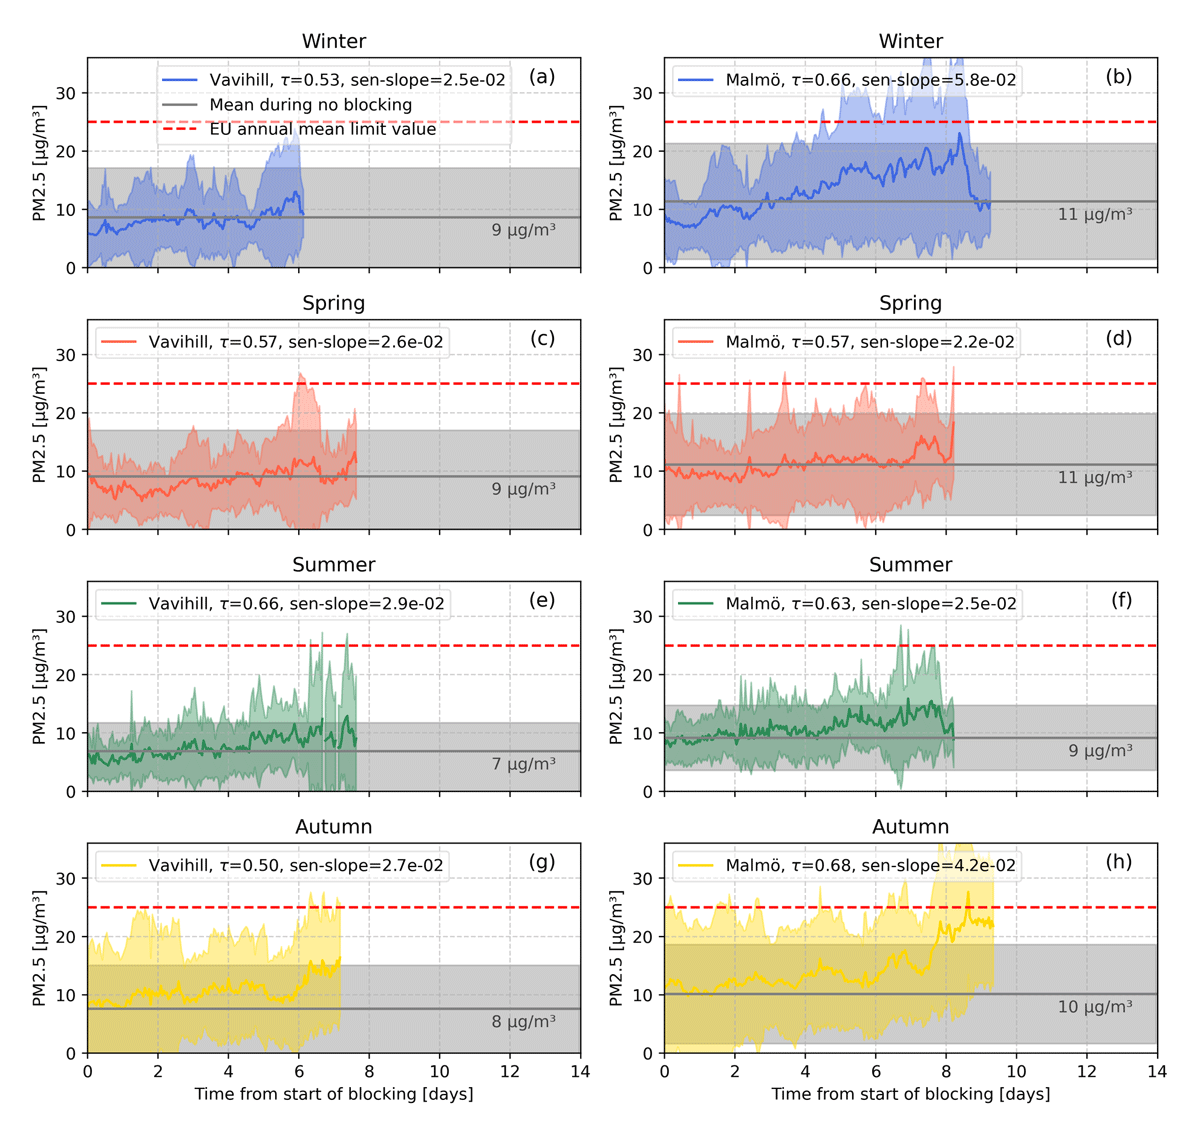
Figure 7
PM2.5 concentrations in Vavihill and Malmö during high-pressure blocking events for different seasons. This is shown by the different coloured lines, with the EU annual mean limit displayed by the red line. The grey lines show the mean during no high-pressure blocking events for winds from each direction. The shaded regions indicate the standard deviation of the data.
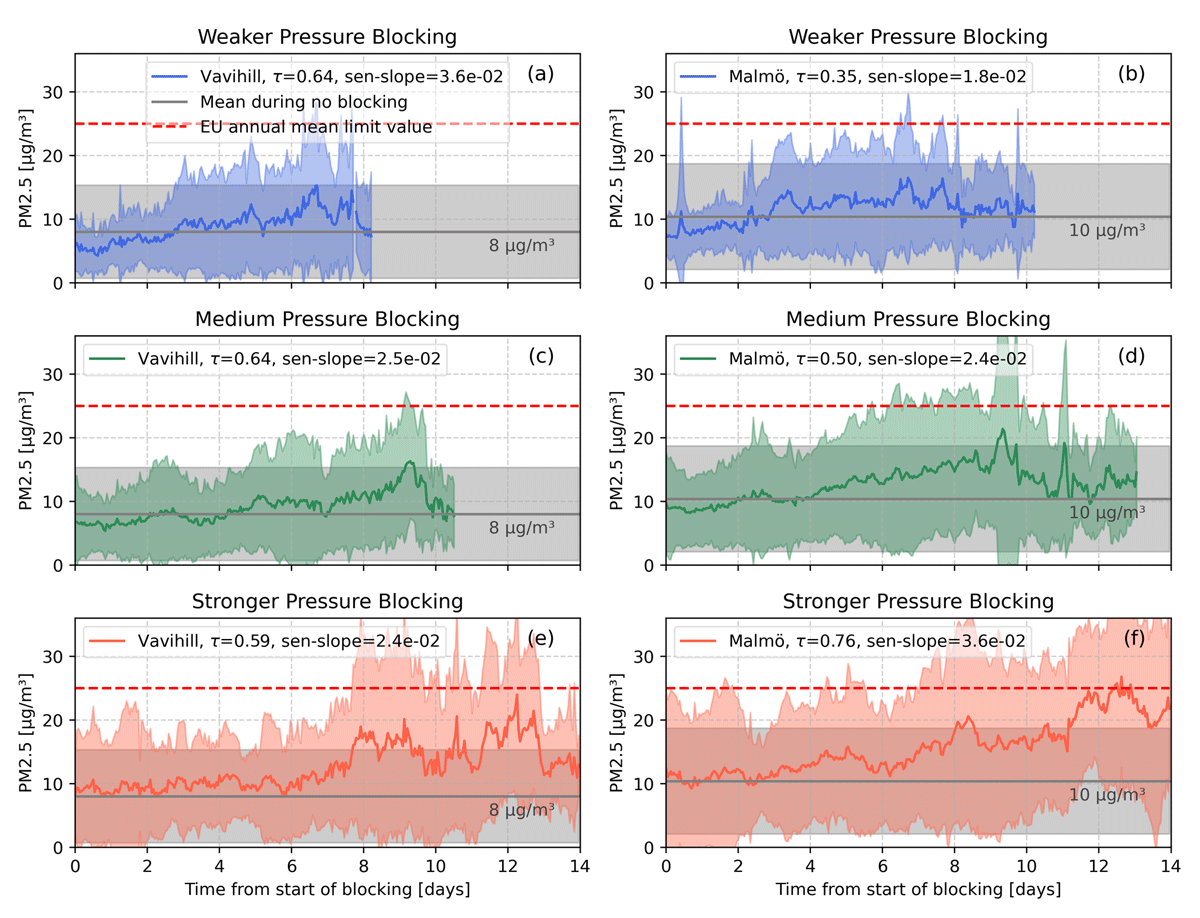
Figure 8
PM2.5 concentrations in Vavihill and Malmö for different average pressures during high-pressure blocking events. This is shown by the coloured lines, the mean during no high-pressure blocking events can be seen by the grey line and the EU annual mean limit is displayed by the red line. The shaded regions indicate the standard deviation of the data.
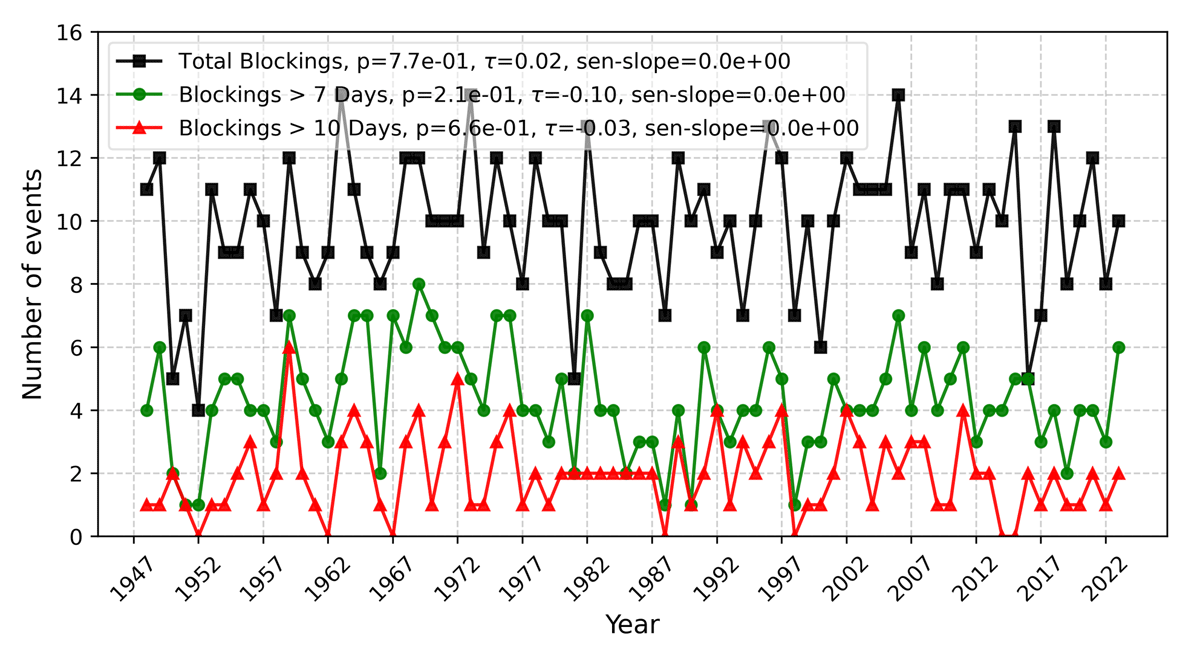
Figure 9
The change in frequency of high-pressure blocking events. The plot also indicates the change in events longer than seven and ten days.
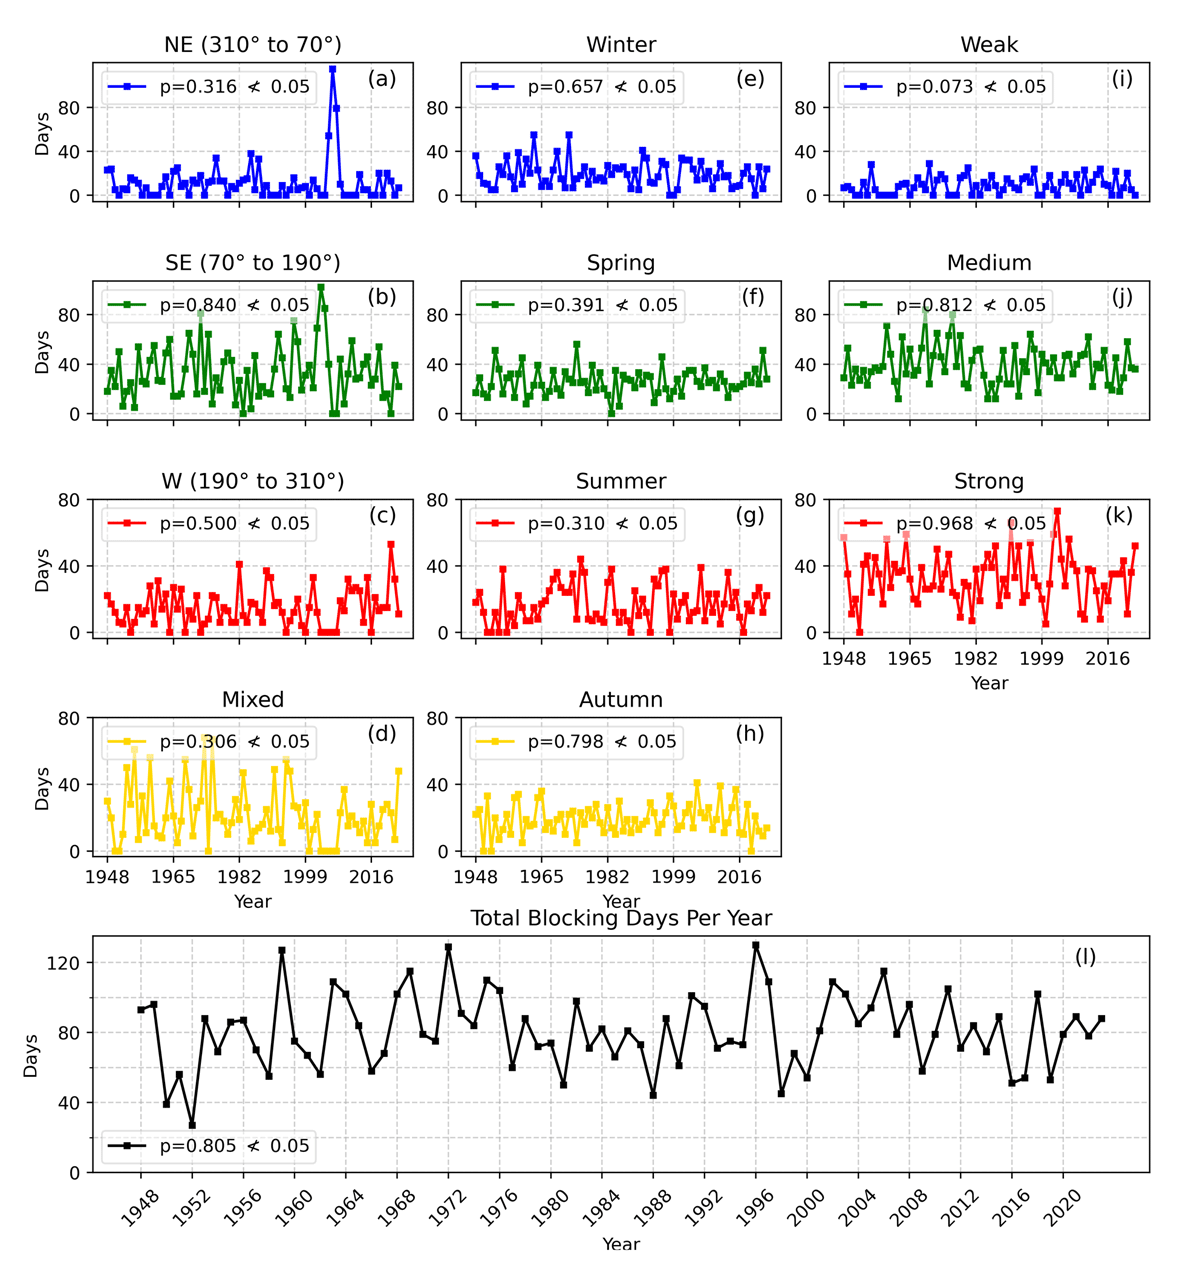
Figure 10
The number of days under a high-pressure blocking event each year, during each season, and for different pressure strengths. Since the p-values were greater than 0.05, the corresponding τ-value and Sen’s slope are not shown, as the test was deemed statistically insignificant.