
1 Introduction
Atmospheric ammonia (NH3) has significant environmental impacts through various effects on air quality, ecosystems and climate (Behera et al., 2013; Nair and Yu, 2020). Ammonia contributes to the formation of airborne particulate matter (PM), which has significant health and climate impacts. Deposition of nitrogen species also has detrimental effects on water, soil and plants. The dominating ammonia emission source is agricultural activities, including fertilizer use and animal husbandry (Anderson, Strader and Davidson, 2003; Beaudor et al., 2023; Wyer et al., 2022). While anthropogenic emissions of other nitrogen species, primarily nitrogen oxides (NOx), are generally decreasing in Europe, reducing ammonia emissions has proved difficult (Van Damme et al., 2021). In the European Union, ammonia remains the most significant challenge for the national emission reduction commitments, with several Member States yet not reaching their targets (EEA, 2024a).
Ammonia is a central component of secondary aerosol formation: gaseous NH3 forms particulate ammonium nitrate and ammonium sulfate, which make a substantial contribution to total PM (Wyer et al., 2022). PM, characterized by the PM2.5 and PM10 metrics corresponding to the total mass of particles smaller than 2.5 and 10 μm, respectively, is among key air pollutants, causing respiratory and cardiovascular diseases and premature mortality (Apte et al., 2018; Lelieveld et al., 2015). The majority of the urban population in Europe continues to be exposed to unsafe PM concentrations, with exceedances of EU and WHO limit values also in the Nordic countries that are among regions with lowest pollution levels (EEA, 2024c).
Atmospheric particles are also climate forcers with a significant role in the global radiation budget, with nitrate aerosols causing a net cooling effect (Xu and Penner, 2012). As sulfate aerosols are reduced due to declining sulfur emissions, nitrate aerosols are expected to become more important (Bauer et al., 2007; Pye et al., 2009). Consequently, agricultural ammonia emissions are a central question for the future climate forcing attributed to anthropogenic aerosols (Hauglustaine, Balkanski and Schulz, 2014). In addition to secondary aerosol formation onto existing particles, ammonia contributes to nucleation of new particles from gases through the sulfuric acid–ammonia nucleation pathway (Dunne et al., 2016; Smith et al., 2021). New-particle formation has substantial effects on particle numbers, which are critical for cloud formation and indirect aerosol effects through aerosol–cloud–climate interactions (Kerminen et al., 2012). The nucleation pathway can often be limited by the availability of ammonia, thus making ammonia relevant for both particle mass and number.
Deposition of atmospheric nitrogen species to soil and water is a major environmental threat, causing eutrophication, nutrient imbalances and loss of biodiversity (Dise et al., 2011; Guthrie et al., 2018). Despite the declining trend in nitrogen deposition due to emission reductions, current deposition levels still exceed those of the preindustrial era (Engardt et al., 2017; Kanakidou et al., 2016). Northern Europe covers both ecosystems under significant stress from eutrophication, including the brackish Baltic Sea, as well as relatively pristine areas with comparatively low historical nitrogen deposition, such as natural areas in Lapland and the Scandinavian Mountain Range (Andersen et al., 2017; Manninen et al., 2024; Nordin et al., 2005). Continued decline in nitrogen deposition is a prerequisite for ecosystem recovery and preventing disturbances in potentially sensitive ecosystems.
In Sweden, the main atmospheric anthropogenic nitrogen sources are road transport, industry and agriculture, including emissions of NOx, NH3 and to a minor extent N2O (Moldan et al., 2022; SMHI, 2025c). The transport sector is the largest emitter of NOx, however with a continuous declining trend in the emissions. NH3 emissions from the agricultural sector, on the other hand, have not decreased significantly during the last decades (SMHI, 2025c). As for now, Sweden is not meeting the emission reduction commitments for 2030 for NH3 or NOx, and further reductions are needed for both species (EEA, 2024a). In addition to Swedish emissions, long-range atmospheric transport makes a major contribution to the Swedish nitrogen budget (SMHI, 2025b). For example, most nitrogen deposition in Sweden has been attributed to emissions elsewhere (Moldan et al., 2022). In the vicinity of Sweden, major emitters of nitrogen and NH3 include e.g. the Netherlands, Germany and also Denmark with a relatively large agricultural sector (Dalgaard et al., 2014; EEA, 2024b). Nitrogen and other main air pollutants in Sweden are monitored in the national monitoring program for air, including measurements and regional model assessments (Alpfjord Wylde, Leung and Andersson, 2023; SMHI, 2025b; Tørseth, 2016). The main monitored pollutants include ozone (O3), nitrogen dioxide (NO2), PM2.5 and PM10, and deposition of nitrogen and sulfur. While regional modeling includes NH3 emissions, ammonia is not assessed or evaluated separately.
This work presents regional model assessments of ammonia and related nitrogen species in Europe, with focus on Sweden. The purpose is to:
Benchmark the model performance for the relevant species in order to establish a model setup for assessments of NH3 effects, also including possibility to integrate NH3 to other national air quality modeling.
Assess the possibilities to mitigate ammonia and nitrate species in Sweden by reducing national agricultural emissions.
For this, we apply the chemical transport model MATCH (Multi-scale Atmospheric Transport and Chemistry model; Robertson, Langner and Engardt, 1999) over Europe, and over Sweden at a higher spatial resolution. Simulations over the European domain are used for model evaluation against measurement data from various European field stations, and the nested Swedish domain is applied to assess the national emission reduction effects. We use anthropogenic emission data from the national emission database, and introduce model updates for the treatment of surface–atmosphere NH3 fluxes.
Emission reduction tests are performed by scaling down Swedish emissions by 20%. This is an ambitious but realistic reduction target considering the Swedish emission reduction commitments within the European Green Deal framework (EEA, 2024a; European Commission, 2019). We address specifically the following questions:
How much can Sweden affect the national levels of NH3, fine particulate matter PM2.5 and deposited nitrogen by decreasing its own NH3 emissions?
How efficient is reducing agricultural emissions of NH3 as a measure to abate atmospheric nitrogen, as compared to reducing NOx from road transport by the same relative amount?
The reference test case with NOx is motivated by NH3 and NOx emissions being the major nitrogen sources, with each of them involving a single largest emission sector: agriculture for NH3, and road transports for NOx (excluding international shipping). The total annual emissions from these two sectors are currently of the same order in Sweden (SMHI, 2025c). Both species contribute to the nitrogen budget and to the formation of inorganic PM2.5 together with sulfur species.
2 Methods
2.1 Regional chemical transport modeling
The MATCH model (Robertson, Langner and Engardt, 1999) is an established regional-scale chemical transport model (CTM) with various gas and particle chemistry and physics schemes, including photochemistry, oxidation and other gas-phase reactions, secondary aerosol formation from gases, and dry and wet deposition of gases and aerosols. MATCH is used widely in research and operational work, including national air quality modeling in Sweden (e.g. Alpfjord Wylde, Leung and Andersson, 2023; Andersson, Langner and Bergström, 2007; CAMS, 2025; SMHI, 2025a).
Detailed descriptions of the model transport schemes and boundary layer parameterization can be found in previous works (Robertson, Langner and Engardt, 1999; Colette et al., 2025). The gas-phase chemistry follows the EMEP MSC-W EmChem09 scheme (Simpson et al., 2012) with modified isoprene chemistry (Carter, 1996), and reaction rates updated according to EmChem19 (Bergström et al., 2022). Details regarding the gas-phase chemistry mechanism are given in Supplementary Information Section S3.4. Gas-to-particle conversions include the formation of secondary inorganic aerosol (SIA; consisting of ammonium sulfate and nitrate) and secondary organic aerosol (SOA). Particles are treated as bulk aerosol in two size classes, corresponding to fine and coarse PM with diameters smaller and larger than 2.5 μm, respectively. Ammonium nitrate (NH4NO3) equilibrium is calculated according to temperature- and relative humidity-dependent equilibrium coefficient (Mozurkewich, 1993), and coarse nitrate formation is described by transfer of gaseous nitric acid (HNO3) to aerosol-phase NO3 (Strand and Hov, 1994).
Primary organic aerosol emissions are treated as non-volatile in the model setup used in this study. Secondary organic aerosol formation from oxidation of volatile organic compounds (VOC) is treated using a volatility basis set (VBS) scheme (Bergström et al., 2012). This includes anthropogenic SOA (ASOA) mainly from aromatic hydrocarbons, and biogenic SOA (BSOA) from isoprene, monoterpenes and sesquiterpenes. A simple scheme that does not include atmospheric aging of the SOA species is used (Langner et al., 2020), which is a slightly modified version of the VBS-NPNA scheme (Bergström et al., 2012).
MATCH has a number of different options for the treatment of wet and dry deposition of gases and particles. Here, relatively simple scavenging coefficients are used for gases and particles that are subject to wet deposition, as described in Supplementary Information Section S3.5. Dry deposition of gases by the resistance model, aerosol dry deposition, and stomatal resistance are described following the EMEP MSC-W schemes (Simpson et al., 2012). In this work, the dry deposition description of NH3 is updated to a bidirectional flux parameterization (Wichink Kruit et al., 2017 and references therein) within the model development project Nordic Nature & Nitrogen to improve simulation of nitrogen in the Nordic countries (Frohn et al., 2025). While the standard resistance model assumes only one-directional flux of NH3 from the atmosphere to the surface, the bidirectional flux approach considers also the opposite flux to the atmosphere. The opposite flux is based on compensation points, corresponding to concentrations already present in the media, that determine the ability to take up more gas. Here, the main focus is uptake on vegetated surfaces, as described in Supplementary Information Section S3.1.
MATCH is applied for the European domain at a spatial resolution of 0.2° × 0.2° and for a nested domain over Sweden at a resolution of 5 km × 5 km (see e.g. Figure 1 and Figure 2 for the two domains). The European domain is used for model evaluation by large sets of available quality-controlled observation data (Sections 2.2 and 2.3). The high-resolution domain is designed to be used in national air quality modeling for Sweden, and to study the national emission reduction effects. European-scale modeling is performed for selected full years, including 2017 and 2019, which are considered representative for recent trends. This excludes years corresponding to the COVID-19 pandemic and 2018, which was an unusually warm year in Sweden with exceptional heatwaves and forest fires. We focus on 2019, and perform additional model evaluation for 2017 to ensure the robustness of the model results. The Swedish emission reduction assessments are conducted for 2019.
The MATCH simulations use meteorological data from the European Centre for Medium-Range Weather Forecasts Integrated Forecast System (IFS) (ECMWF, 2025) with 50 hybrid vertical levels, reduced to 25 levels in the MATCH model corresponding to a vertical extent of approximately 6–8 km. In the present study, land-use data are based on the CCE CLC/SEI database (LRTAP, 2025); 16 different land-cover classes are included (as in Simpson et al., 2012). For the European-scale simulations, anthropogenic emissions are obtained from the CAMS-REG emission inventory, using version V5.1c and with emission year 2018 applied for all years 2017–2019 (Denier van der Gon, Gauss and Granier, 2023, pp. 8–18; Kuenen et al., 2022). Swedish anthropogenic emissions from the SMED database (SMED, 2025) are used for the Swedish-domain simulations. Emissions are distributed temporally according to the CAMS-REG-TEMPO-v3.1 profiles (Denier van der Gon, Gauss and Granier, 2023, pp. 32–47; Guevara et al., 2021). The emission-sector-dependent split of total volatile organic compounds into the different VOC model species (Table S2) is based on data from CAMS (Kuenen et al., 2022; following a similar methodology as Bergström et al., 2022). Details and further information about the emission setup are given in Supplementary Information Section S3.2.
Biogenic emissions of isoprene and monoterpenes are calculated in the model (using the methodology of Simpson et al., 2012); sesquiterpene emissions are also added based on plant chamber experiments with no observable biotic stress (5% of the monoterpene emissions; following Bergström et al., 2014). Emission of sea salt particulate matter is modelled based on a parameterisation considering wind speed, water salinity and water temperature (Sofiev et al., 2011). Natural aeolian dust emissions are modelled based on the DEAD model (Zender, Bian and Newman, 2003). Gaseous and particulate emissions from biomass fires are taken from the GFAS fire emission database (Kaiser et al., 2012) (Supplementary Information Section S3.3). Emissions of sulfur species from seas and volcanoes (here Etna, Stromboli, Vulcano) are included in a simplified manner; oceanic dimethyl sulfide is treated as oxidized to SO2 and sulfate before being introduced in the model.
Boundary data for the European-scale domain is obtained from the IFS global forecasts for the following species: NO, NO2, HNO3, PAN, O3, SO2, CO, CH4, C2H6, C2H4, C5H8, HCHO, sulfate and desert dust similar to the operational CAMS system (Colette et al., 2025), but in the present study the global boundary data are read with 6-hour intervals. For other model species, the model uses seasonal climatological boundary concentrations. Results of the European-scale simulations are used as boundary data for the nested Swedish-scale simulations for all advected model components; these boundary data are read with 3-hour intervals and interpolated in the model.
2.2 Studied species
To assess the impacts of emission reductions, we examine selected air quality and environmental indices that are expected to be notably affected by ammonia:
Gas-phase NH3
PM2.5
Nitrogen deposition (Ndep)
For model evaluation, we also apply available observation data for related nitrogen species:
Total ammonia and ammonium NHx = NH3(g) + NH4+(pm)
Total nitric acid and particulate nitrate ΣNO3 = HNO3(g) + NO3–(pm)
Finally, in addition to the species directly related to ammonia, we benchmark the model setup against observation data for other common pollutants, namely:
O3
NO2
PM10
We study and evaluate the atmospheric concentration data at hourly or daily time resolution, depending on the component: O3 and NO2 components exhibit distinct diurnal cycles that are typically well described by models, and thus hourly resolution is applied. For other gas and aerosol components, daily mean values are used due to both availability of observation data (see Section 2.3) and diurnal variations being less important for model evaluation. For deposition, seasonal accumulated values are studied.
2.3 Observation data
Model results are evaluated against surface observations from atmospheric monitoring sites at hourly or daily temporal resolution, retrieved from the EBAS atmospheric database (EBAS, 2025). For NH3, we use also additional observations collected from national databases: data collected by Aarhus University for Denmark (Ellermann et al., 2021; stations DK-01, DK-09, DK-10), and the RIVM database for the Netherlands (RIVM, 2025; stations NL10131, NL10444, NL10538, NL10633, NL10738, NL10929).
For some species, here NH3, PM2.5 and PM10, observation data are available at both hourly and daily resolutions, typically for different stations. For these species, hourly data are converted to daily means for consistency and for improved spatial data coverage. For calculating evaluation statistics for given periods (e.g. monthly or seasonal), at least 67% (2/3) observation data coverage is required.
For NHx, data are combined by complementing available NHx data with additional reported NH3 and NH4 data aggregated into the sum component NHx. This allows including four Danish stations that only report NH3 and NH4 separately but are relevant for evaluating model performance in Northern Europe.
2.4 Emission reduction assessments
The effects of Swedish national emission reductions are tested by scaling down the emissions from the given sectors by 20%. The scaling is applied temporally and spatially uniformly to (1) NH3 emissions from the agricultural sector, and (2) NOx (as NO2) emissions from the road transport sector. These tests are performed using the high-resolution domain over Sweden and surrounding areas.
The magnitude of the test reductions is in line with the Swedish commitments for 2030, for which NH3 and NOx emissions need to be reduced by 7% and 37%, respectively (EEA, 2024a). For simplicity, the same reduction is applied for both components. For NH3 the scaling factor is more ambitious, but such goals are relevant for assessing the potential effects and benefits of lower NH3 emissions, considering the urgent need to reduce the emissions both in Sweden and elsewhere.
3 Results and discussion
The results are organized as follows: First, model results are presented and evaluated focusing on the larger European domain, with additional evaluation for the nested high-resolution domain (Sections 3.1 and 3.2). Second, assessments of national emission reduction effects are presented for the Swedish domain (Section 3.3). As NH3 emissions have a strong seasonal dependence, we focus on season-wise analysis. The main findings and implications are summarized and further discussed in Section 3.4. Results are shown for 2019; the model evaluation for 2017 gives similar results as summarized in the text.
3.1 Modeled regional concentrations
Figures 1 and 2 present seasonal means of gas-phase NH3 simulated by the MATCH model for the European and Swedish domains, respectively. The highest concentrations in Europe, appearing at spring and summer time, are located around major agricultural sources (Figure S18). In the vicinity of Sweden, these include sources in Denmark, the Netherlands and Northern Germany (Figure 1). As expected, total reduced nitrogen species NHx exhibit similar patterns as NH3 (to some extent, the modeled total oxidized nitrogen also shows similar distributions; Figure S1). NH3 concentrations are generally lower in Northern Europe except for Denmark, with the highest Nordic concentrations (excluding Denmark) located in southern parts of Sweden and Finland, and Southern and mid-Norway. In Sweden, elevated NH3 levels are centered upon the southernmost areas (Figure 2).
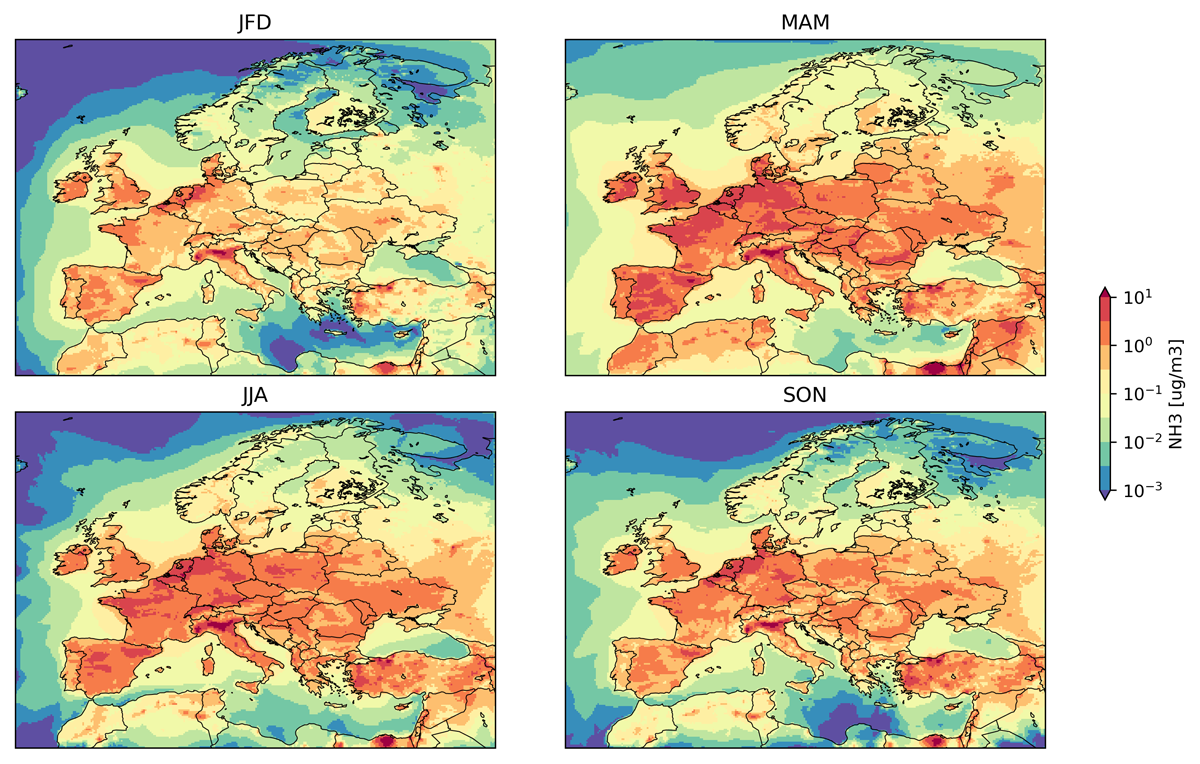
Figure 1
Seasonal (3-month) mean values of modeled NH3 concentrations for the European model domain for 2019. The seasons are as follows: JFD: January, February, December; MAM: March, April, May; JJA: June, July, August; SON: September, October, November.
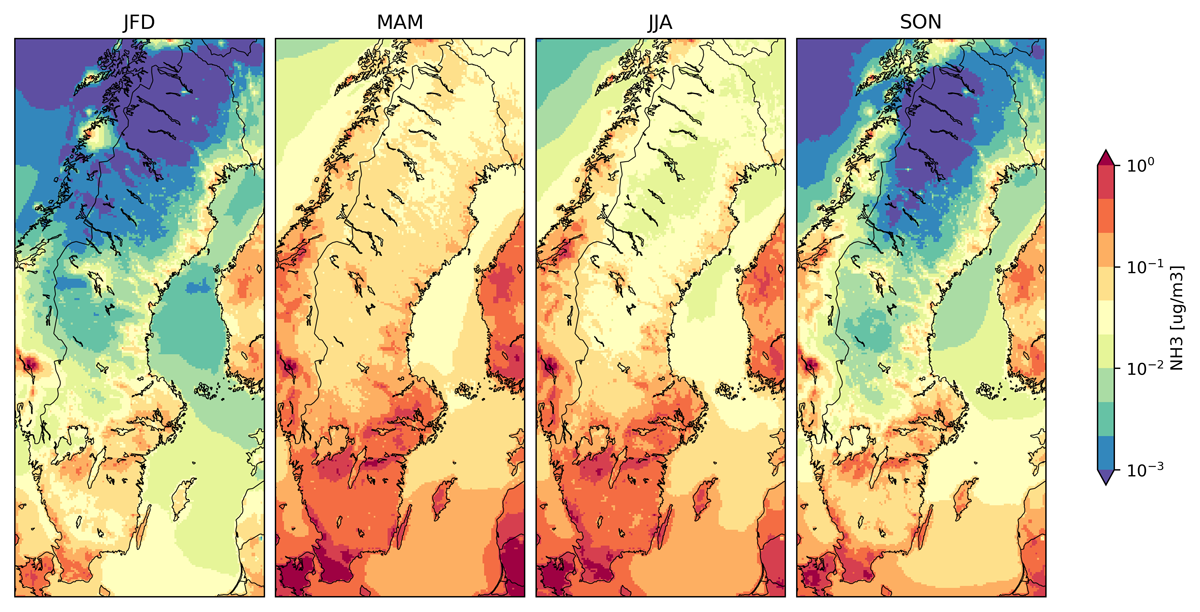
Figure 2
Seasonal mean values of modeled NH3 concentrations for the Swedish model domain for 2019. Note the different y-axis scale compared with Figure 1.
3.2 Model–measurement comparisons
Figure 3 shows monthly modeled and observed NH3 concentrations, normalized mean bias (NMB) and correlation over all stations for the two model domains. Seasonal station-wise NMB and correlation for the European domain are shown in Figure 4; the station-wise statistics are similar for the Swedish-domain simulation. The global monthly trends, here characterized by the median and the 25th and 75th percentiles, are qualitatively well represented by the model (Figure 3, panels (a) and (d)). The modeled and observed distributions show a spring peak due to application of fertilizers, followed by elevated levels in summer time and decline towards winter.
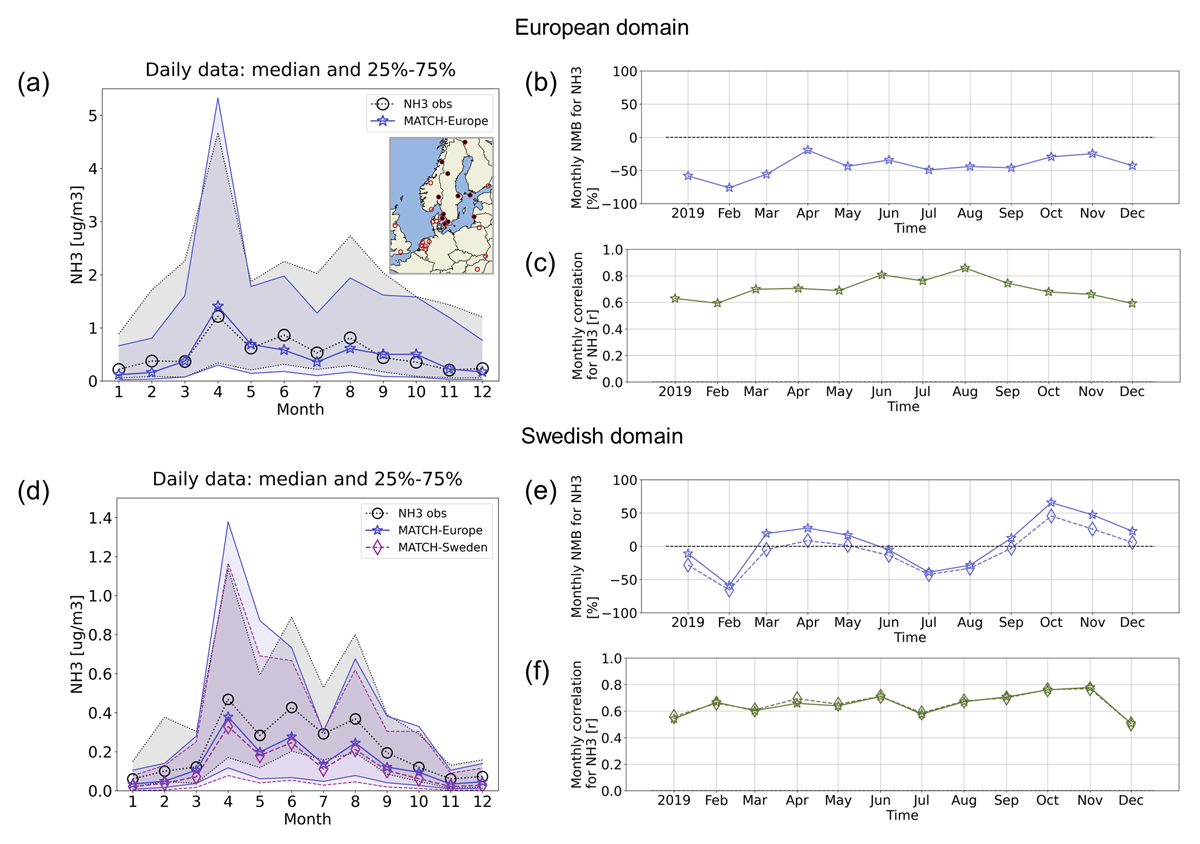
Figure 3
Monthly NH3 concentrations and evaluation statistics over all measurement stations for the European (panels (a)–(c)) and Swedish (panels (d)–(f)) model domains. Panels (a) and (d): Annual distribution of modeled and observed daily mean NH3 concentrations. Panels (b) and (e): Monthly global normalized mean bias (NMB). Panels (c) and (f): Monthly global Pearson correlation coefficient. Panels for the Swedish model domain ((d)–(f)) include only the stations in the Sweden-centered domain and show results from both the Swedish-scale and the coarser-resolution European-scale simulations. All stations are marked with red circles on the inset map in panel (a), with the Swedish-domain stations filled with black.
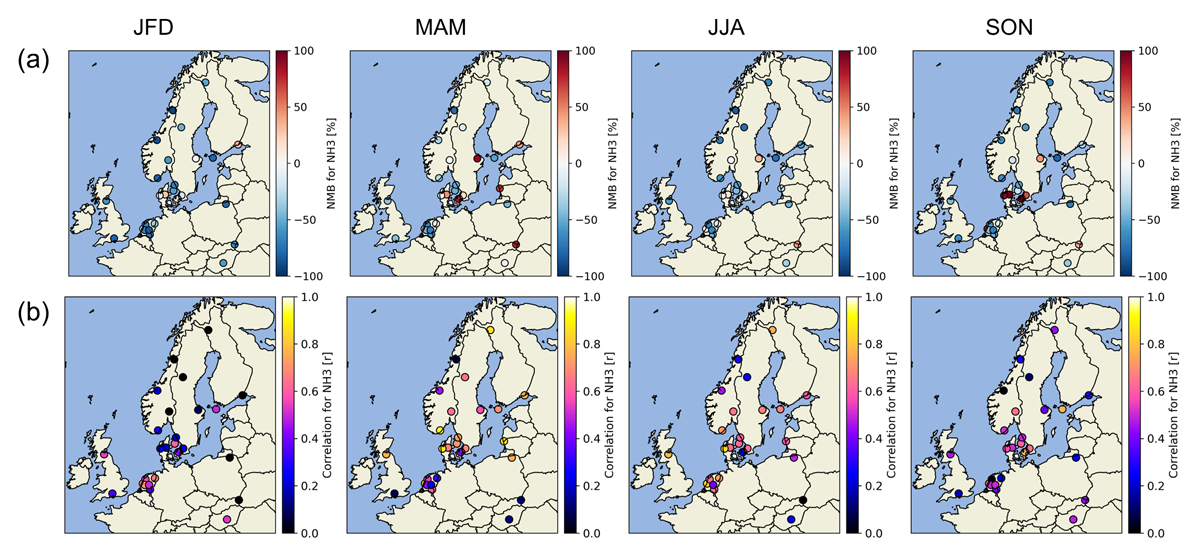
Figure 4
Seasonal evaluation statistics for modeled daily mean NH3 concentrations for the European model domain. Panel (a): Normalized mean bias (NMB). Panel (b): Pearson correlation coefficient.
The available observations primarily cover Fennoscandia and Netherlands, with a few individual stations in United Kingdom and Eastern Europe (Figure 4). In general, modeled concentrations tend to be lower than measured values, with some overestimation in spring and autumn seasons mainly at a few stations in Denmark and Southern Sweden (Figure 4a). Correlation is generally higher in spring and summer with elevated NH3 (Figure 4b). The global monthly NMB for all available stations in the European domain varies between –76% and –19% (Figure 3b), with a global annual NMB of –44% (Table S1). For global correlation, the monthly and annual values are 0.59…0.86 (Figure 3c) and 0.65 (Table S1), respectively. The NMB and correlation values can be considered satisfactory compared to previous NH3 model studies applying a regional CTM, reporting absolute NMB of 48% and correlation of 0.59 for weekly or monthly surface observations in Netherlands and Germany (Ge et al., 2020).
The overall model results are improved with the updated NH3 scheme, which decreases the positive bias in Denmark and Southern Sweden (Section S2.2; Figure S13). As shown in Figure S2, the new scheme predominantly reduces the predicted NH3 in the European domain, although some increases occur depending on location and season. The changes are due to the net effects of the updated deposition flux and the introduction of the compensation points (Supplementary Information Section S3.1). The compensation points, that determine the upward flux, peak in spring and summer, as summarized in Supplementary Information Section S1.1. Within Sweden, modeled NH3 is decreased by up to approximately a factor of 2. The relative changes are similar over the main NH3 emission areas in Southern and Central Sweden, except for the most intensive national agricultural hotspots that are less affected likely due to elevated compensation points. It can be noted that the modeled NH3 may involve more uncertainties in clean remote regions with no observations. Compensation points in such environments are less well understood, and ground emissions may occur especially under warm and dry conditions (Walker et al., 2023; Wu et al., 2023).
Evaluation statistics for the other nitrogen species NHx and ΣNO3, summarized in Figures S14, S15 and S17, are comparable to those of NH3, or in some cases better. For NHx, the global monthly NMB varies between –13% and 72%, but values higher than 25% (40%…72%) only occur in March–May. For ΣNO3, the bias is within –28%…24%. Global monthly correlation for both species is within 0.60…0.81 (Supplementary Information Section S2.2). Model evaluations for the standard regulated pollutants O3, NO2, PM2.5 and PM10 are presented in Figures S9–S12 and S16, showing performance similar to previous MATCH and other model studies (e.g. Frohn et al., 2022). It can be noted that while PM2.5 and PM10 involve more prominent systematic bias compared to the other species, this is attributed to PM components other than ammonium and nitrate that are the focus of this work (Supplementary Information Section S2.1). The European-domain simulation for 2017 shows generally similar evaluation results for the studied species in terms of NMB and correlation (Table S1), and their temporal and spatial trends. The main difference to 2019 is that NH3 doesn’t exhibit a sharp global peak in April (as in panel (a) in Figure 3). Instead, observations and model results for 2017 show only moderately elevated levels or a low maximum, respectively. This can be partly due to a few more observation stations in central Europe being available and included in the statistics. ΣNO3 involves less global month-wise variation with a rather flat median curve (compared with panel (a) in Figure S15) for both observations and model. Overall, the simulation years show similar model performance for the nitrogen species, supporting the application of the model setup for the ammonia reduction assessments. While multi-year simulations are outside the scope of the present study, long-term trends in PM simulated by the MATCH model have been evaluated in previous work (Tsyro et al., 2022). The previous European-scale simulations for 2000–2010 show decreases in PM following the European emission reductions, in line with observations and with consistent model bias without significant year-to-year variability.
3.3 Air pollution mitigation potential in Sweden by NH3 reduction
Modeled changes in nitrogen-containing species for the Swedish national emission reduction tests are presented in Figures 5, 6, 7. Decreases in gaseous NH3 upon 20% reduction of agricultural NH3 emissions are highest in regions with elevated NH3 levels and hotspots in Southern Sweden (Figure 5; cf. Figure 2). In these areas, the corresponding relative changes are within ca. –10…–20%, which suggests that such emission reductions can effectively decrease NH3 levels.
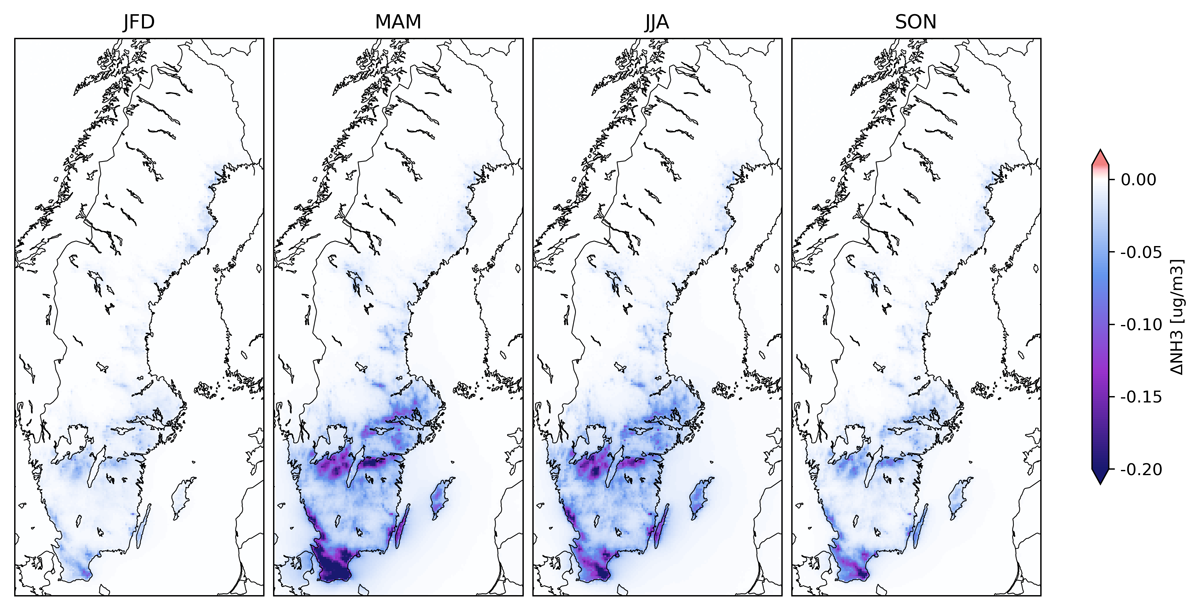
Figure 5
Predicted changes in seasonal mean NH3 concentrations in model scenario with reduced Swedish emissions for agricultural NH3.
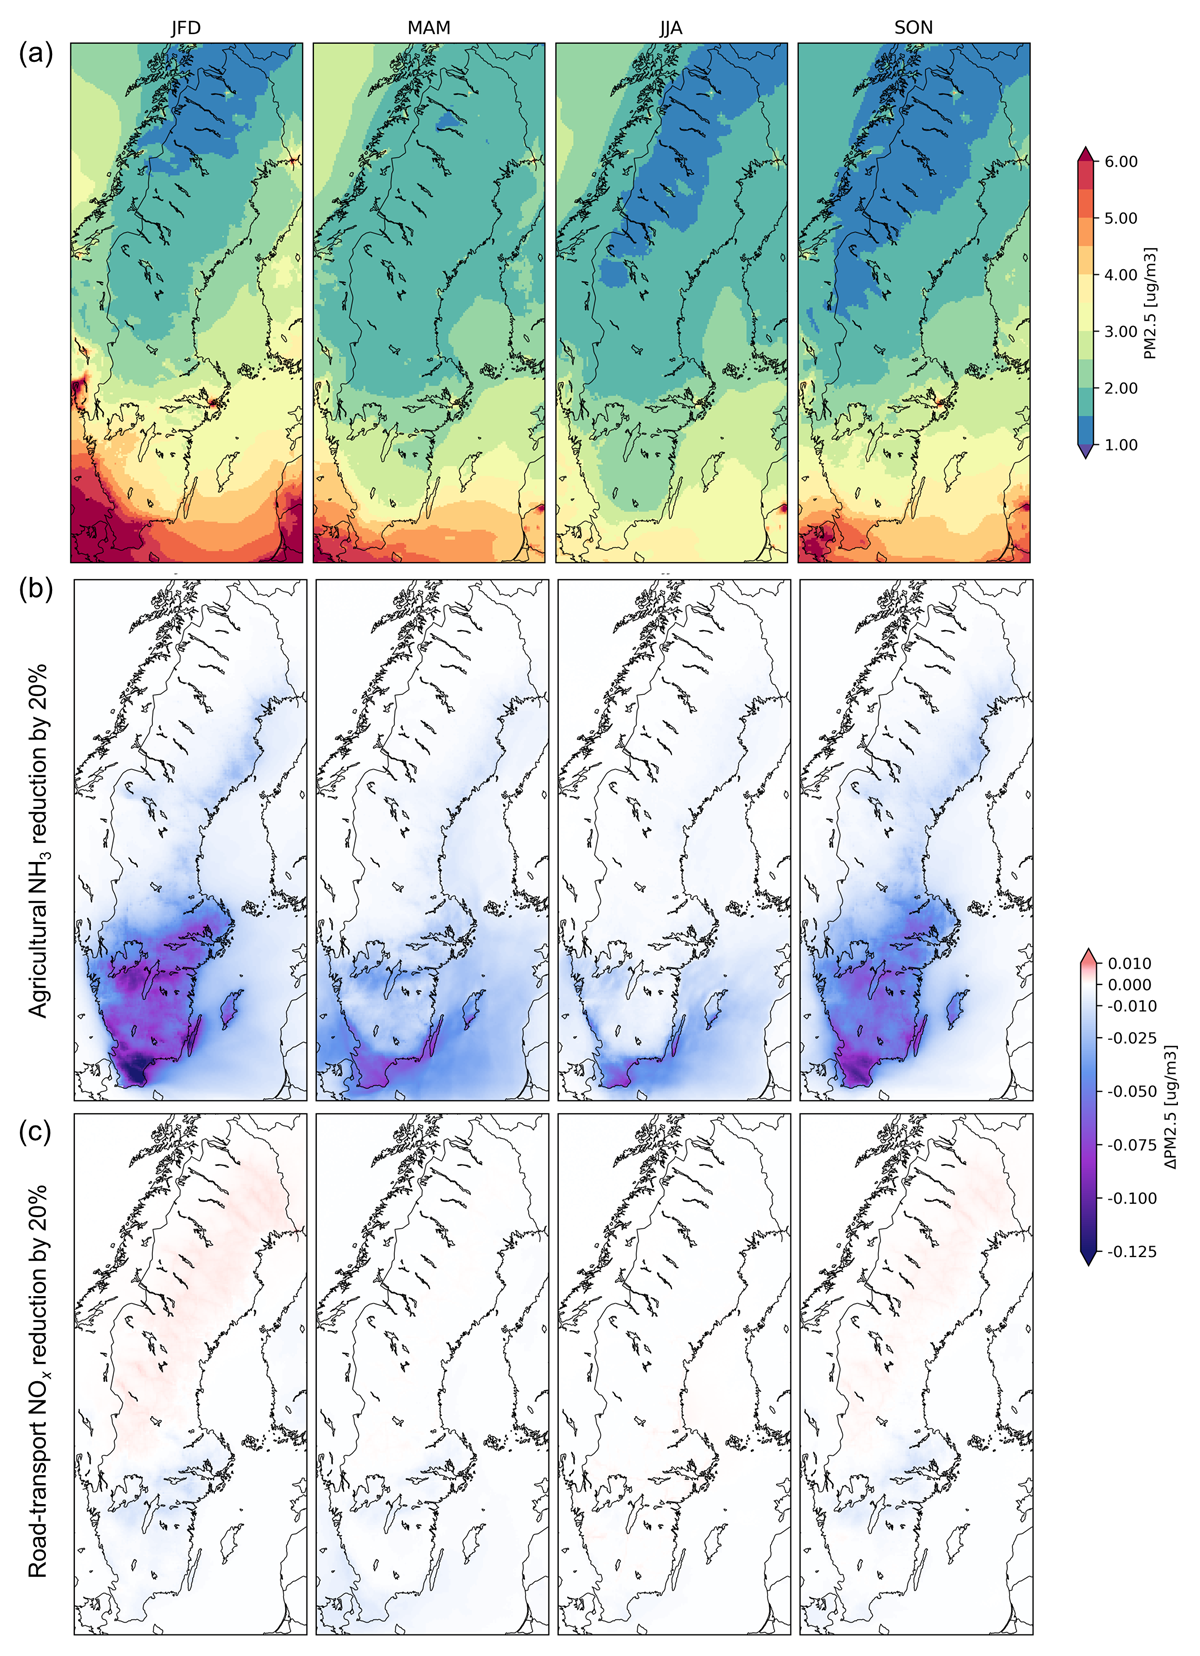
Figure 6
Panel (a): Modeled seasonal mean concentrations of PM2.5. Panels (b) and (c): Predicted changes in model scenarios with reduced Swedish emissions for agricultural NH3 (panel (b)), and NOx from road transport (panel (c)).
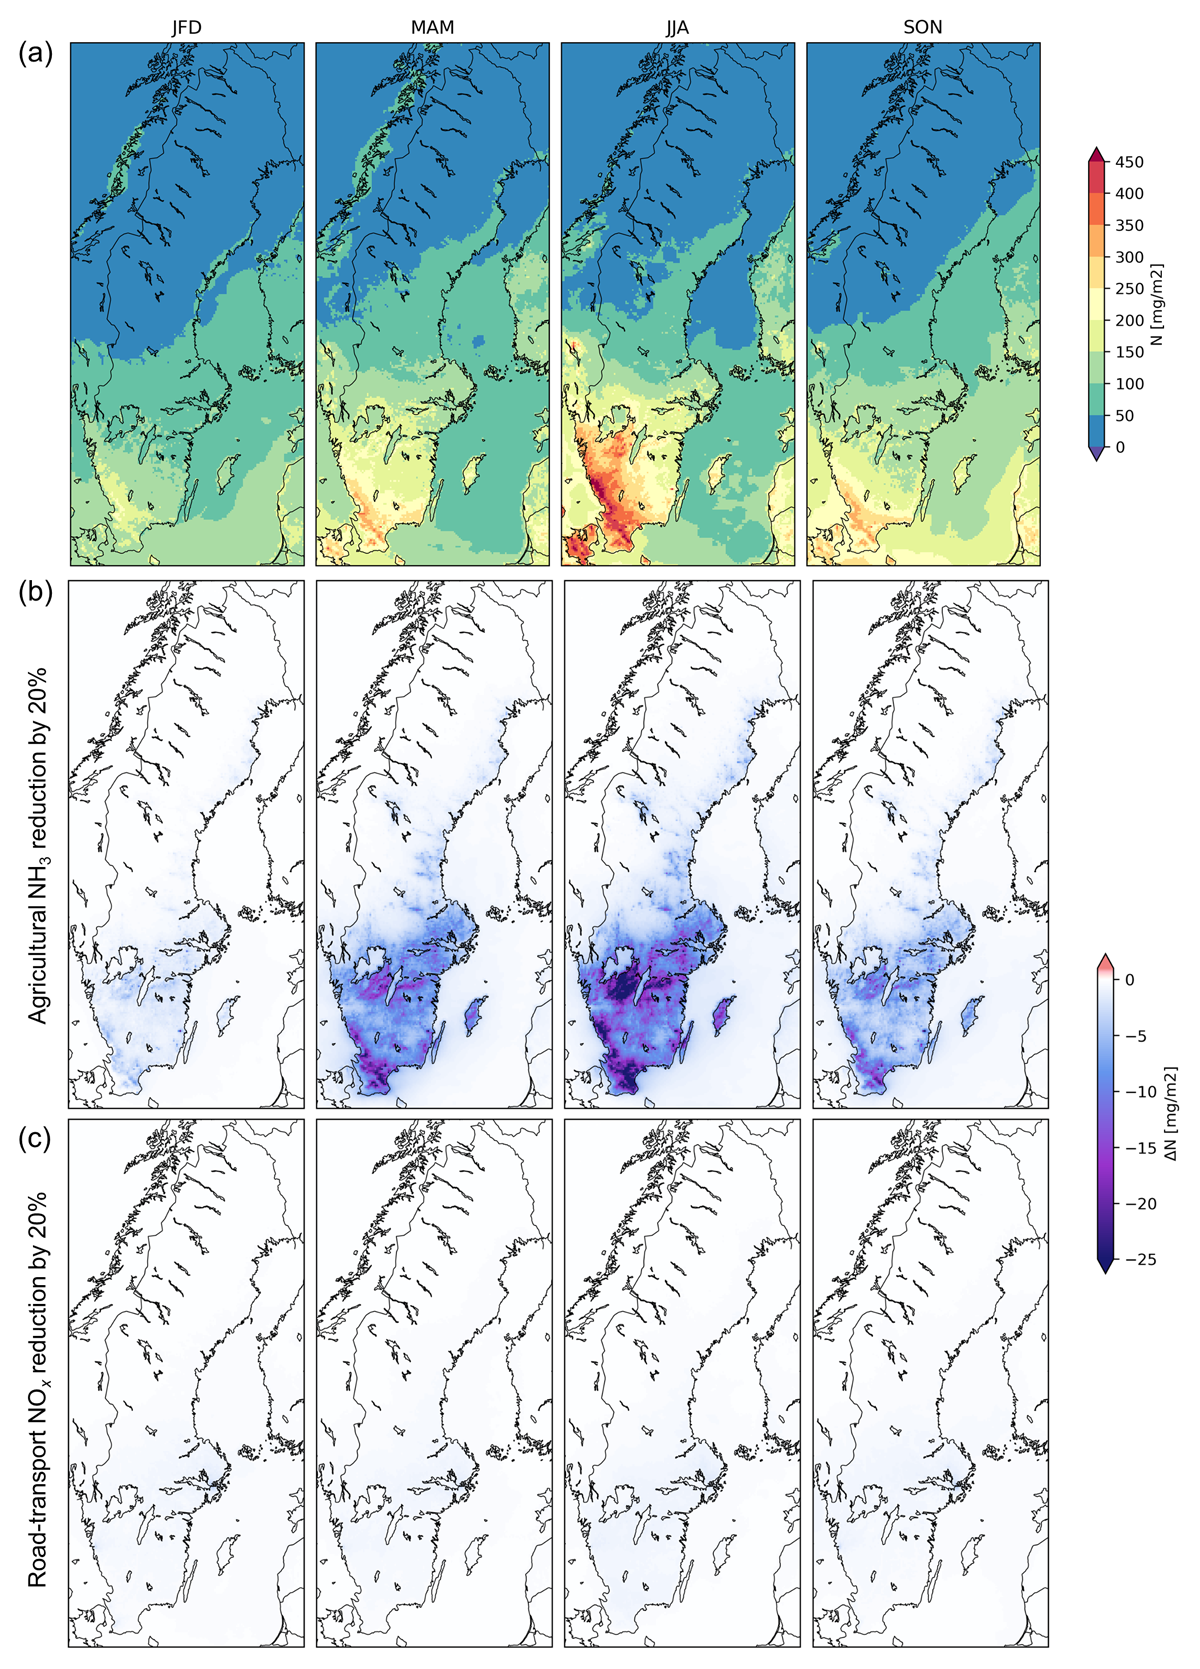
Figure 7
Panel (a): Modeled seasonal accumulated deposition of total nitrogen. Panels (b) and (c): Predicted changes in model scenarios with reduced Swedish emissions for agricultural NH3 (panel (b)), and NOx from road transport (panel (c)).
Concentrations of fine particulate matter PM2.5 and predicted effects of 20% national emission reductions in (1) agricultural NH3 and (2) road-transport NOx (as NO2) are shown in Figure 6. The decreases in seasonal PM2.5 upon reduction of NH3 (panel (b)) show similar spatial patterns as decreases in NH3 (Figure 5), as NH3 can directly contribute to inorganic PM by nitrate or sulfate formation with NOx and SO2 oxidation products, respectively. The largest decreases in PM2.5 occur during the winter and autumn seasons, when NH3 concentrations are lower. The impact is generally smaller during spring and summer with elevated NH3 levels, as PM formation is less limited by ammonia under these seasons.
By contrast, effects of NOx reduction on PM2.5 are close to negligible (panel (c)), even if NO2 levels are decreased especially in Stockholm region (Figure S3). NOx needs to undergo oxidation to form nitric acid, which finally can contribute to nitrate PM in the presence of NH3. That is, NOx reduction effects on secondary inorganic PM are limited by the availability of both oxidants and NH3, and the contribution of sulfate PM. These results agree well with previous European-scale assessments of season-dependent NH3 contributions to PM2.5 (Backes et al., 2016; Clappier et al., 2021), and with European and global estimates of the benefits of NH3 abatement over NOx (Clappier et al., 2021; Gu et al., 2021). In Figure 6c, the minor decreases in PM2.5 upon NOx reduction apply mainly to areas affected by agricultural NH3, but their magnitude is not sensitive to the NH3 levels (Figure 2). NOx reduction can also increase PM2.5 through increases in O3 (and other oxidants) and hence in the oxidative potential of the atmosphere (Gaubert et al., 2021; Jhun et al., 2015). Here, very small increases in PM2.5 are seen in Northern Sweden due to minor increases in O3 (Figure S4), mainly affecting secondary organic PM. The O3 effect may also make inorganic PM reduction less efficient due to increased NO2 and SO2 oxidation (Clappier et al., 2021).
Figure 7 shows the impacts of NH3 and NOx reductions on total deposited nitrogen mass (Ndep), including dry and wet deposition. Similarly to PM2.5 (Figure 6), reducing NH3 decreases Ndep following the NH3 reduction patterns (Figure 5), while NOx shows no or negligible effects. Here, also the season-dependent magnitude of the Ndep reduction follows that of the NH3 reduction, i.e. it shows largest reductions in spring and summer time, as the atmospheric concentration is directly linked to deposition. Here, NOx effects are limited by the relatively smaller contribution of nitrogen mass to the total emissions compared with NH3 (as a large fraction of emitted NOx mass is oxygen). A substantial contribution to the decreases in Ndep upon NH3 reduction (Figure 7b) comes from reduced dry deposition of gaseous NH3. Dry deposition, for which NH3 gas is a major component, constitutes a notable fraction of total nitrogen deposition as shown in Figures S5 and S6. Here, changes in dry deposition of NH3 contribute significantly to the total Ndep changes (panels (b) in Figure S5 and Figure 7, respectively). Reduced wet deposition has large impacts, especially in the areas with the largest total Ndep (and NH3) decreases in Southern Sweden in the summer period (Figure 7b).
3.4 Implications
Overall, the model performance for the studied reduced and oxidized nitrogen components NH3, NHx = NH3(g) + NH4+(pm) and ΣNO3 = HNO3(g) + NO3–(pm) is satisfying, especially in capturing the qualitative seasonal variations. The observed temporal trends in monthly medians and 25th–75th percentiles are qualitatively reproduced by the model, and the NMB and correlation statistics are comparable to previous regional model studies (Section 3.2).
Results obtained by the model setup for NH3 and NOx emission reduction impacts in Sweden highlight the following implications:
Reducing agricultural NH3 emissions is potentially beneficial for both human health and the environment through decreases in airborne fine particulate matter (PM2.5) and nitrogen input to ecosystems by atmospheric deposition (Ndep), respectively. Although the nitrogen budget of Sweden is affected by emissions in other countries through long-range transport, reducing national NH3 emissions has distinct impacts on air quality and environmental indicators in Sweden, especially in regions around the emission sources. It can be noted that here the reduced nitrogen input through direct deposition primarily applies to land ecosystems over areas affected by the agricultural sources, with only minor reductions for the Baltic Sea and coastal areas.
Sweden’s most urgent reduction targets currently include both NH3 and NOx. NOx reductions contribute to improved air quality by decreased NOx concentrations, but the present assessments suggest very minor or no effects on PM2.5 and Ndep. The impacts naturally depend on the applied emission scaling factors, here 20% for both species, corresponding to approximately equal reductions in total emitted mass (9.5 ktons NOx and 9.3 ktons NH3, respectively). The potential to reduce Ndep depends on the reductions in emitted nitrogen (N) mass, which is here approximately 2.6 times higher for NH3 (i.e. the relative reduction in NOx emissions would need to be substantially higher than 20% to achieve similar theoretical potential as NH3 to reduce the nitrogen inputs). On the other hand, large NOx reductions will also lead to changes in concentrations of O3 and other oxidants (OH and nitrate radicals), which may enhance secondary PM formation—and thus lead to increasing effects on PM2.5—in some regions and seasons. This makes the health and environmental impacts of changes in NOx emissions more complex.
The NH3 reduction impacts on PM2.5 exhibit a significant seasonal dependence due to the seasonally varying NH3 concentrations in relation to acidic PM precursors. NH3 reductions are most beneficial in ammonia-limited conditions, that is, in the winter half-year with low NH3 concentrations. However, it must be noted that NH3 reduction is always beneficial for decreasing Ndep, and especially at high NH3 concentrations. Here, a notable contribution to decreases in total nitrogen deposition is due to reduced direct dry deposition of gaseous NH3. The minor effects of NOx reduction on PM2.5 suggest that PM2.5 formation in Sweden is primarily not limited by NOx. In addition to NH3 reductions, secondary inorganic PM could potentially be mitigated by sulfate reduction through SOx emissions, especially in the summer season when neither NOx nor NH3 reduction show significant effects. On the other hand, Swedish SOx emissions are already relatively low and the potential for further sulfate PM reductions may be limited.
4 Conclusions
The present model assessments of agricultural ammonia emission reduction effects in Sweden indicate potential to mitigate both fine particulate matter and nitrogen input to ecosystems within Sweden. The applicability of the model setup for modeling of ammonia and related nitrogen species, including improved treatment of NH3 through bidirectional surface–atmosphere fluxes, is verified against surface observations. In terms of PM2.5 abatement, NH3 reduction is most efficient in winter and autumn when NH3 emissions are lower and PM formation is NH3-limited. However, reducing the higher NH3 emissions in spring and summer is required to efficiently reduce the atmospheric nitrogen burden and deposition to ecosystems. While Sweden also needs to reduce NOx emissions, the present assessments suggest no favorable co-effects on PM2.5 or Ndep mitigation, as neither of these is sensitive to NOx. Overall, the results show direct benefits of national NH3 reduction to air quality and environmental protection in Sweden.
Ammonia is currently the most challenging component for air pollutant emission reductions, and Sweden is among the EU Member States that are not yet reaching their present ammonia reduction goals. This work demonstrates the possibility to integrate the modeling of ammonia to national air pollution surveillance, including model assessments of emission reduction impacts. The national emission scaling tests are used to study the effects of different pollutants and emission sectors on air quality and environmental indicators, here applied to the two largest nitrogen-emitting sectors. This supports assessing the benefits and the potential of national abatement actions to mitigate pollution and harmful environmental impacts, and planning of optimal mitigation strategies.
Data Accessibility Statement
Observation data are available in the EBAS atmospheric database (ebas.nilu.no). The additional NH3 observation data for Denmark are available from Aarhus University (Lise Marie Frohn Rasmussen and Zhuyun Ye) and for the Netherlands at data.rivm.nl/data/luchtmeetnet. MATCH simulation data are available from the authors upon request.
Additional File
The additional file for this article can be found as follows:
Supplementary Information
Atmospheric Ammonia in Sweden: Regional Modeling and Assessment of National Emission Reduction Benefits. DOI: https://doi.org/10.16993/tellusb.1881.s1
Acknowledgements
We thank Lise Marie Frohn Rasmussen and Zhuyun Ye from Aarhus University for providing the additional Danish NH3 observation data, and the Nordic Nature & Nitrogen project team: Lise Marie Frohn Rasmussen, Jesper Heile Christensen, Camilla Geels, Sebastiaan Hazelhorst, David Simpson, Roy Wichink Kruit and Zhuyun Ye for discussions and helpful contributions when implementing the bidirectional flux scheme for NH3 in the MATCH model.
Competing Interests
The authors have no competing interests to declare.
Author Contributions
Conceptualization: RB, TO; Data curation: RB, TO; Formal analysis: TO; Investigation: RB, TO; Methodology: RB (model development and modeling), TO (model evaluation); Software: RB, TO; Validation: RB, TO; Visualization: TO; Writing – original draft: TO; Writing – review & editing: RB, TO.