
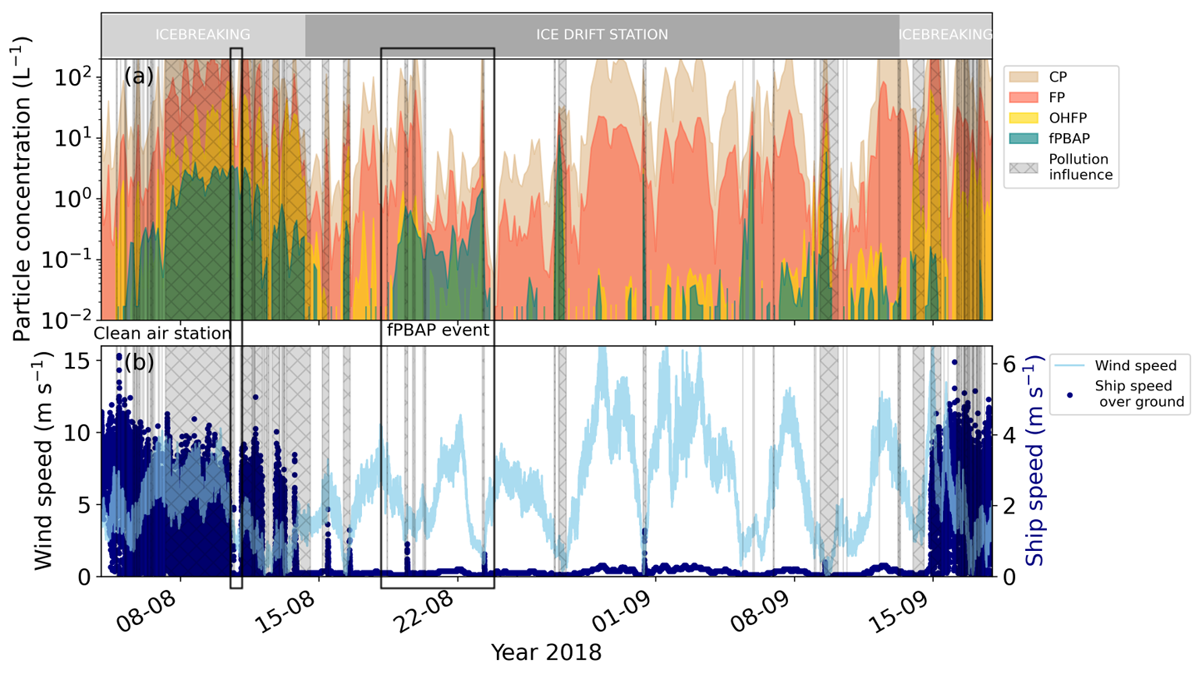
Figure 1
Observations of biological and coarse mode particles measured during Arctic Ocean 2018. (a) Concentration of coarse particles (>0.8 µm), fluorescent particles (FP), fluorescent primary biological aerosol particles (fPBAPs), and other highly-fluorescent particles (OHFP), measured by the multiparameter bioaerosol spectrometer (MBS); (b) Wind speed measured on the 7th deck of the ship (25 m a.s.l), as well as ship speed over ground. Grey hashing and shading in both panels represent periods influenced by pollution from the ship exhaust.
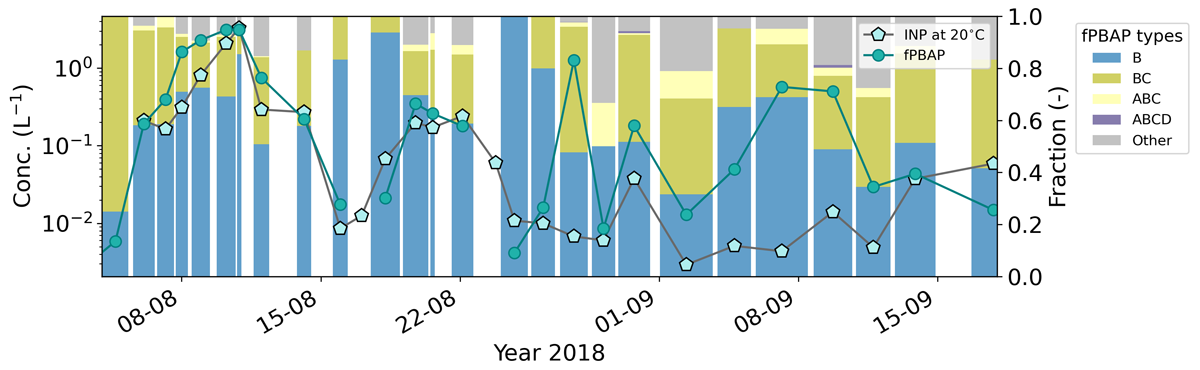
Figure 2
Comparison of biological ice nucleating particles measured during Arctic Ocean 2018. Overlays show the concentration of fluorescent primary biological aerosol particles compared to the ice nucleating particle (fPBAP) concentration at –20°C from Porter et al. (2022). Bars show the distribution of fPBAP types, the widths indicating the INP sampling times. All fPBAP data has been averaged to the INP sampling periods.
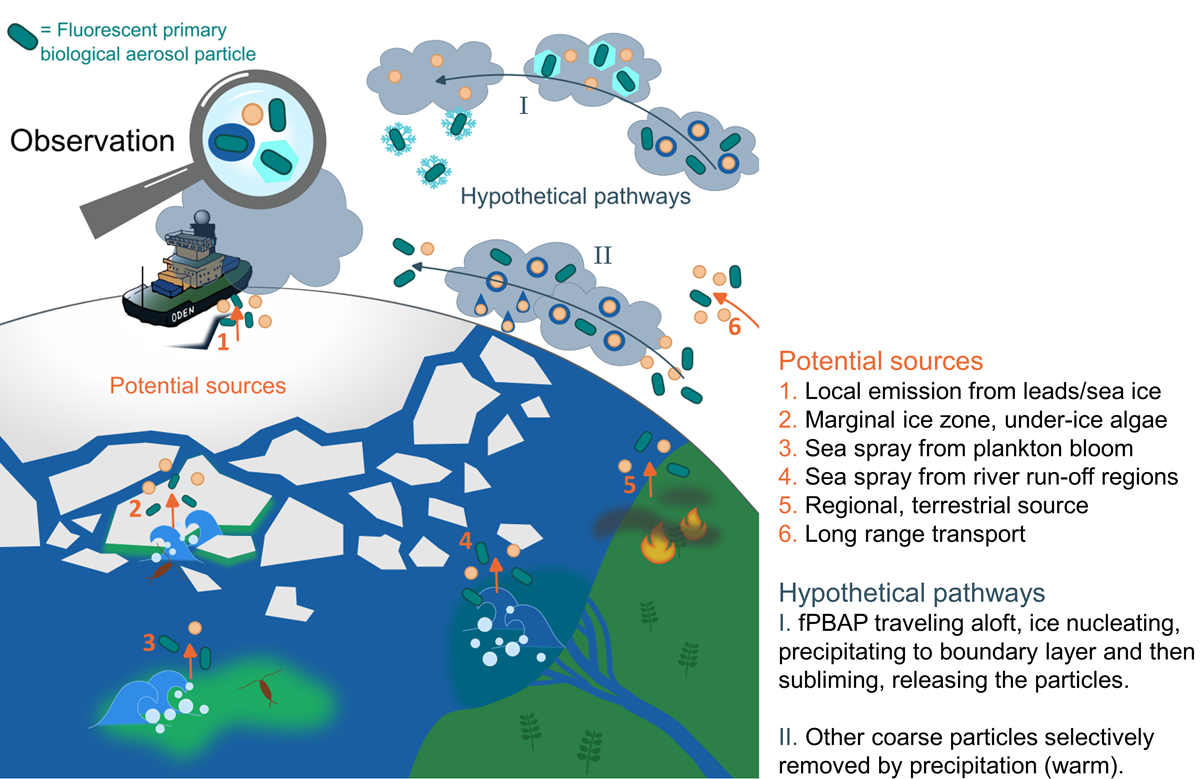
Figure 3
Schematic overview of the potential sources of bioaerosols during the event on August 19–23, 2018. Potential sources and possible transport pathways resulting in the observed increase in fluorescent primary biological aerosol particles (fPBAPs) to coarse particle concentration at the North Pole during the event are illustrated.
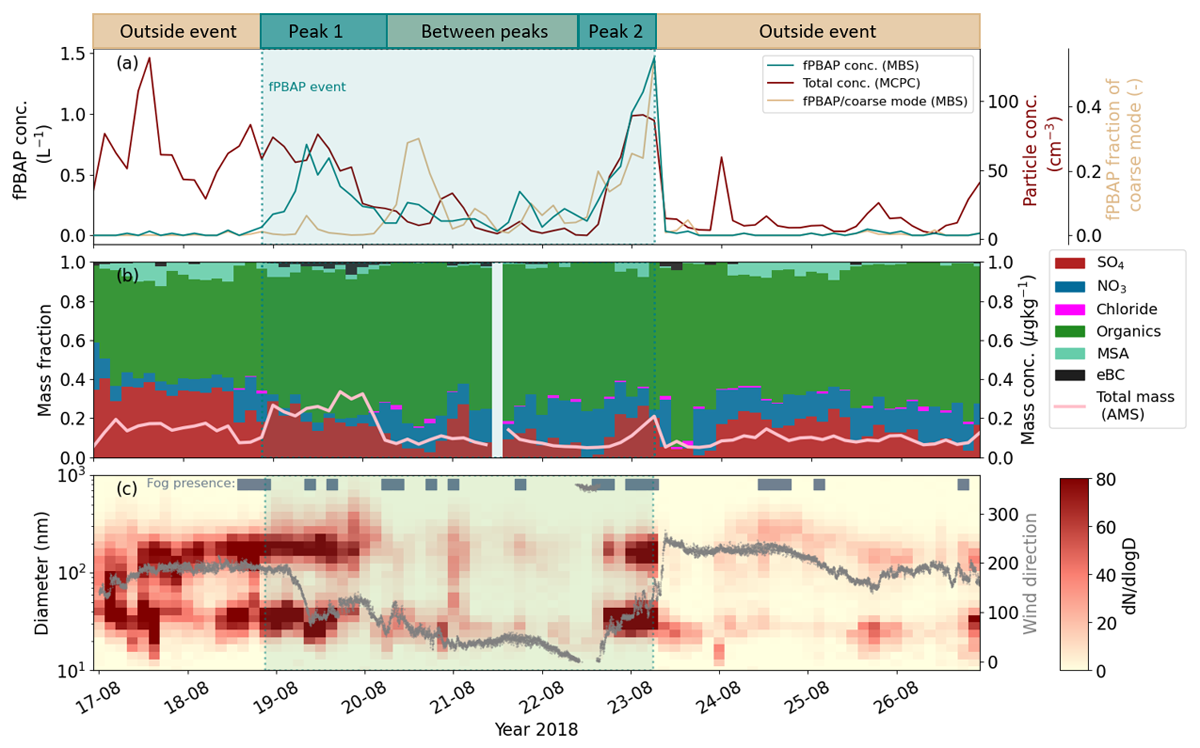
Figure 4
Observed aerosol properties during the fluorescent primary biological aerosol particle (fPBAP) event August 19–23, 2018. (a) The 3-hour average concentrations of fPBAPs (particle diameter >0.8 µm), submicron total particle concentration, and fPBAP to coarse particle ratio; (b) The aerosol composition of submicron particles expressed as mass fractions, with the total mass as overlay; (c) The particle number size distribution, overlayed with wind direction and a fog indicator when the visibility was <1000 m for more than 1/3 of the 3-hour time window. The fPBAP event can be separated into two distinct peaks (peak 1 and 2), with a period of lower but still elevated concentrations in between. This is illustrated by the banner at the top of the figure, also indicating the two reference periods outside the event.
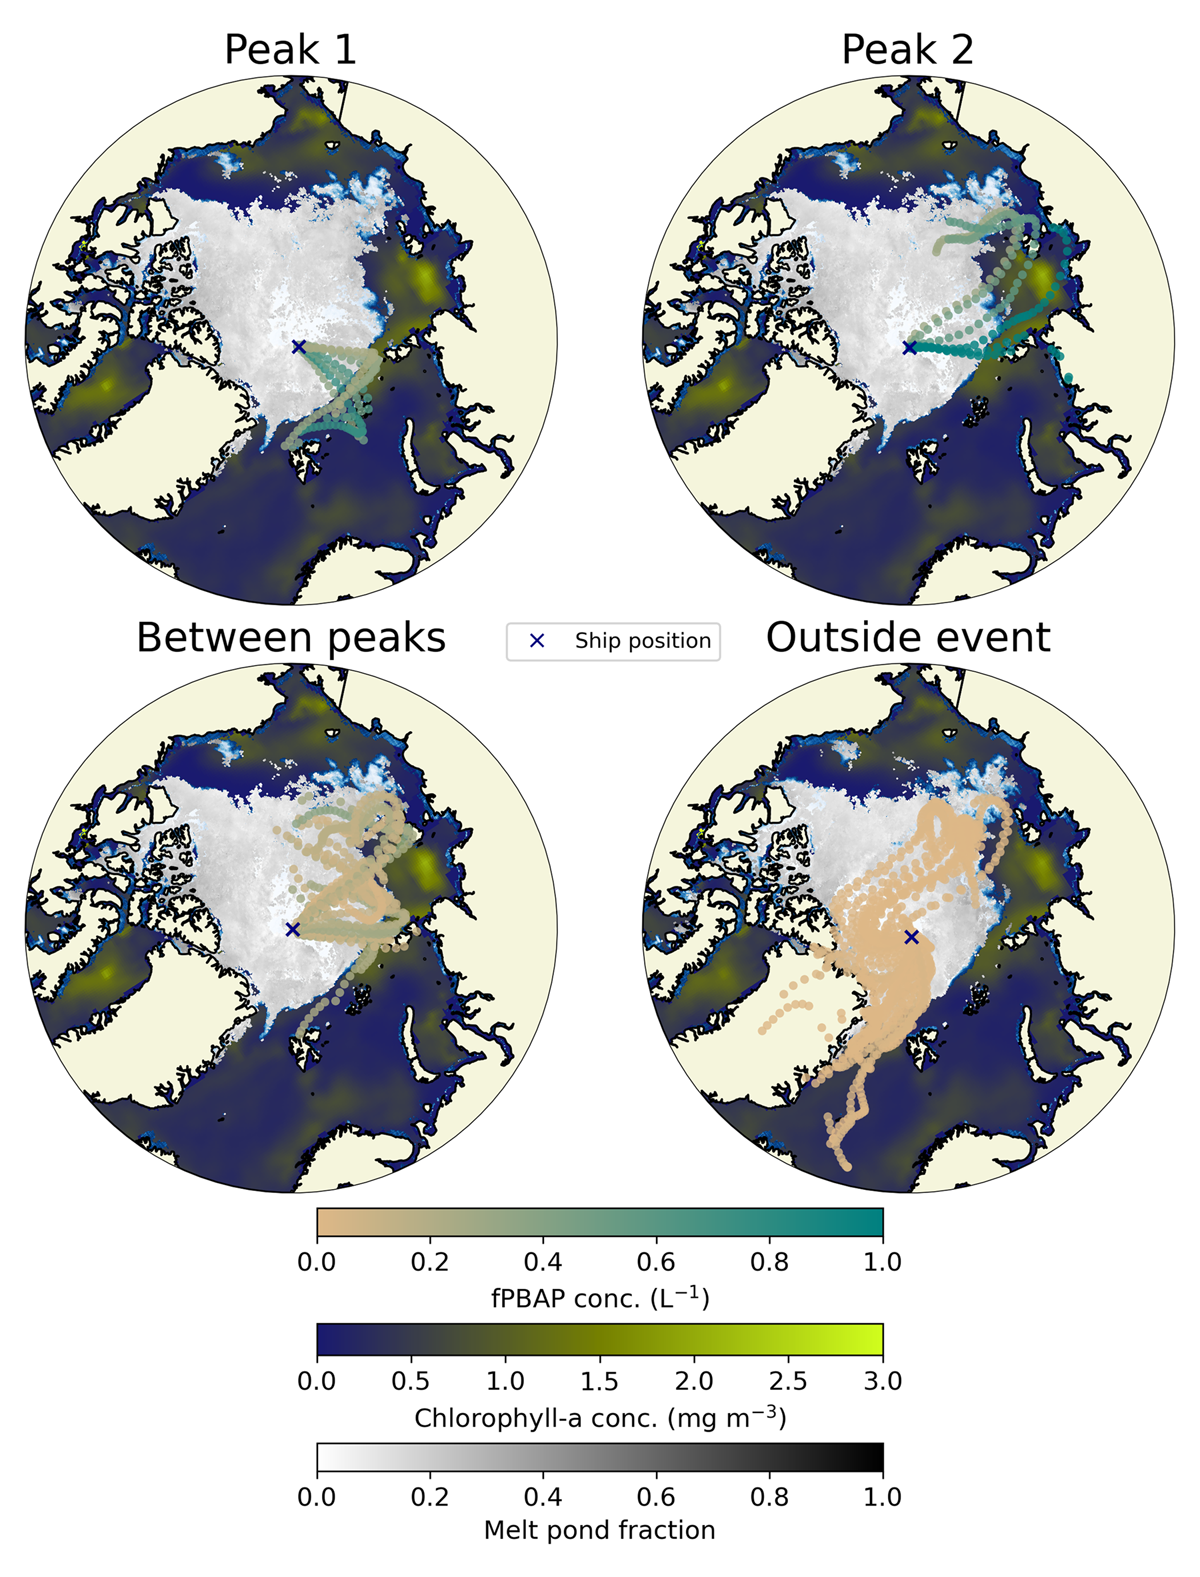
Figure 5
The source regions of air parcels during the fPBAP event during August 19–23, 2018. Panels show maps with the LAGRANTO 5-day backward air parcel trajectories separated into: (a) The first fPBAP peak of the event; (b) peak 2, with the highest concentration of fPBAPs; (c) the period between peaks; (d); the two reference periods before and after combined (outside event). Trajectory points are color-coded by the fPBAP concentration measured at the ship during the arrival of the air parcel (3-hour mean value). Only trajectory points that resided inside the boundary layer are shown. The ocean color indicates the average chlorophyll-a concentration during the period, and the grey shading of the ice represents the melt pond fraction in each grid cell.
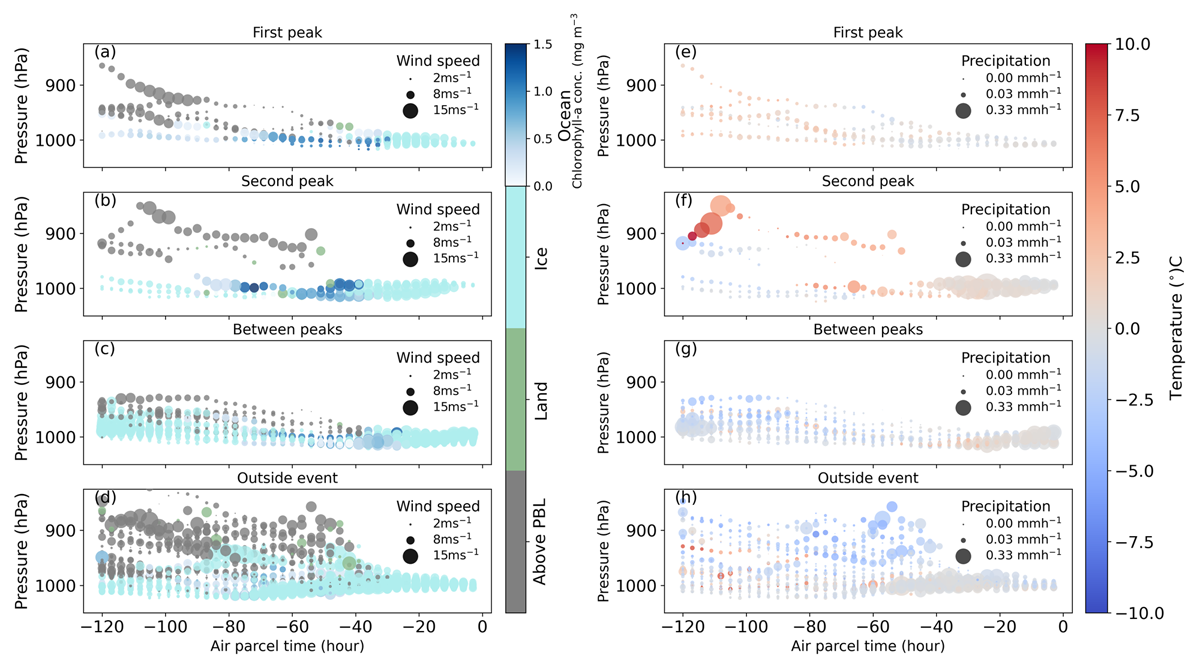
Figure 6
Vertical distribution of the air parcel trajectories during the fPBAP event on August 19–23, 2018. This figure shows vertically resolved LAGRANTO 5-day air parcel back trajectories color-coded by location and surface properties (left panels) and temperature (right panels) for the periods shown in Figure 4. The marker size in the left panels shows the wind speed, while the marker size in the right panels shows the columnar total precipitation.
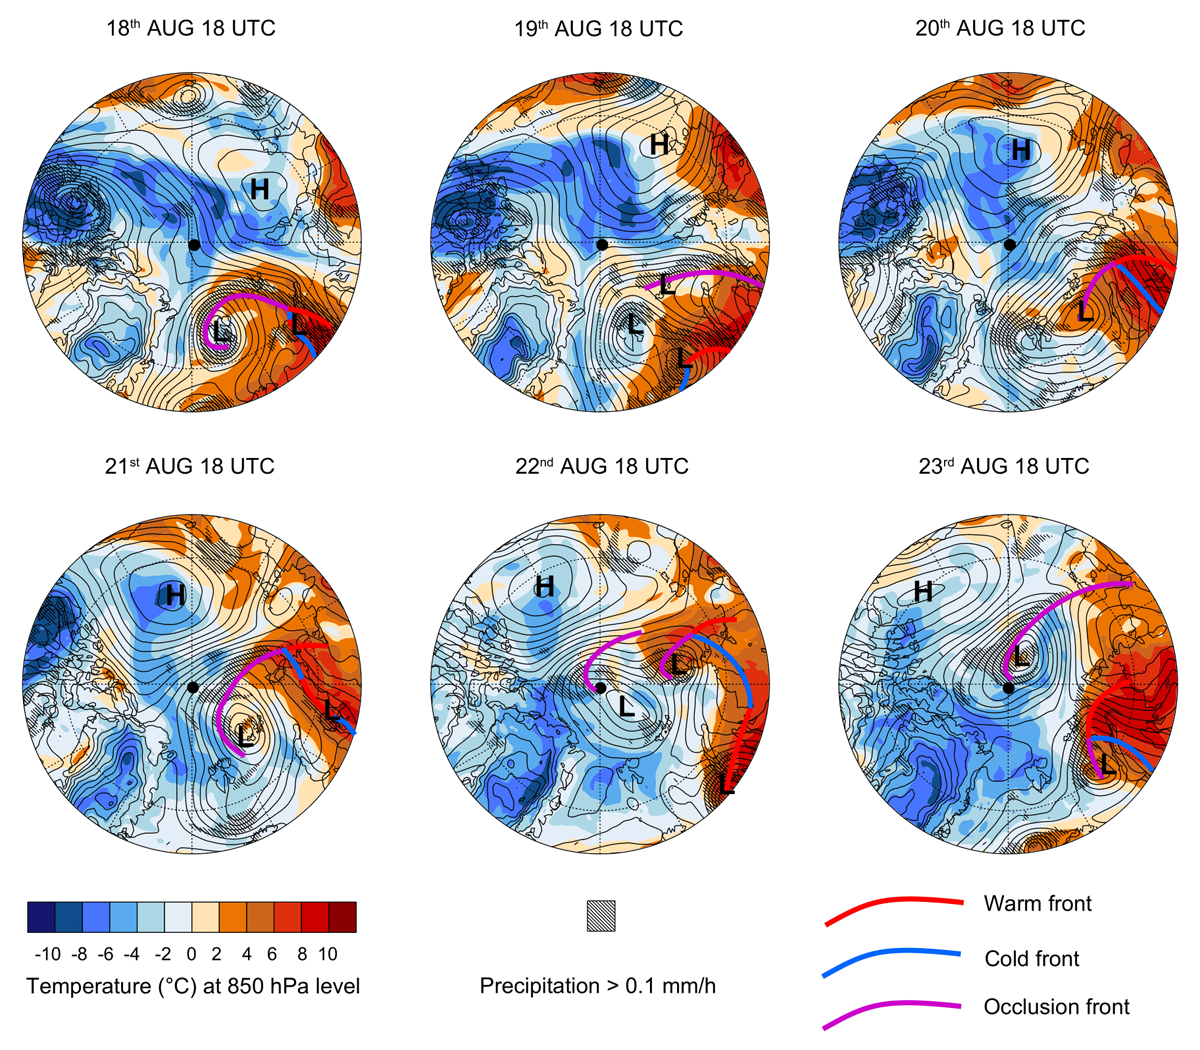
Figure 7
Large scale meteorological conditions during the fPBAP event. Air temperature at 850 hPa level, areas of precipitation, as well as the different fronts, according to ERA5 reanalysis. The fPBAP event lasted from 18:00 UTC on August 18, to 06:00 UTC on August 23, 2018, with peaks midday on the 19 (peak 1), and early morning the 23 (peak 2).