
1 Introduction
Aerosol particles of biological origin play a potentially significant role in climate and weather systems by efficiently acting as ice nucleating particles (INPs; Tobo et al., 2013; Wilson et al., 2015). They are, therefore, highly relevant in the Arctic environment, where clouds are key in regulating the transport of energy to and from the sea ice, and where ice and mixed-phase clouds, consisting of both liquid droplets and ice crystals, are more common than liquid ones (Shupe, 2011).
The high Arctic (>75°N) is experiencing warming at a pace nearly four times the global rate (Rantanen et al., 2022), an enhancement known as the Arctic Amplification (AA). Previous studies suggest that the main drivers of the AA are surface albedo and temperature feedbacks, followed by other processes with a more debated contribution, including upper ocean biogeochemistry, and cloud feedbacks (e.g. Pithan and Mauritsen, 2014; Tan and Storelvmo, 2019; Taylor et al., 2022; Wendisch et al., 2023). Cloud feedbacks are particularly challenging to investigate due to the abundance and persistence of mixed-phase clouds in the Arctic. They are inherently complex, as they are created and sustained through a delicate combination of local thermodynamics, large-scale synoptics, and the availability of INP and cloud condensation nuclei (Morrison et al., 2012). Furthermore, in the central Arctic, with perennial sea ice cover, a harsh environment and limited access have resulted in few near-surface observations. As a result, current understanding and model representation of complex, inter-coupled local climate processes, including aerosol-cloud interactions, is yet insufficient (Schmale et al., 2021). However, in order to foresee the further effects of current and future warming of the Arctic, locally as well as on regional and global scales, our understanding of the atmospheric composition in the high Arctic environment must be improved. This includes aerosols, their sources, and their role in cloud formation and properties (Schmale et al., 2021).
In clouds, homogeneous ice nucleation takes place at low temperatures (it can become increasingly relevant below –30°C; Herbert et al., 2015; Kanji et al., 2017). INPs aid in ice formation at higher temperatures through various physico-chemical processes, e.g., by providing a suitable surface for water molecules to reside (Murray et al., 2012). INPs are often scarce and globally present at a concentration of 1 in every aerosol particles (for INPs active at around –20°C; DeMott et al., 2010, 2017). Nonetheless, they have been shown to play an active role in cloud ice formation (Murray and Liu, 2022). In the Arctic, INPs could come from local marine and terrestrial sources (Barr et al., 2023; Creamean et al., 2018; Porter et al., 2022; Sanchez-Marroquin et al., 2020; Šantl Temkiv et al., 2019; Tobo et al., 2019), or be transported from lower latitudes (Shi et al., 2022). INPs are typically more abundant in the summer months in the Arctic (Creamean et al., 2022; Pereira Freitas et al., 2023; Sze et al., 2023; Wex et al., 2019), associated with emissions from the tundra and snow-free land (Pereira Freitas et al., 2023; Tobo et al., 2019) and a biologically active ocean surface (Beck et al., 2024; Creamean et al., 2019). INPs consisting of local dust, however, have been shown to peak in spring and autumn (Bullard and Mockford, 2018). INPs have also been suggested to be emitted from melt ponds and leads in sea ice (Beck et al., 2024; Creamean et al., 2022). Regional mineral dust and primary biological emissions are believed to be the key contributors to INPs in the Arctic (Beck et al., 2024; Kawai et al., 2023; Pereira Freitas et al., 2023; Porter et al., 2022; Sze et al., 2023; Tobo et al., 2019). However, transport from lower latitudes, for example, mineral dust (Shi et al., 2022) and biomass burning (Pereira Freitas et al., 2023), could potentially increase regional INP numbers. In winter, storm-driven blowing snow and sea spray have been proposed the main sources of INPs (Hartmann et al., 2020). Satellite studies (Carlsen and David, 2022), corroborated by in-situ remote sensing (Nomokonova et al., 2019), assessed that mixed-phase clouds are present throughout the year in the Arctic, probably due to the presence of INPs. Many questions remain regarding the role of INPs in the Arctic, particularly with respect to their sources, which are crucial to understand in order to develop model parameterizations of Arctic INPs and address their impact in the changing Arctic climate (Schmale et al., 2021).
Primary biological aerosol particles (PBAPs), or bioaerosols, are a broad group of aerosol particles emitted from biological sources. These can be, but are not limited to, bacteria, fungal spores, pollen, and vegetation fragments (Després et al., 2012). Ubiquitous, they can be emitted basically everywhere on Earth from a wide range of sources including oceans, vegetation, and deserts (Fröhlich-Nowoisky et al., 2016). In the Arctic, emissions of PBAPs have been linked to biological activity in the ocean (Leck and Bigg, 2005; Šantl Temkiv et al., 2019) and ice (Beck et al., 2024), local terrestrial flora activity (Pereira Freitas et al., 2023; Perring et al., 2023), snow and glacier melt (Pusz and Urbaniak, 2021), blowing snow (Jensen et al., 2022), and transport from lower land masses (Yu et al., 2013). For example, observations show that populations of airborne bacteria can be a mix of native and foreign species (Pusz and Urbaniak, 2021), but often dominated by the former (Cuthbertson et al., 2017). This has been the case for population assessments over land (Johansen and Hafsten, 1988; Šantl Temkiv et al., 2019), ocean (Feltracco et al., 2021), and sea ice (Tesson et al., 2016). PBAPs can be efficient INPs, often nucleating ice at temperatures well above –15°C (Huffman et al., 2013; Tobo et al., 2013; Yu et al., 2013). Several factors contribute to their ice nucleation efficiency, including their larger size, membrane composition, and morphology (Gurian-Sherman and Lindow, 1993), along with the expression of ice nucleating proteins (Pummer et al., 2015). PBAPs can be found within cloud droplets and ice crystals (Bauer et al., 2003), an environment suitable for their biological needs (Khaled et al., 2021; Sattler et al., 2001). PBAPs have also been observed to be effectively removed by wet deposition in the Arctic (Jensen et al., 2022), and to contribute greatly to INP numbers (Beck et al., 2024; Creamean et al., 2019, 2022; Pereira Freitas et al., 2023; Šantl Temkiv et al., 2019; Sze et al., 2023). As PBAPs seem to be important for the INP population in the summertime Arctic, understanding their emission and sources will likely help shed light on the variability of INPs.
In this study, we have used a multiparameter bioaerosol spectrometer (MBS) to measure PBAPs on a single-particle basis. It is based on the principle of measurement of light-induced fluorescence (LIF), which is applied in most online instruments to detect PBAPs, using the autofluorescence of biological particles (Huffman et al., 2010; Kaye et al., 2005). The MBS is a unique development within this field, with eight channels for detecting fluorescence specifically designed to differentiate between biological material and other highly fluorescent particles (Freitas et al., 2022; Ruske et al., 2017). Many biological molecules can fluoresce, and most biological particles contain a mixture of fluorescent chemical compounds (Pöhlker et al., 2012). However, the magnitude of fluorescence varies between species and some PBAPs may not emit enough to be detectable with this method (Healy et al., 2014; Pöhlker et al., 2012). Therefore, we limit the scope of our study to fluorescent PBAPs (fPBAPs), which can be considered the lower limit for PBAPs, although previous studies have shown that fPBAP estimates are often comparable to PBAPs (Huffman et al., 2010; Pereira Freitas et al., 2023).
Beck et al. (2024) presented a year-long observational dataset of fluorescent aerosol particles over the central Arctic Ocean, obtained using a wideband integrated bioaerosol sensor—a predecessor of the MBS with different excitation wavelengths—and a coarser spectral resolution to detect the emitted fluorescence and scattered light. They found that the months with the highest warm INP concentrations occurred when most highly fluorescent particles with PBAP-like characteristics were detected. Air parcel source analysis showed that within the Arctic, these time periods were dominated by contributions from sea ice and open ocean. Due to the inherent influence of ship pollution, the study by Beck et al. (2024) could only report on selected pollution-free days, often with only a few days of reliable measurements especially in summer and early fall.
Here, we present fPBAP observations recorded close to the geographical North Pole during the transition between summer and autumn, including the sea-ice freeze-up period, with a unique high data coverage during the ice camp of almost five weeks, with only 12% data loss due to ship pollution.
We investigate the presence of fPBAPs over the pack ice at the North Pole and aim to elucidate fPBAP emission sources relevant for the central high Arctic, where measurements of fPBAPs are scarce. The main research questions we set out to answer are:
To what extent are fPBAPs present in the central Arctic in late summer to autumn? Is the abundance high enough to contribute to the INP population?
During what conditions are high concentrations of fPBAPs observed? What are the characteristics of the aerosol population?
Can we identify the sources of fPBAPs? Are they mainly of marine or terrestrial origin? Are they emitted locally, regionally, or transported from outside of the Arctic?
We present our complete data set of new observations of fPBAPs at the geographic North Pole and place them in context (Section 3.1). In Section 3.2, we focus on an event with high concentrations of fPBAPs sustained over several days and investigate the possible sources and processes behind it using a combination of atmospheric observations, air source analysis, and reanalysis and satellite products.
2 Methods
2.1 Arctic Ocean 2018 expedition
Observations were collected on board the Swedish icebreaker I/B Oden as part of the US-Swedish research expedition Arctic Ocean 2018 (AO18) and the international collaboration Microbiology Ocean Cloud Coupling in the High Arctic (MOCCHA). The expedition started on August 1st, 2018, in Longyearbyen, Svalbard, and ended at the same place on September 22, 2018. One goal of the expedition was to study the sources and properties of aerosols and clouds in the central Arctic during the transition from summer to winter, capturing the autumn freeze-up of the sea ice. I/B Oden thus traversed the geographic North Pole, which was reached on August 12, 2018. Here, an ice camp was established, where I/B Oden was moored for 5 weeks.
All continuous aerosol in-situ measurements were performed on the 4th deck of I/B Oden, primarily using a whole-air inlet at a height of approximately 20 m a.s.l. The inlet allows sampling of aerosols and cloud particles until around 40 μm and follows the sampling guidelines for extreme environments (Wiedensohler et al., 2014; WMO/GAW, 2016). The inlet was heated to approximately 40°C and had a total sampling flow of approximately 90 L min–1 to ensure aerosol sampling at dry conditions. More technical details and overview of the performed aerosol and cloud in-situ measurements can be found in Baccarini et al. (2020); Duplessis et al. (2024); and Karlsson et al. (2022).
2.2 Bioaerosol measurements
Particles of biological origin were measured on a single-particle basis with an MBS that utilizes ultra-violet light induced fluorescence and light scattering. Incoming particles are aligned in single-file in a sample flow of 0.3 L min–1, surrounded by a sheath flow of around 1.7 L min–1. A low power laser beam with a wavelength of 635 nm shines through the aerosol sample column. When a particle passes through, the scattered light is collected by an assembly of lenses and used to define the detection of a particle, as well as the particle size. The detection of a particle triggers a high-power laser pulse at 637 nm to illuminate the particle, and the scattering pattern obtained gives information on the particle’s morphology. Finally, 10 µs after particle detection, a xenon flash lamp with a wavelength of 280 nm shines on the particle for about one µs. Using two mirrors, the resulting fluorescence is focused through a diffraction grating to a photodetector. The detector has eight, equally spaced, channels between 310–650 nm, thus a spectrum is recorded for each fluorescent particle. The instrument and measurement process are described in more detail in Ruske et al. (2017).
The shape and intensity of the fluorescence spectrum of each particle can be used to differentiate between fPBAP and other fluorescent particles. The classification used in this work follows Freitas et al. (2022) for marine aerosol. All detected particles are counted and will be referred to as coarse particles (CP). Those with a fluorescence, in any channel, higher than three standard deviations from the mean of the background (periodically measured without sample flow) in that channel are labeled fluorescent particles (FP). Those with fluorescence greater than nine standard deviations above the mean background are considered highly fluorescent particles (HFP), and those among them with the highest signal recorded in the 364 nm channel are classed as fPBAPs. This channel corresponds to the peak fluorescence of the amino acid tryptophan, typically found in microorganisms. We refer to the HFP that are not fPBAPs as other HFP (OHFP). See Figure S1 in the SI for an overview of the particle classes and their overall contribution throughout the expedition. The particle fluorescence declines with size; therefore, all particles with an optical diameter below 0.8 µm are discarded, as the distinction between CP and FP below this limit cannot be made reliably. The fPBAPs can be further classified into subtypes, based on which additional fluorescence channels surpass the 9-standard-deviation threshold. We have applied the same definition as Pereira Freitas et al. (2023): type I corresponds to the fPBAPs that only fluoresce beyond the threshold in the 364 nm channel, which is the second channel; type II also in the third channel; type III in the first three channels; type IV in the first four channels; and finally, type V are any other combinations of channels, as long as the highest signal is in the second channel (the criteria for fPBAP classification).
Some particles have a fluorescence that is strong enough to saturate the detector, and if this happens in multiple channels, it is impossible to determine which channel recorded the highest signal. OHFP that only saturate the detector in the 364 nm channel could theoretically still be correctly classified as fPBAPs, but in this data set only 14 such particles were detected, hence negligible. All saturating particles are therefore classified as OHFP, which means that some potential fPBAPs are not considered. However, since this data set is influenced by the pollution from the ship exhaust, which most likely produces very potent HFP such as polyaromatic hydrocarbons (Garra et al., 2015; Savage et al., 2017; Yu et al., 2016), we assume that most of the saturating particles are linked to pollution, and the risk of rejecting real fPBAP can be considered low. Additional uncertainties in the fPBAP measurements stem from undercounting, as any nonfluorescent fPBAP is excluded, and overcounting, as the method applied still allows some non-PBAPs, but with a similar fluorescent spectrum, to be classified as such.
2.3 Auxiliary measurements
INPs were sampled behind the whole-air inlet using polycarbonate filters and subsequently analyzed on board the ship using a droplet-freezing array setup. As the ambient INP concentration was highly variable throughout the course of the expedition, the sampling time was adjusted to acquire sufficient INPs for analysis on each filter. Therefore, the sampling time differed between filters (see Figure 2 and Porter et al. (2022)), and calculated INP concentrations have been normalized to the sampled volume. A full description of the method and data can be found in Porter et al. (2022).
The particle number concentration and particle size distributions were measured using a mixing condensation particle counter (MCPC; Brechtel Manufacturing Inc., USA, Model 1702) and a custom-built differential mobility particle sizer (DMPS), respectively. The DMPS consists of a Vienna-type differential mobility analyzer (DMA) and a second MCPC for counting the size-selected particles in the diameter range of 10–921 nm. More details about the aerosol sizing instrumentation can be found in Karlsson et al. (2022).
The meteorological data, as well as the ship’s position, were taken from Prytherch and Tjernström (2019). An overview of the general meteorological conditions can be found in Vüllers et al. (2021). The visibility was taken from a sensor that was part of a counterflow virtual impactor inlet (Karlsson et al., 2022).
The bulk chemical composition of submicron aerosols was measured, at one minute time resolution, with a high-resolution time-of-flight aerosol mass spectrometer (HR-ToF-AMS, Aerodyne Research Inc., USA). Technical descriptions of the instrument’s functioning can be found in DeCarlo et al. (2006) and Canagaratna et al. (2007), and readers are referred to Karlsson et al. (2022) for details regarding the AMS field deployment and data processing during MOCCHA. The AMS uses a PM1 aerodynamic lens and measures the mass concentrations of non-refractory dried aerosols, which correspond to the species that are flash-vaporized at temperatures below that of the instrument’s heated tungsten surface (600°C). Such species include sulfate, nitrate, ammonium, chloride, and organics but exclude crustal materials, black carbon, or sea salt (Jimenez et al., 2003).
The mass concentrations of methanesulfonic acid (MSA), an oxidation product of marine-sourced dimethylsulfide (DMS), were calculated from the AMS signal of the fragment at the mass-to-charge ratio (mz) of 79, following the approach from Hodshire et al. (2019). Based on a post-campaign calibration of the instrument with MSA, we found a calibration factor of 12.14, by which mass concentrations should be multiplied to retrieve MSA mass concentrations. This calibration factor falls within the same range (6.1–19.7) as previously reported values (Hodshire et al., 2019).
The AMS was installed behind a switching valve that alternated between the whole-air inlet and an interstitial inlet, used to sample unactivated particles below one micrometer, every hour. In this work we have only included the AMS data sampled behind the interstitial inlet, corresponding to odd hours, as the MSA signal was consistently lower behind the whole-air inlet, most likely due to higher losses.
2.4 Exclusion of data influenced by pollution
To ensure undisturbed clean air sampling, I/B Oden was pointed into the main wind direction. However, the periods of clean air sampling were interrupted by the influence of the ship’s own emissions (e.g., from the ship stack or kitchen exhaust), typically when the wind speeds were low, when the wind was outside the clean sector (±80° relative wind direction), during helicopter operations, or during ice breaking.
For measurememts of particle number concentration (including coarse particles measured by the MBS) and size distribution, potential pollution periods were excluded using a pollution mask developed and described by Karlsson et al. (2022). The mask follows a similar principle as outlined by Beck et al. (2022) and is primarily based on the total particle count. It excludes any 30 second periods when total particle concentration range exceeded 50 cm–3 and the six hour running mean, as well as periods when the total particle concentration reached above 104 cm–3. Periods marked in the logbook as potentially polluted are also excluded.
Pollution masks based on particle count are not necessarily suitable for measurements of chemical composition (Beck et al., 2022). For the AMS measurements, we have applied the pollution mask developed for this dataset where data is excluded when the chemical spectrum was similar to that of a known spectrum of fresh pollution, composed mainly of hydrocarbons fragments (Dada et al., 2022).
The fPBAP dataset has not been filtered for pollution other than the exclusion of saturating particles (which have an inconclusive spectrum shape and cannot be classified as fPBAPs), as ship stack emissions do not contain fPBAPs. The choice of not excluding fPBAP during potentially polluted periods is further motivated in section 3.1.
2.5 Model and reanalysis data
2.5.1 Air parcel back trajectories
Trajectories indicating the origin of the probed air were obtained from Wernli (2022). These trajectories were calculated using the LAGRANTO Lagrangian analysis tool (Sprenger and Wernli, 2015) together with ECMWF operational analysis fields as meteorological input. For this study, the lowest release level and only five days backward in time were used, as the measurements were conducted close to the surface and because primarily coarse particles with a short atmospheric residence time are investigated. A more detailed description of the trajectories, including comparisons between different release levels, a sensitivity analysis assuming different boundary layer heights, and length back in time is available in Karlsson et al. (2022). We also analyzed the 10-day trajectories for the time periods relevant to this work (illustrated in Figure S4), and deemed the 5-day versions to be representative as the 10-day trajectories did not extend over new source regions in most cases, and since we are investigating sources of large particles with shorter atmospheric residence times. The same 5-day versions were used by Porter et al. (2022), who presented the INP measurements from AO18.
Air parcel origins were also identified with the FLEXPART-WRF model (Brioude et al., 2013), driven by a polar-optimized version of the WRF4.3.3 model (Lapere et al., 2024) nudged to NCEP’s final (FNL) analysis (National Centers For Environmental Prediction/National Weather Service/NOAA/U.S. Department Of Commerce, 2000). Ten thousand particles of an air tracer subject to wet and dry deposition were released every hour along the ship track, and traced backwards for seven days. The precise origin of air parcels during a specific event were estimated following Hirdman et al. (2010), by dividing the back trajectory residence time in the boundary layer during this event by the total back trajectory climatology during the campaign, excluding areas with very low residence times (<1% of the total residence time).
The sea ice concentration and melt pond fraction data used are satellite products of the University of Bremen (Spreen et al., 2008; Istomina et al., 2023), with daily resolution. Along the air parcel back trajectories, points over 85% sea ice concentration were tagged as over ice.
2.5.2 Arctic Ocean biogeochemistry
As an indicator of biological activity in adjacent open water areas, we utilized chlorophyll-a concentration (proxy of phytoplankton biomass) data obtained from the TOPAZ-ECOSMO Arctic Ocean Biogeochemistry Reanalysis product, provided by the European Union-Copernicus Marine Service (2021). This reanalysis product is based on the Hybrid Coordinate Ocean Model (HYCOM) coupled with a sea ice model and a biogeochemistry model (ECOSMO). The biogeochemistry model assimilates observational data, incorporating satellite retrievals of chlorophyll-a and in situ profiles of nutrients at an eight-day interval. The atmospheric forcing input for the model is obtained from ECMWF ERA5 reanalysis data (see below). Notably, this version of TOPAZ-ECOSMO does not assimilate sea ice concentration or account for light penetration through sea ice. For detailed insights into data assimilation methods and model description, readers may refer to Simon et al. (2015) and Sakov et al. (2012). A more detailed assessment of the TOPAZ-ECOSMO product’s spatial accuracy, evaluating its ability to identify high-productivity regions for our application through comparison with satellite-derived chlorophyll-a retrievals, is provided in the Supplementary Information.
2.5.3 Meteorology
In this study, ERA5 was used for analyzing meteorological conditions that affect aerosol transport and cloud processes. ERA5 is the fifth-generation atmospheric reanalysis data of European Centre for Medium-Range Weather Forecasts (ECMWF) (Hersbach et al., 2018a, b, 2020). Reanalyses combine satellite data and in-situ observations with knowledge of the atmospheric physics and dynamics obtained through weather prediction models. ERA5 uses a 4D-variational assimilation system from the Integrated Forecasting System (IFS cycle 41r2) atmospheric model of the ECMWF. The use of many different kinds of satellite observations is important for the polar regions, since in-situ observation networks in polar regions are sparse. The ERA5 product has a horizontal resolution of approximately 31 km and 137 vertical levels. Many studies have shown that ERA5 is among the best reanalysis to represent atmospheric conditions in the polar regions (Gossart et al., 2019; Graham et al., 2019). However, a warm bias in near-surface temperatures over Arctic sea ice in ERA5 has been documented (Batrak and Müller, 2019; Wang et al., 2019), although it is most prominent during the winter season.
3 Results and Discussion
3.1 Observation of fluorescent primary biological aerosol particles during Arctic Ocean 2018
An overview of the MBS measurements during the entire expedition is shown in Figure 1a, with shaded areas representing pollution influence. fPBAP were observed throughout the entire expedition, but most consistently before the local freeze-up of the sea ice, which started August 28 (Vüllers et al., 2021). The highest concentrations of fPBAPs observed during clean conditions were up to three particles per liter.
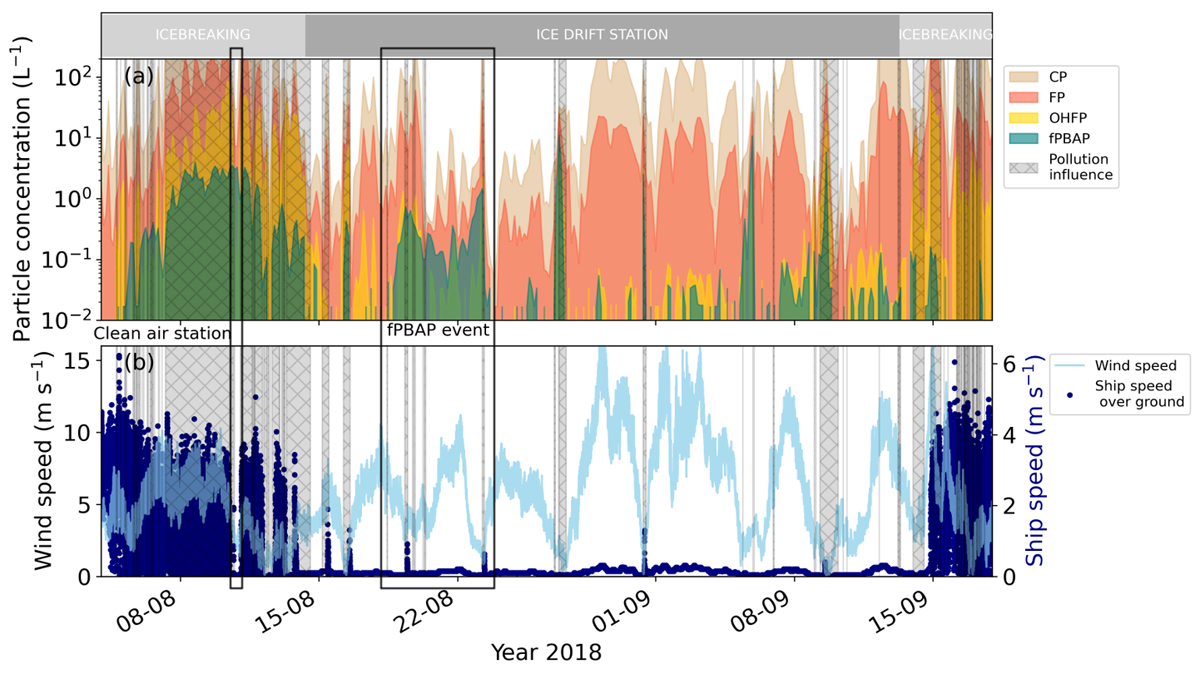
Figure 1
Observations of biological and coarse mode particles measured during Arctic Ocean 2018. (a) Concentration of coarse particles (>0.8 µm), fluorescent particles (FP), fluorescent primary biological aerosol particles (fPBAPs), and other highly-fluorescent particles (OHFP), measured by the multiparameter bioaerosol spectrometer (MBS); (b) Wind speed measured on the 7th deck of the ship (25 m a.s.l), as well as ship speed over ground. Grey hashing and shading in both panels represent periods influenced by pollution from the ship exhaust.
During the first half of the expedition (until the freeze-up), we found a strong correlation between fPBAP and INP concentrations (Figure 2), the latter first reported in Porter et al. (2022). Notably, the highest INP concentrations measured during the whole campaign were reached within this time frame. For this period, the Spearman rank-order correlation coefficient (ρS) between INP at –20°C and fPBAP concentration was 0.88, in line with the conclusion by Porter et al. (2022) that the majority of the sampled highly active INP were of biological origin as their nucleating activity was largely removed after heat treatment. However, considering the entire expedition, ρS was 0.55. This is primarily because the INP concentrations stayed consistently low during the second half of the expedition (Figure 2, post local ice freeze-up), while occasional high and short-lived peaks of fPBAPs were observed (Figure 1a) that completely or partially overlapped with pollution events. We have examined each peak, and concluded they are most likely not caused by emissions from the ship stack, as total particle number concentrations were low during these events. This is also indicated in Figure 1, as the highest peaks did not coincide with turning of the ship, and the other particle classes detected by the MBS did not show exceptionally high concentrations during these peaks compared to during the ice-breaking. Furthermore, we have no reason to believe that fPBAPs are associated with ship stack emissions, as the fPBAP concentration did not drop on August 10–11 during the stop in ice-breaking (indicated as a clean air station in Figure 1), while coarse particle, FP, and OHFP concentrations did, and, most importantly, virtually no fPBAPs were detected during the second ice-breaking period in the end of the expedition (Figure 1). However, they were all associated with very low wind speeds, 0–2 m s–1, and occasionally small spikes of tens of particles in the total submicron particle concentration. Furthermore, analysis of the air parcel back trajectories during these peaks was inconclusive, as the air origin during the peaks did not differ from time periods with insignificant concentrations of fPBAPs (Figure S2). Therefore, we cannot rule out that these high fPBAP peaks during the second half of the expedition were caused by influence from activities on and around the ship. These particles may still have been of biological origin in that case, but not from the natural sources we are interested in, and clearly did not act as INPs. In future studies, DNA analysis of sampled fPBAP could be applied to determine the nature of the particles. Notably, one of these peaks, on September 5, was associated with snowfall, while the peak on August 31 occurred in fog.
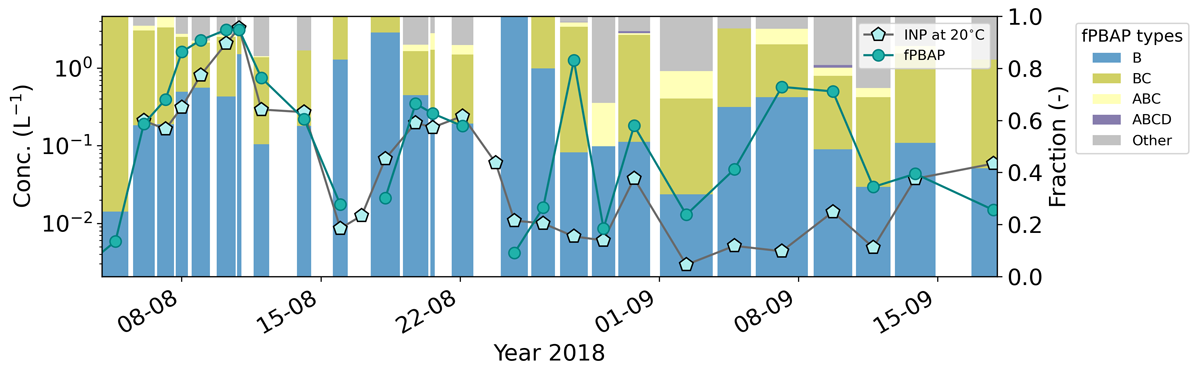
Figure 2
Comparison of biological ice nucleating particles measured during Arctic Ocean 2018. Overlays show the concentration of fluorescent primary biological aerosol particles compared to the ice nucleating particle (fPBAP) concentration at –20°C from Porter et al. (2022). Bars show the distribution of fPBAP types, the widths indicating the INP sampling times. All fPBAP data has been averaged to the INP sampling periods.
Figure 2 also shows the fPBAP types as defined by Pereira Freitas et al. (2023), to use the additional information on the fluorescence spectra surrounding the 364 nm-channel of the MBS. The fPBAP of type I and II are the most dominant types throughout the expedition. Measurements in Pereira Freitas et al. (2023) were performed on Svalbard over the course of one year, where type I was associated with fPBAPs mixed with more transported and marine-influenced aerosol (that is, with an additional correlation to typical sea spray tracers such as sodium or calcium but also biomass burning tracers like levoglucosan or eBC and no correlation to dust tracers like iron). However, fPBAP type II did not show any correlation with sea spray tracers but high correlations to biological tracers such as mannitol, arabitol, fructose, and 2-methylerythritol. This suggests that, in our case, the fPBAPs were mainly transported from outside the pack ice with a clear marine influence (type I) but an additional contribution of fPBAPs with only a clear biological origin of a different but unknown source (type II).
Two time periods stood out in terms of consistently high fPBAP concentrations over a longer period, the first ice-breaking, and an event between the August 19–23, the latter marked with a black rectangle in Figure 1. The auxiliary aerosol data during the ice-breaking is unusable, since the signal is dominated by ship emissions outside of the clean air station. The lack of other aerosol data makes it difficult to investigate the nature and origin of fPBAPs during these periods. Therefore, the measurements during the ice drift station, August 15 to September 14, are most useful. They are arguably also the most interesting, as this is the time when the ship was stationary in the region of interest, the most pristine, central part of the Arctic. We have chosen to focus on the period between August 19–23, when there are high sustained fPBAP concentrations with very few instances of ship exhaust influence, for further investigation of the origin of fPBAPs that were observed at the North Pole. This part of the time series will hereafter be referred to as the fPBAP event (or, when sufficient, just the event).
During the first period of ice-breaking and for a period between the end of August to mid-September, elevated OHFP and fPBAP concentrations tended to coincide. However, from the 15th to the end of August, as well as during the last ice-breaking phase, OHFP behaved differently than fPBAPs, indicating that they were produced by separate processes. Freitas et al. (2022) showed that OHFP emitted from Baltic seawater was most likely sea salt particles coated with fluorescent organics. This could explain why fPBAPs and OHFP sometimes show similar behavior; they could originate from the same source, as marine areas with high dissolved organics may also be more enriched in algae or bacteria that can be emitted as fPBAP. However, some OHFP could also be organic material of terrestrial origin, or ship stack emissions, which would explain the high concentrations during ice-breaking and pollution events.
Out of the coarse particles detected by the MBS throughout the campaign, the FP made up an almost constant fraction of about 8% of the coarse mode (Figure S1). This is in agreement with previous observations with the same instrument in Svalbard by Pereira Freitas et al. (2023). It is also comparable to results by Beck et al. (2024), who observed a FP fraction of around 10% in August and September, in the central Arctic. They also showed that the fraction is lower during the winter season. The concentration of coarse particles (and consequently FP) appeared strongly associated with wind speed, with concentration spikes aligning with ship movements or other pollution events (Figure 1; see Figure S3 for a comparative analysis of wind dependence across the four particle types). In fact, after filtering for pollution, ρS for wind speed with coarse mode and FP was 0.65 and 0.61, respectively. The relationship between coarse mode and wind speed is expected, as the large particles in this pristine environment are dominated by sea spray, or blowing snow at low temperatures (Heslin-Rees et al., 2020; Song et al., 2021). Since they have a strong correlation with the local wind speed, the bulk of the coarse mode aerosol during the expedition were likely locally produced. The OHFPs and fPBAPs, on the other hand, did not have a significant correlation with wind speed (Figure S3), with ρS values of 0.17 and 0.01, respectively. For fPBAPs, the p-value was 0.9, thus indicating that they are completely independent of local wind conditions. They must therefore have been produced primarily by non-wind-driven processes, or transported from further away. It is clear that they did not make up a consistent fraction of the coarse mode, which is the case for FP. This points out the need for identification of the conditions under which fPBAPs were produced, which is separate from the main coarse mode aerosol source, and able to reach the North Pole (if not locally emitted).
3.2 Understanding the enhanced fluorescent primary biological aerosol particle event at the North Pole
In this section, we utilize auxiliary measurements, air parcel analysis, and reanalysis data to investigate the fPBAP event. We consider six plausible sources of fPBAPs during the event, illustrated in Figure 3; (1) local emissions from leads, melt ponds, or ice (Creamean et al., 2022); (2) the marginal ice zone, which can be highly biologically active (Hartmann et al., 2021; Tunved et al., 2013); (3) sea spray from the open ocean, e.g., a plankton bloom (Creamean et al., 2019); (4) sea spray from coastal regions with a high inflow of organic material from rivers (Terhaar et al., 2021); (5) terrestrial sources from within the Arctic, like pollen, fungal spores, or biomass burning, from the tundra on Svalbard, the Greenland coast, or Northern parts of the Eurasian and North American continents (Pereira Freitas et al., 2023; Perring et al., 2023); (6) long range transport from regions south of the Arctic with high emissions of biological particles (Yu et al., 2013). As will be discussed in the following sections, we observed changes in the chemical and physical aerosol properties measured throughout the course of the fPBAP event, indicating that more than one of the proposed sources may have contributed. Most notably, the ratio of fPBAPs to coarse particles increased over the course of the event. To explain this, the source at emission must have been increasingly enriched in fPBAPs, or processes between emission and detection led to a relative increase in fPBAPs. We therefore also consider two hypothetical pathways that could explain this enhancement; (i) fPBAPs and co-emitted coarse particles were lifted above the boundary layer, and the fPBAPs more effectively forming ice crystals and eventually precipitated down to surface level as snow, while other coarse particles stayed aloft to a higher extent; (ii) the other coarse particles were removed from the air parcel during transport more effectively than fPBAPs. These pathways are further discussed and motivated in sections 3.2.2 and 3.2.3. The fPBAP event started at 21:00 UTC on August 18 and lasted until 06:00 UTC on August 23, 2018.
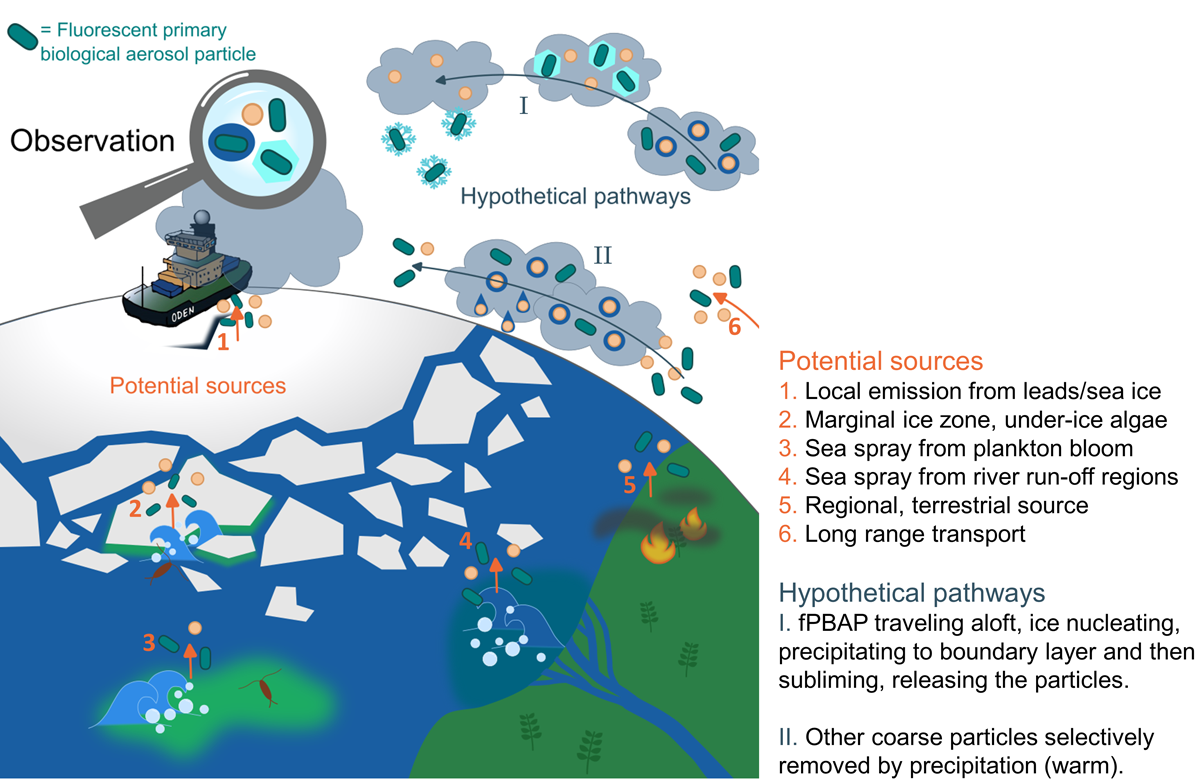
Figure 3
Schematic overview of the potential sources of bioaerosols during the event on August 19–23, 2018. Potential sources and possible transport pathways resulting in the observed increase in fluorescent primary biological aerosol particles (fPBAPs) to coarse particle concentration at the North Pole during the event are illustrated.
3.2.1 In-situ observations
Figure 4 illustrates that the measured concentration of fPBAPs was virtually zero during the two days preceding and the three days following the event. Therefore, these two time periods outside the event are used as a reference. By comparing auxiliary data between these time windows and the fPBAP event, we highlight the circumstances that caused the event.
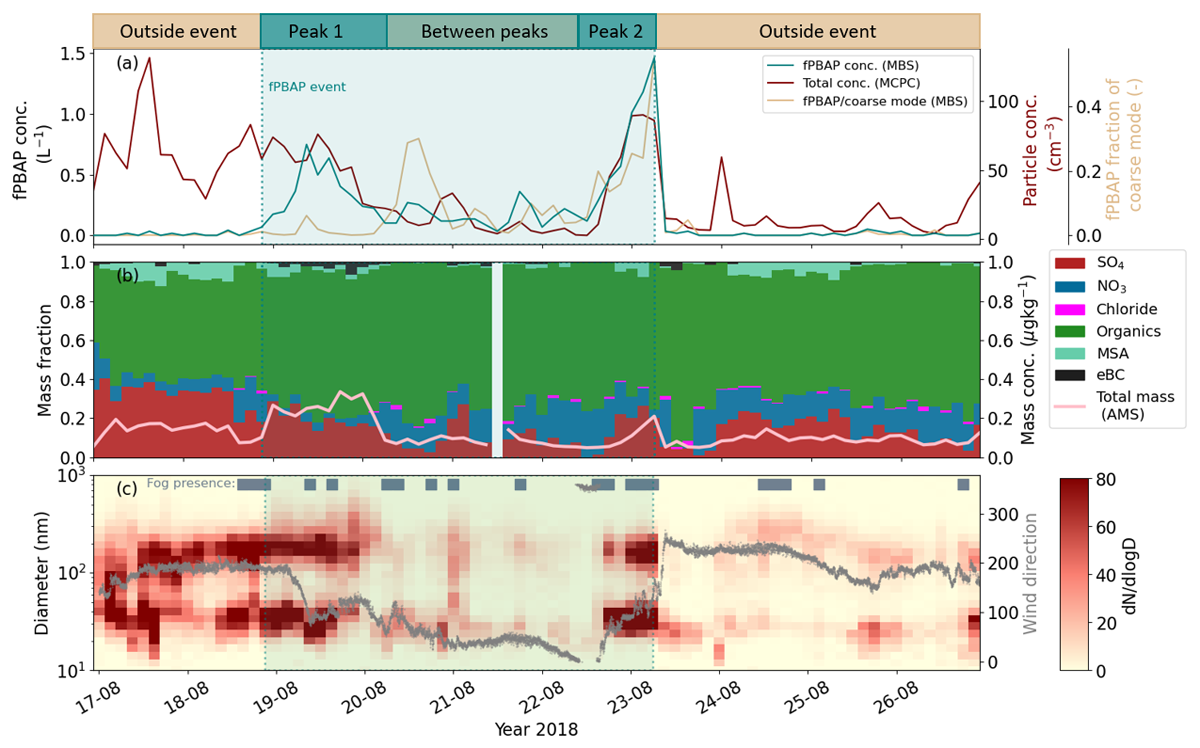
Figure 4
Observed aerosol properties during the fluorescent primary biological aerosol particle (fPBAP) event August 19–23, 2018. (a) The 3-hour average concentrations of fPBAPs (particle diameter >0.8 µm), submicron total particle concentration, and fPBAP to coarse particle ratio; (b) The aerosol composition of submicron particles expressed as mass fractions, with the total mass as overlay; (c) The particle number size distribution, overlayed with wind direction and a fog indicator when the visibility was <1000 m for more than 1/3 of the 3-hour time window. The fPBAP event can be separated into two distinct peaks (peak 1 and 2), with a period of lower but still elevated concentrations in between. This is illustrated by the banner at the top of the figure, also indicating the two reference periods outside the event.
During the event period, the concentrations of fPBAPs and the total particle concentration exhibited largely similar temporal variations (Figure 4a), indicating that both were likely influenced by the same source during this time. This suggests that information about the submicron aerosol population can reasonably represent fPBAPs during the event, despite fPBAPs being larger than 0.8 µm.
The fraction of fPBAP to coarse mode is as low as outside the event during the first fPBAP peak on August 19, 1–30% between the peaks, and reaches 55% during the second peak on August 22 and 23. Thus, there is an increasing enrichment in fPBAP to other coarse mode particles. This indicates that the two main peaks during the fPBAP event might be quite different in terms of the main source, or processing, of the aerosol. To take this into account, the event can be separated into three main parts (as indicated in Figure 4); a first distinct peak (peak 1), a period of lower but still elevated fPBAP concentrations (between peaks), and a second, final, most prominent peak (peak 2).
For the period included in Figure 4, the observed bimodal size distribution is typical for marine aerosol (Heintzenberg et al., 2000). The chemical composition is also compatible with marine aerosol, with high fractions of organics (consistently 50% or above) and sulfate, although high organic fractions can also indicate terrestrial sources (Hodzic et al., 2020). As mentioned in section 2.3, we are only showing the submicron aerosol chemical composition from behind the interstitial inlet, which had lower sulphate fractions in fog than the whole-air aerosol population consistently during AO18 (Karlsson et al., 2022). Therefore, the drop in the sulphate fraction from around 35% to 20% or lower just before the start of the event (Figure 4b), is expected due to the onset of fog (Figure 4c). The fractions of organics, sulphate, and nitrate are similar to the average fractions during the ice drift portion of the expedition, where most of the air parcel influence came from ocean and ice (Karlsson et al., 2022). This is further supported by the continuous presence of methanesulfonic-acid (MSA), which is an oxidation product of dimethylsulfide (DMS) emitted from the ocean. While the MSA fractions decrease after peak 1, it is important to note that mass concentrations during this time are so low that many compounds are close to the detection limit (Karlsson et al., 2022) and thus mass fractions become more unreliable. Despite the fact that the MSA fraction is lower during the event than right before, the presence of MSA is still indicative of a marine signal, and during the event it is slightly higher during the two peaks than between them. Peak 1 stands out in terms of chemical composition, as it is associated with a detectable black carbon fraction, a tracer of biomass burning or anthropogenic emissions. This is an indication that peak 1 of the event could be influenced by long-range transported air carrying aerosol of terrestrial origin. However, peak 1 also coincides with an increase in coarse particles, which is most likely sea spray particles, and the aerosol size distribution (Figure 4c) is consistently bimodal. However, any air parcels with terrestrial origin that reach the North Pole will have had to pass over open ocean or sea ice and could, therefore, also carry a marine signal (Heutte et al., 2024). Therefore, it is crucial to investigate the origin and trajectories of the air parcels during the event.
3.2.2 Source and process analysis
The 5-day air parcel back trajectories show clear differences in source region between the fPBAP event, and the periods before and after (Figure 5). Between the peaks, and during peak 2, the air parcels originated from or spent time over the Laptev and Kara seas, or the Siberian coastline, where surface chlorophyll-a concentrations were highest in the Arctic at the time. This is confirmed by the FLEXPART-WRF air parcel origin attribution during the event (Figure S6), showing a likely contribution from the Laptev and Kara seas during peak 2 and between peaks, but also from the marginal ice zone of the Barents and Greenland seas, and the northern coast of Svalbard, during peak 1. The back trajectories during peak 1 also indicate a source region further west than for the rest of the event (Figure 5). The chlorophyll-a concentration does not appear to be elevated around Svalbard and the northern Barents Sea in Figure 5, but our comparison with satellite products (see Figure S5 and discussion in the Supplementary Information) revealed that the ocean productivity may be underestimated in this region in the reanalysis product used. Outside the event, no clear region of origin emerges and air parcels could have come from almost anywhere else in the Arctic (Figure S6). The trajectories that reach the ship outside the event have mostly spent time over the pack ice or the Greenland Sea (Figure 5), where chlorophyll-a concentrations were around five times lower than in the Laptev Sea. All trajectories passed over the pack ice before reaching the ship, as they must. The ice areas covered during the fPBAP event differ spatially compared to outside the event, implying influence from a different section of the pack ice, but the melt pond fraction is essentially homogeneous in all directions (Figure 5). Therefore, given that the trajectory time spent over ice is clearly greater outside the event, it seems less likely that the observed fPBAPs during the event would originate from melt ponds, re-suspension of deposited particles on the snowpack, leads, or any other possible source associated with the pack ice. Porter et al. (2022) reached the same conclusion regarding the sources of INPs. This is expected, as there is no correlation between fPBAPs and local wind speed, but this also shows that potential non wind-driven emission sources within the pack ice are also less likely. This result stands in contrast to recent findings by Beck et al. (2024), who connect high concentrations of HFP to long air parcel residence times over sea ice, and consider several plausible sources at low wind speeds within the ice. For the case of the event we present, however, it is clear that what differentiates the fPBAP event from periods with low concentrations (outside the event), is actually less contribution from sea ice. To further investigate the sources of the observed fPBAPs, we look into the history of the height of the trajectory points, as there must have been an interaction between the air parcel and the surface for the fPBAPs to become airborne. We also consider potential wet removal along the trajectories.
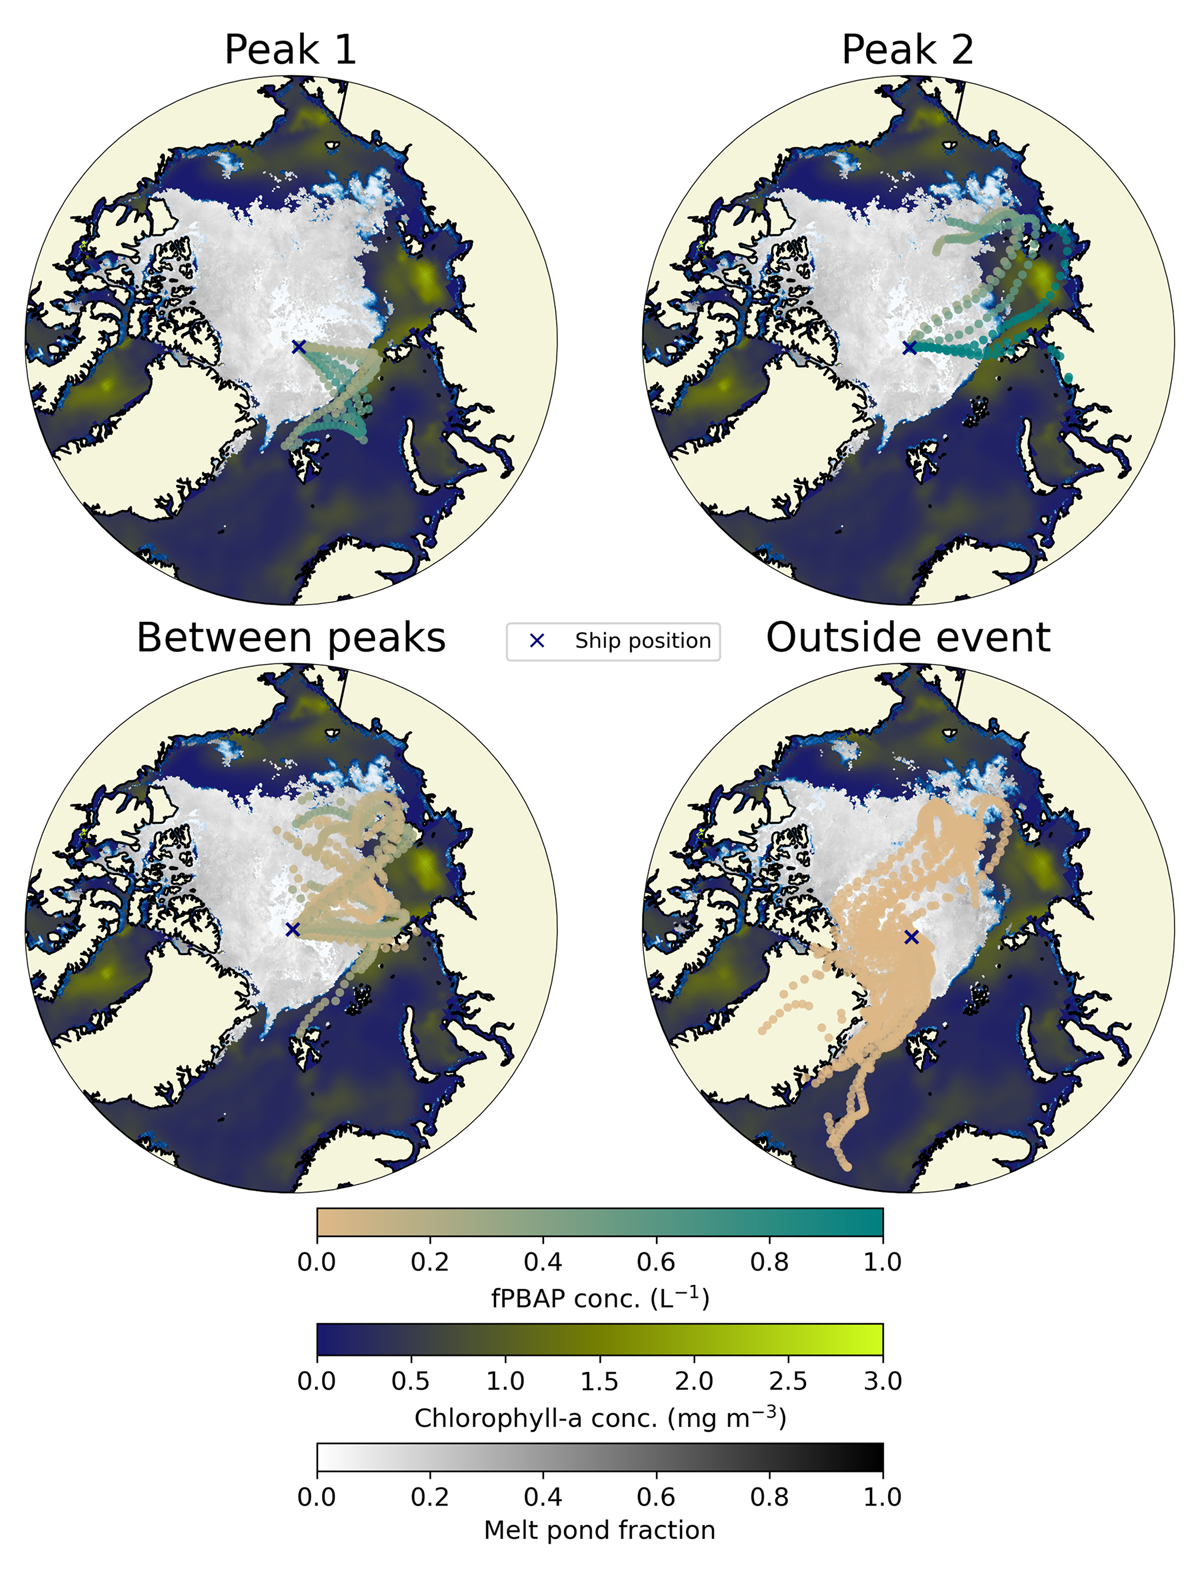
Figure 5
The source regions of air parcels during the fPBAP event during August 19–23, 2018. Panels show maps with the LAGRANTO 5-day backward air parcel trajectories separated into: (a) The first fPBAP peak of the event; (b) peak 2, with the highest concentration of fPBAPs; (c) the period between peaks; (d); the two reference periods before and after combined (outside event). Trajectory points are color-coded by the fPBAP concentration measured at the ship during the arrival of the air parcel (3-hour mean value). Only trajectory points that resided inside the boundary layer are shown. The ocean color indicates the average chlorophyll-a concentration during the period, and the grey shading of the ice represents the melt pond fraction in each grid cell.
From Figure 6, it is clear that for all stages during the event, and outside the event (panels d and h), the last 20–30 hours before reaching the ship were spent over ice. Had the time windows outside the event had major precipitation, lower wind speeds over the ice than during the event, or less points near the surface, then the lack of fPBAP could have been explained by higher losses during this time, or low emissions. Instead, most trajectory time over ice, with an average wind speed of 7 m s–1, is seen outside the event. The average accumulated precipitation before reaching the ship is 8 mm for trajectories during peak 2, and 3 mm outside the event (similar magnitude between peaks and for peak 1). Additionally, within the event, it is the period between the peaks that shows the most time spent over ice (Figures 5 and 6), and it is also associated with the lowest fPBAP concentrations during the event. We therefore conclude that it is highly unlikely that the observed fPBAPs during this period were sourced within the pack ice. This is also confirmed by FLEXPART-WRF source attribution results (Figure S6), showing a very low chance of origin in the pack ice during the event, while very high outside the event.
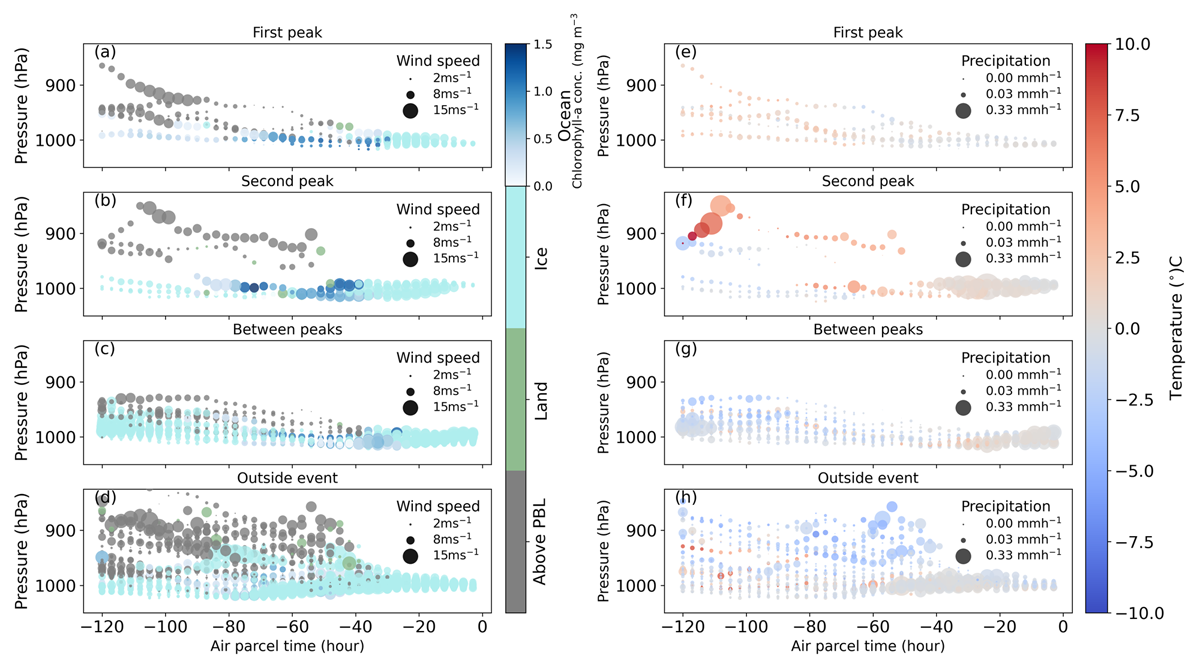
Figure 6
Vertical distribution of the air parcel trajectories during the fPBAP event on August 19–23, 2018. This figure shows vertically resolved LAGRANTO 5-day air parcel back trajectories color-coded by location and surface properties (left panels) and temperature (right panels) for the periods shown in Figure 4. The marker size in the left panels shows the wind speed, while the marker size in the right panels shows the columnar total precipitation.
The fPBAP event stands out when it comes to trajectory points at near-surface pressures over open ocean, in particular with high chlorophyll-a concentration, compared to outside the event (Figure 6d compared to panels a–c). In fact, peak 2 (Figure 6b), when the highest fPBAP concentrations were recorded, shows the highest wind speeds (8 m s–1 on average over ocean) over the most chlorophyll-a-rich ocean. During peak 1, and to some extent also between the peaks (panels (a) and (c)), the air also passed over an ocean surface with elevated chlorophyll-a, but the wind speed was slightly lower (5 and 6 m s–1 on average, respectively) compared to during peak 2. Wave breaking, which is the most effective sea spray production, occurs at wind speeds around 5 m s–1 and higher, with a steep wind dependence (Monahan and Muircheartaigh, 1980; Salter et al., 2015). This could explain why fPBAP concentrations were not as high, along with the fact that the chlorophyll-a concentrations were also lower.
Both throughout and outside the event, the trajectories passed over land sporadically (Figure 6). During the event, the residence times over land was only 0–6 hours per trajectory. Outside of the event (Figure 6D), residence times were similar but at higher wind speeds. Figure 5 shows that the land influencing the air parcels during the event would have been the Siberian coast, Svalbard, or other islands in the Arctic ocean, while outside the event, the trajectories passed over the coastline of Greenland. The influence from land is, therefore, not necessarily comparable, as the surface cover could have been different between these areas. However, both Svalbard and the coast of Greenland have been observed to be sources of biological INPs in the summertime Arctic (e.g. Pereira Freitas et al., 2023; Sze et al., 2023). Therefore, the fact that the land influence does not differentiate the event from the periods of low fPBAP concentration suggests that they were not of terrestrial origin, although we cannot completely exclude it. Since the points over land are so few along the air parcel trajectories during the event, especially in combination with higher wind speeds assumed to be needed for the emission process, we consider a marine source of fPBAPs during the event more likely than a terrestrial one. Furthermore, extending the back trajectories to 10 days, as illustrated in Figure S4, only a couple of the trajectories during the event extend over land and do not increase the fraction of time spent over land, as also shown by Karlsson et al. (2022).
During the entire event (Figure 6a–c), trajectories passed, near the surface, over ocean areas with elevated surface chlorophyll-a between about 70 to 30 hours before reaching the ship. This is the most prominent common trait of the trajectories during the event. The source of fPBAPs seems unlikely to lie earlier along the trajectories, as they differed a lot within the event further back in time, spending time over ocean, ice, or above the boundary layer, with varying wind speeds (Figure 6a–c). All of this is also featured in the trajectories outside the event (Figure 6d) and therefore not characteristic of the unique fPBAP event.
Moreover, there is no common precipitation tendency along the trajectories launched during the fPBAP event (Figure 6e–g). During peak 1, the air parcels reaching the ship were only influenced by constant surface precipitation rates of 0.03 mmh–1 or less, which can be considered negligible. During peak 2, the air parcels are, in general, associated with similarly low precipitation rates (with the exception of one trajectory about 120 hours before reaching the ship, before passing over ocean) until about 40 hours from the ship, when surface precipitation increased to rates about 10 times and higher, only decreasing slightly approaching the ship. Between the peaks, the onset of precipitation was similar along the trajectories, but the highest rates were reached slightly closer to the ship. The temperature along the trajectories in the last 40 hours before reaching the ship was close to 0°C for almost all trajectories, particularly during precipitation. The fact that the lack of precipitation leading up to peak 1 stands out from the rest of the event is another possible explanation as to why it also differs in terms of the chemical composition and fPBAP-to-coarse particle ratio. It could be that coarse particles other than FPBAPs were removed more efficiently by precipitation. If the fPBAPs were of marine origin, they would have been co-emitted with sea salt particles, which generally have a higher hygroscopic growth factor (Swietlicki et al., 2008; Zieger et al., 2017) than bioaerosols (Johnson, 1999; Lee et al., 2002) by a factor of two or more. This could have led to an earlier and more effective removal of the sea salt containing particles, which probably made up most of the coarse particles. On the other hand, INP of biological origin have been shown by Stopelli et al. (2015) to be removed by precipitation almost twice as effectively as other particles of the same size. However, their study was primarily conducted at below freezing temperatures. In our case, given that the precipitation seems to have occurred around 0°C (Figure 6, panels f-g), it was likely too warm for ice nucleation. Fog can also enhance concentrations of fPBAPs by strengthening their ability to survive air transport (Evans et al., 2019). This is a less likely explanation in our case, as it would not explain the decrease in other coarse mode particles, especially as fog was also present during peak 1, when coarse particle concentrations were still high. It also cannot be ruled out that the difference in fPBAP-to-coarse particle ratio between peak 1 and the rest of the event is due to different source regions during peak 1, indicated in Figure 5, but also by the presence of black carbon during this period (Figure 4). The fPBAPs detected during the rest of the event may have come from a different source that was more enriched in fPBAPs compared to the rest of the coarse mode already at the stage of emission. However, given the striking difference in precipitation along the trajectories during peak 1 and the rest of the event, we consider the second pathway in Figure 3 (i.e., selective wet removal of other coarse mode particles) the most plausible explanation. This hypothesis could potentially be further tested using modeling, which could advantageously also be applied to test the impact that fPBAP events like the one we observed here might have on clouds and radiation.
3.2.3 Large scale meteorological conditions
Although our analysis of air parcel origin during the event did not indicate long range transport, there may have been transport pathways above the boundary layer. In order to fully address the likelihood of the fPBAPs being transported from outside the Arctic, we have analyzed the large scale meteorological conditions in the Arctic during the fPBAP event (Figure 7). At this time, the dynamical meteorological conditions were affected by a dipole structure in the mean sea level pressure, a low-pressure system on the western side of a high-pressure area, which allowed relatively strong southerly transport of aerosols and moisture from the Arctic Ocean north of the Eurasian coast towards the pole (Figure 7). At the beginning of the event, the low-pressure system was located near Svalbard, and the high pressure over the Kara Sea. This kind of dynamical setting allows direct air parcel transport from the open ocean toward the pole within the sector 0–60°E in the lower troposphere. Between the peaks, both the low-pressure system, including the development of new cyclones, and the high-pressure area over the Kara Sea moved eastward. The dipole pattern became stronger over the course of the event, strengthening the northward geostrophic wind between the low and high-pressure areas (Figure 7). Before peak 2, the 10 m wind speed in the sector 120–150°E over the Laptev Sea exceeded 10 m s–1, strengthening aerosol emissions from the sea surface. Emitted particles would have been transported towards the pole, with the strong northward directing winds.
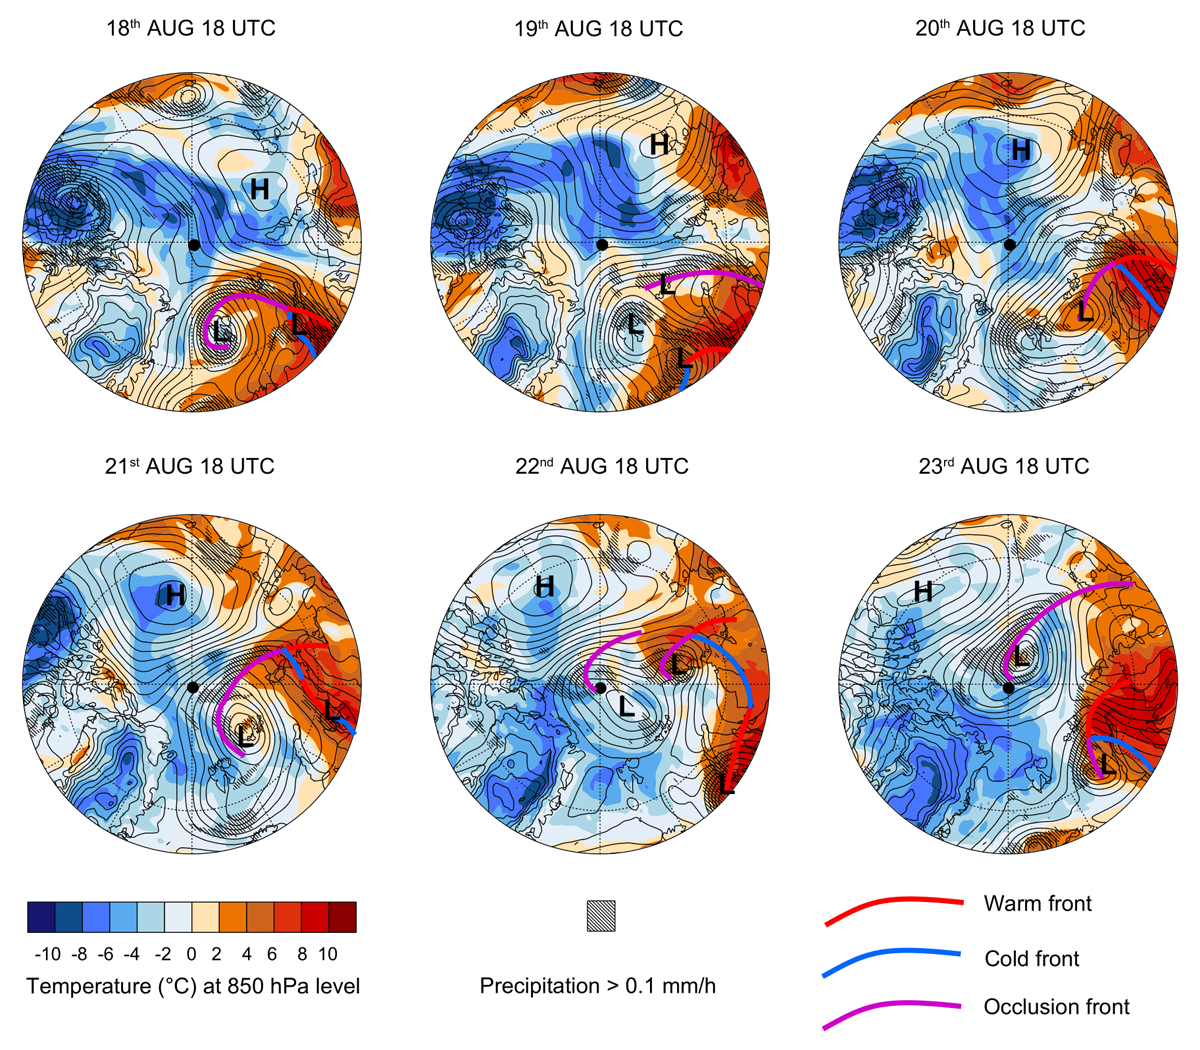
Figure 7
Large scale meteorological conditions during the fPBAP event. Air temperature at 850 hPa level, areas of precipitation, as well as the different fronts, according to ERA5 reanalysis. The fPBAP event lasted from 18:00 UTC on August 18, to 06:00 UTC on August 23, 2018, with peaks midday on the 19 (peak 1), and early morning the 23 (peak 2).
Air masses of warm continental origin did not reach the pole at the 850 hPa level or below it during the entire event. Instead, the cyclones carrying the warm air mass occluded before reaching the pole, and therefore the warm air mass could not be advected to the pole near the surface, preventing direct transport of continental aerosols to the pole. This is in support of our conclusion that the fPBAPs came from an Arctic marine source during the event. However, updrafts associated with fronts, which separate the warm air parcel from colder Arctic air parcels, may transport aerosol particles higher in the atmosphere, where they can act as condensation or INPs and fall with precipitation (e.g., Stopelli et al., 2015). During peak 1 of the fPBAP event, the warm air mass and precipitation associated with the frontal zones were located quite far from the pole, which further decreases the probability of a contribution of aerosol particles from continental sources. Between peaks and during peak 2, precipitation associated with the occlusion front of the warm air mass was located at or near the pole. Therefore, there is a possibility that the fPBAPs were transported above the boundary layer, from a mid latitude continental source. As fPBAPs can effectively act as INPs, they can fall from upper levels in the atmosphere to the surface with snowfall. Snow particles grow faster than or at the expense of water droplets (Wegener-Bergeron-Findeisen process), therefore, INPs can fall out from clouds before other aerosol particles. The surface temperature was most likely too warm for snow to form, but it could have happened above the boundary layer, allowing fPBAPs to precipitate down to the surface more effectively than the other coarse mode particles, contributing to the increased fPBAP to coarse particle fraction. This process corresponds to the first pathway illustrated in Figure 3, and was also hypothesized in Beck et al. (2024). For this pathway to be plausible, there would had to have been precipitation above the boundary layer during the event, and the snow particles must have sublimated near the surface, as the fPBAPs were sampled in the air. In our case, there was no precipitation at the surface during the event, and the air temperature was around 0°C, thus it is unlikely that there was frozen precipitation aloft that entirely sublimated in the boundary layer. In summary, based on our analysis of the large scale meteorological conditions during the fPBAP event, the only way the fPBAPs could have come from outside the Arctic would be if they were emitted from continental sources, lifted and transported above the Arctic boundary layer and precipitated out as ice, sublimating at the surface. We consider this scenario less likely than the second pathway in Figure 3, as argued in section 5. During peak 1, the meteorological conditions did not facilitate continental transport at all.
3.2.4 Ocean productivity in source regions
Based on the results of our analysis, we find it most likely that the fPBAPs during the event came primarily from an Arctic marine source, in the Laptev or Kara seas, or along the ice edge north of the Barents Sea. This conclusion is compatible with three of our initial hypotheses; the marginal ice zone (MIZ), an open ocean (ice-free) plankton bloom or river run-off influenced region (number 2–4 in Figure 3). An important factor in our analysis is the TOPAZ-ECOSMO Biogeochemistry Reanalysis data that we utilized to identify potential source regions of marine fPBAPs, assuming their connection to ocean productivity. To assess the spatial accuracy of the TOPAZ-ECOSMO product, we have also conducted a comparison using overlapping 7-day averages from three different satellite products (see Figure S5 and discussion in the Supplementary Information). Despite some uncertainties, there seems to be a clear indication of elevated surface chlorophyll-a concentration in the Laptev and northern Kara Sea, as well as along the Siberian coast during the time frame of the fPBAP event shown in Figure 5. This also aligns with earlier studies, indicating high primary production in this area (Anderson et al., 2011; Gibson et al., 2022; Terhaar et al., 2021). While the various products exhibit a reasonable level of agreement on a large scale, notable local discrepancies among the different datasets suggest that the data quality may not be robust enough to confidently compare smaller areas, such as the Siberian coastline, versus the open Laptev Sea. Therefore, we cannot confidently differentiate between the remaining plausible hypotheses. Neither the model or satellites are likely to be able to indicate whether phytoplankton levels in the MIZ are elevated, due to methodological limitations (see Supplementary Information). However, the comparison to satellite observations shows the TOPAZ-ECOSMO product effectively identifies regions of higher ocean productivity, adding robustness to our conclusion that the observed event of elevated concentrations of fPBAP at the North Pole resulted from transported sea-spray from ice-free Arctic Ocean regions with elevated biological productivity (section 3.2.2).
4 Conclusions
During the Arctic Ocean 2018 expedition, fluorescent primary biological aerosol particles (fPBAPs) were observed close to the geographical North Pole during the transition to early fall. Until the sea ice freeze-up, fPBAP showed a high correlation and similar concentrations as ice nucleating particles (INP) at –20°C, indicating that biological sources of INPs are important even at very high latitudes, with potential implications for cloud formation and radiative properties during the Arctic summer and early fall (when marine biological activity is high). We found that the occurrence of fPBAPs was not dependent on local wind speed, indicating other sources than local sea spray from leads or melt ponds or blowing snow, while more abundant non-fPBAP fluorescent particles correlated well with local wind speed and the coarse mode particle concentration. During the expedition, one particular event of high fPBAP concentrations was observed for several days at overall very low aerosol number concentrations. Over the course of the event, the concentration of fPBAP increased from virtually zero to a maximum of 1.5 L–1, while their contribution to the total coarse mode concentration grew from less than 0.1 to 55%. Concurrent aerosol chemical composition and size measurements suggested a marine source of particles during the event. Air parcel source analysis revealed that the high fPBAP concentrations were associated with air passing over ice-free ocean areas further south, near the sea ice edge, with elevated biological activity. However, these source areas include islands, e.g. Svalbard, and we can therefore not exclude that the event was also influenced by terrestrial sources. These findings contribute to a better understanding of the properties and sources of biological particles over the pack ice in the interior of the Arctic Ocean. In addition, our results suggest an increased future importance of bioaerosols in a fast changing Arctic, where more open water and increased marine productivity (e.g. Arrigo and van Dijken, 2015), could potentially lead to stronger Arctic marine sources that can impact cloud microphysical properties and the radiative balance in the central Arctic.
Future observational studies should include concurrent DNA sampling for an additional source characterization of bioaerosols, in combination with cloud phase characterization to further assess the role of fPBABs in controlling mixed-phase cloud properties. Although it is clear that the characteristics of biological particles and their role as INPs are still far from fully understood, there is growing evidence that local Arctic sources of biological INPs can be highly significant, particularly in summer, and we have shown this extends to the interior of the Arctic Ocean still covered by perennial sea ice. To further investigate the impacts of biological INPs on Arctic clouds modeling that takes into account their emissions, processing in the atmosphere, and their impacts on the Arctic cloud life cycle is needed. Challenges remain to make this possible, including limited knowledge of the specifics of spatial and temporal variation of biological INP emissions from the Arctic Ocean, lack of knowledge of the physical/chemical state of primary aerosol emissions, uncertainties in aging processes such as wet removal and condensation of gases onto particles (potentially impacting INP activity) in the atmosphere, and other uncertainties in describing the biological INP lifecycle in the Arctic atmosphere. Ideally, atmospheric models forced with realistic sea ice and ocean conditions, including online INP and marine/sea ice region emissions that operate at the cloud resolving or large eddy simulation spatial/time scale, are the next step to understand exactly how biological INPs are impacting Arctic clouds, with modeling conducted where both biological INP and cloud conditions are measured simultaneously. The event described in this study is an ideal test case for parametrizations of marine biological particles as INPs in this future modeling work. Once specific cases of observations are modeled reproducing both biological INP and cloud properties, this insight into the processes linking biological INPs to clouds and the specific model parameterizations can be integrated into coupled ocean-ice-atmosphere models and Earth system models that describe the fully coupled Arctic and global Earth system.
Data Accessibility Statement
All previously published observational and trajectory data used in this work can be found at the Bolin Centre for Climate Research (https://bolin.su.se/data): aerosol size distributions (Karlsson and Zieger, 2020), air parcel analysis (Wernli, 2022), meteorological data (Prytherch and Tjernström, 2019), aerosol chemical composition (Dada et al., 2022). The ice nucleating particle data is available at Porter et al. (2022). The MBS data is available at Kojoj et al. (2024).
The ERA5 data (Hersbach et al., 2018a, b) was downloaded from the Copernicus Climate Change Service, https://doi.org/10.24381/cds.adbb2d47 and https://doi.org/10.24381/cds.bd0915c6, last accessed in May 2024. The Arctic Ocean biogeochemistry reanalysis (Simon et al., 2015) was provided by the E.U. Copernicus Marine Service Information; https://doi.org/10.48670/moi-00006.
Satellite products of sea ice cover Melsheimer and Spreen (2019) and melt pond fraction were provided by the University of Bremen, and are publicly available at https://seaice.uni-bremen.de/melt-ponds/.
The three satellite retrievals of ocean color used for comparison are also publicly available from Copernicus Marine Service (European Union-Copernicus Marine Service, 2022; Simon et al., 2015), CEDA Archive (Sathyendranath et al., 2023), and NASA Ocean Biology Distributed Active Archive Center (NASA Ocean Biology Processing Group, 2017).
Additional File
The additional file for this article can be found as follows:
Acknowledgements
This project has received funding from the European Union’s Horizon 2020 research and innovation programme under grant agreement No 101003826 via project CRiceS (Climate Relevant interactions and feedbacks: the key role of sea ice and Snow in the polar and global climate system). The field measurements of the Arctic Ocean 2018 expedition were supported by the Knut-and- Alice-Wallenberg Foundation within the ACAS project (Arctic Climate Across Scales, project no. 2016.0024), the Bolin Centre for Climate Research (RA2), the Swedish Research Council VR (project no. 2018-05045), the Swiss National Science Foundation (grant no. 200021_169090), the Swiss Polar Institute, the BNP Paribas Swiss Foundation (Polar Access Fund 2018) and the European Research Council (648661 MarineIce). J.S. holds the Ingvar Kamprad Chair for Extreme Environments Research sponsored by Ferring Pharmaceuticals. MAG acknowledges support from the Hanse Wissenschaftskolleg Institute of Advanced Study (Delmenhorst, Germany).
The FLEXPART-WRF simulations were performed using HPC resources from GENCI–IDRIS (Grant A0150107141). The analysis of the large-scale meteorological conditions was enabled by resources provided by the National Academic Infrastructure for Supercomputing in Sweden (NAISS), partially funded by the Swedish Research Council through grant agreement no. 2022-06725. This study has been conducted using E.U. Copernicus Marine Service Information and data from NASA/OBPG/OB.DAAC.
The Swedish Polar Research Secretariat (SPRS) provided access to the I/B Oden and logistical support in collaboration with the U.S. National Science Foundation. We are grateful to the Chief Scientists—Caroline Leck and Patricia Matrai—for planning, technical support, and coordination of Arctic Ocean 2018 expedition, to the SPRS logistical staff, and to I/B Oden’s Captain Mattias Peterson and his crew for expert field support. We thank Heini Wernli (ETH Zürich, Switzerland) for calculating the air parcel back-trajectories, John Prytherch (Stockholm University, Sweden) for processing temperature and wind speed data, and Matthew Salter (Stockholm University, Sweden) for helpful comments and invaluable contribution to the measurements and sampling. The authors also gratefully acknowledge Linn Karlsson and Julika Zinke (Stockholm University, Sweden) for helping during the preparations and execution of the expedition. The authors are grateful for the support and collaboration with the University of Hertfordshire (Paul Kaye and Warren Stanley) related to the development and support of the MBS instrument.
Competing Interests
The authors have no competing interests to declare.
Author Contributions
PZ was responsible for the acquisition of the main observational data, and the original concept of the study. GPF developed the preprocessing scripts. JK, GPF, MM, MAG, TN, AMLE, BH, ADS, RL, LM, JLT, and PZ all contributed to the conceptualization, design, and early investigation of this work. JK performed main data analysis and visualization and led the writing of the manuscript. MM, TN, RL, and BH performed supporting data analysis and provided additional figures. CM, JS, and BH further contributed to the data acquisition. All authors contributed to the writing and editing of this manuscript.