
Figure 1
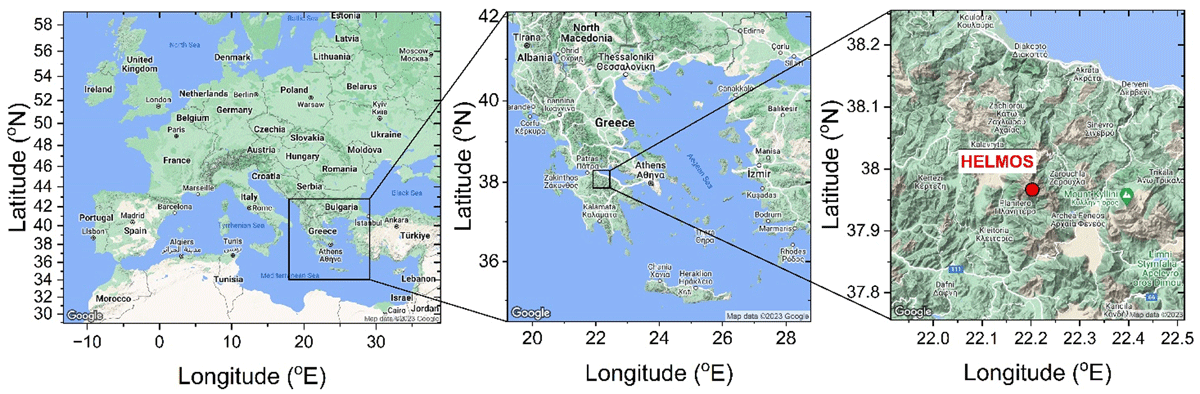
The study area (left), the sub-domain over Greece (middle), and the regional area around (HAC)2 is marked by a red dot.
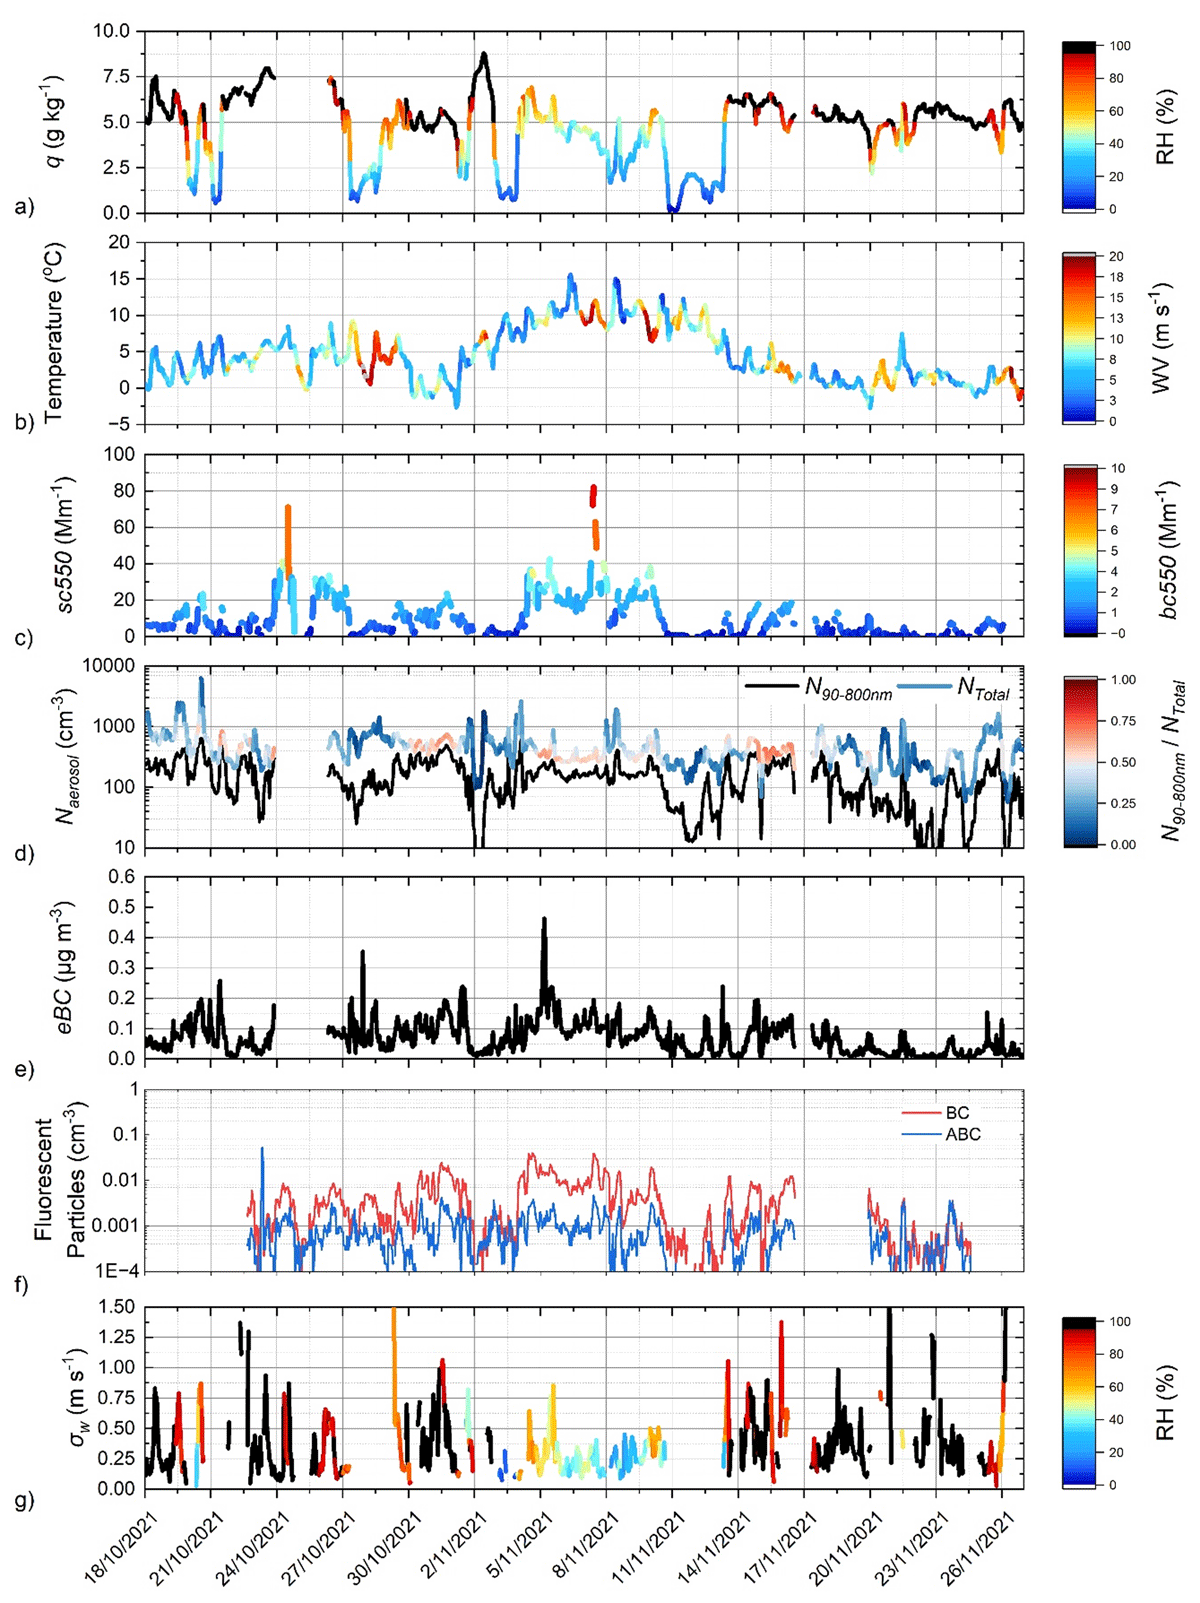
Figure 2
Timeseries of a) q (g kg–1) and RH (%), b) ambient temperature (oC) and horizontal wind velocity (m s–1), c) scattering coefficients sc550 and bc550 (Mm–1), d) N90-800 nm, Ntot (cm–3) and N90–800 nm/Ntot, e) eBC (μg m–3), f) fluorescent particles BC and ABC (cm–3), and f) σw (m s–1), as measured by the synergy of in situ and remote sensing techniques at the (HAC)2 height level between 18 October to 26 November 2021.
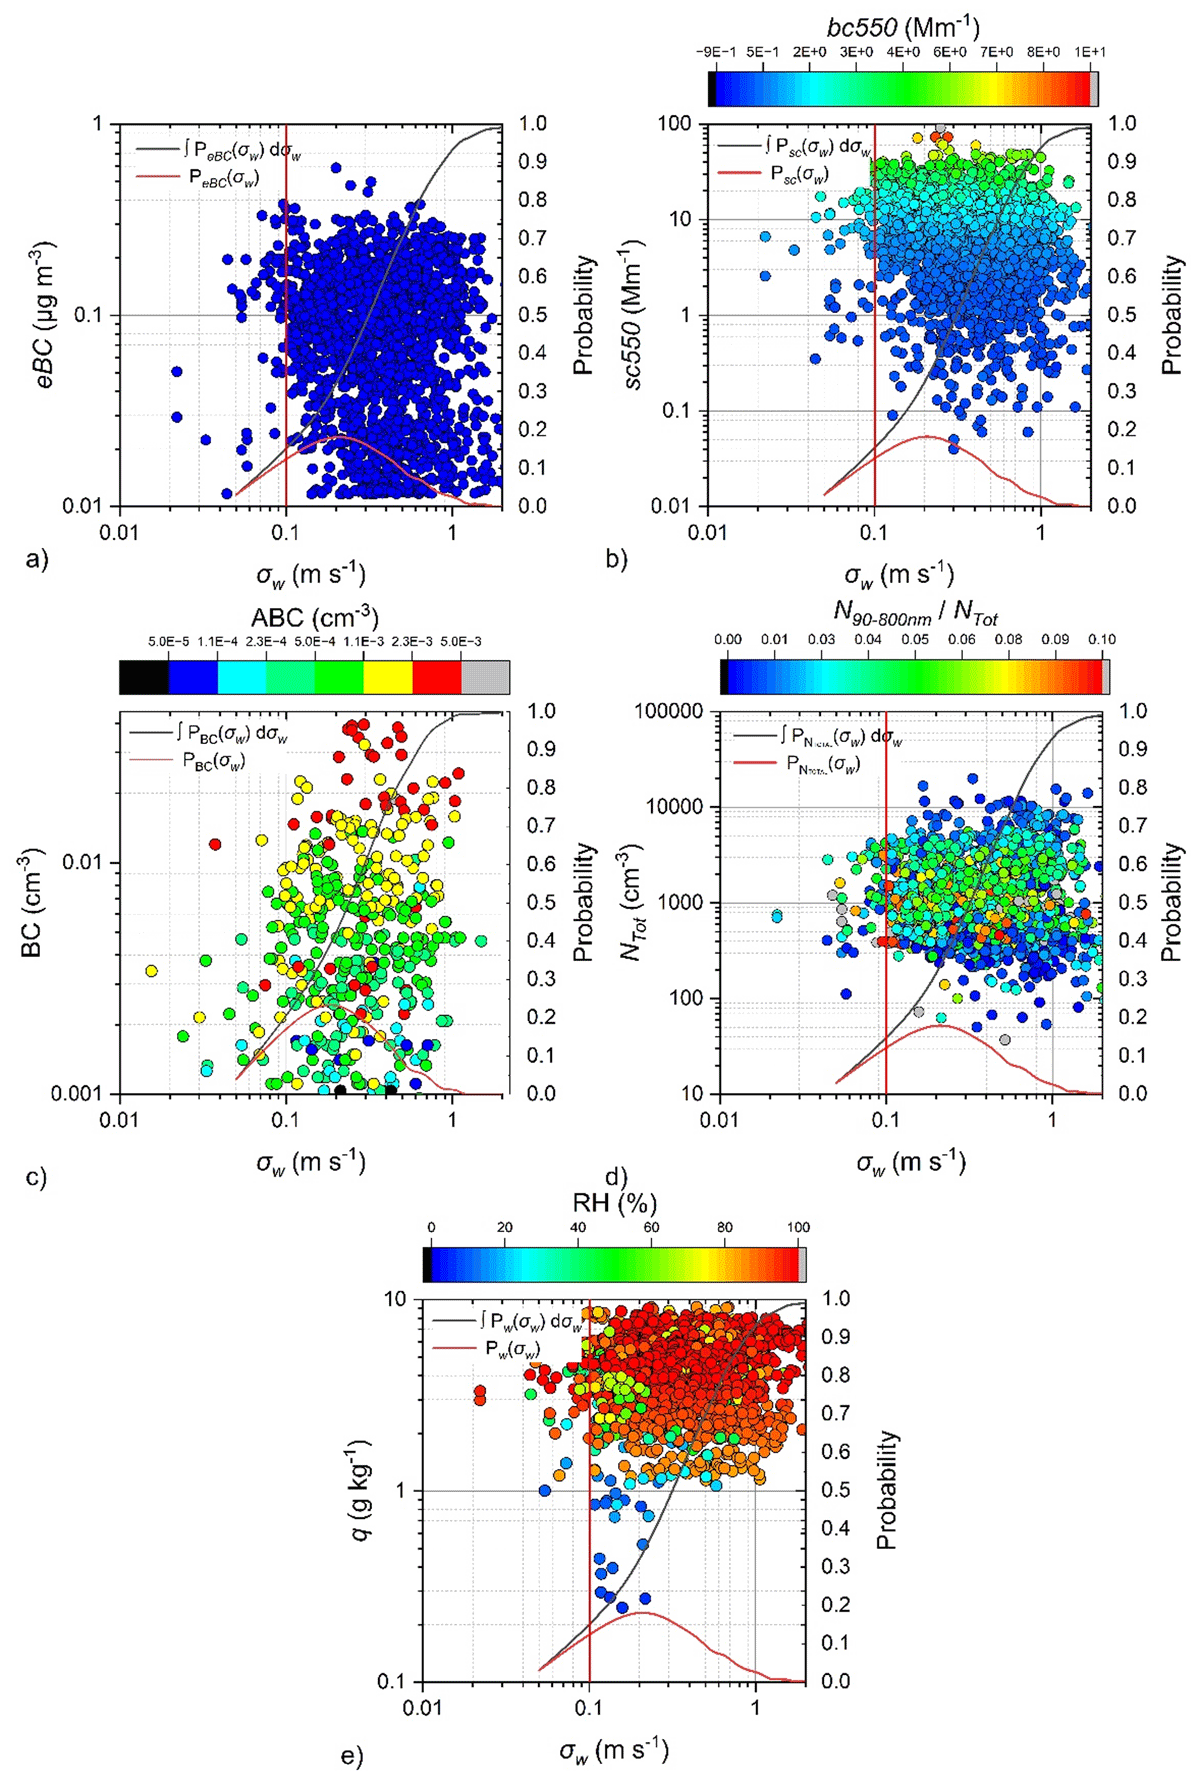
Figure 3
Scatter plots corresponding to a) eBC (μg m–3), b) sc550 and bc550 (Mm–1), c) BC and ABC (cm–3), d) Ntot (cm–3) and N90–800 nm/Ntot and e) q (g kg–1) and RH (%) in respect of σw (m s–1) as measured by HALO at (HAC)2 between 18 October to 26 November 2021. The red lines represent the normalized frequency of each measurement (called “Probability”), while the black lines are the integral of the normalized frequency of measurement (from the smallest σw value up to the given σw). The vertical red lines correspond to the σw threshold value of 0.1 m s–1 which indicates the transition between the PBL to the FTL regimes.
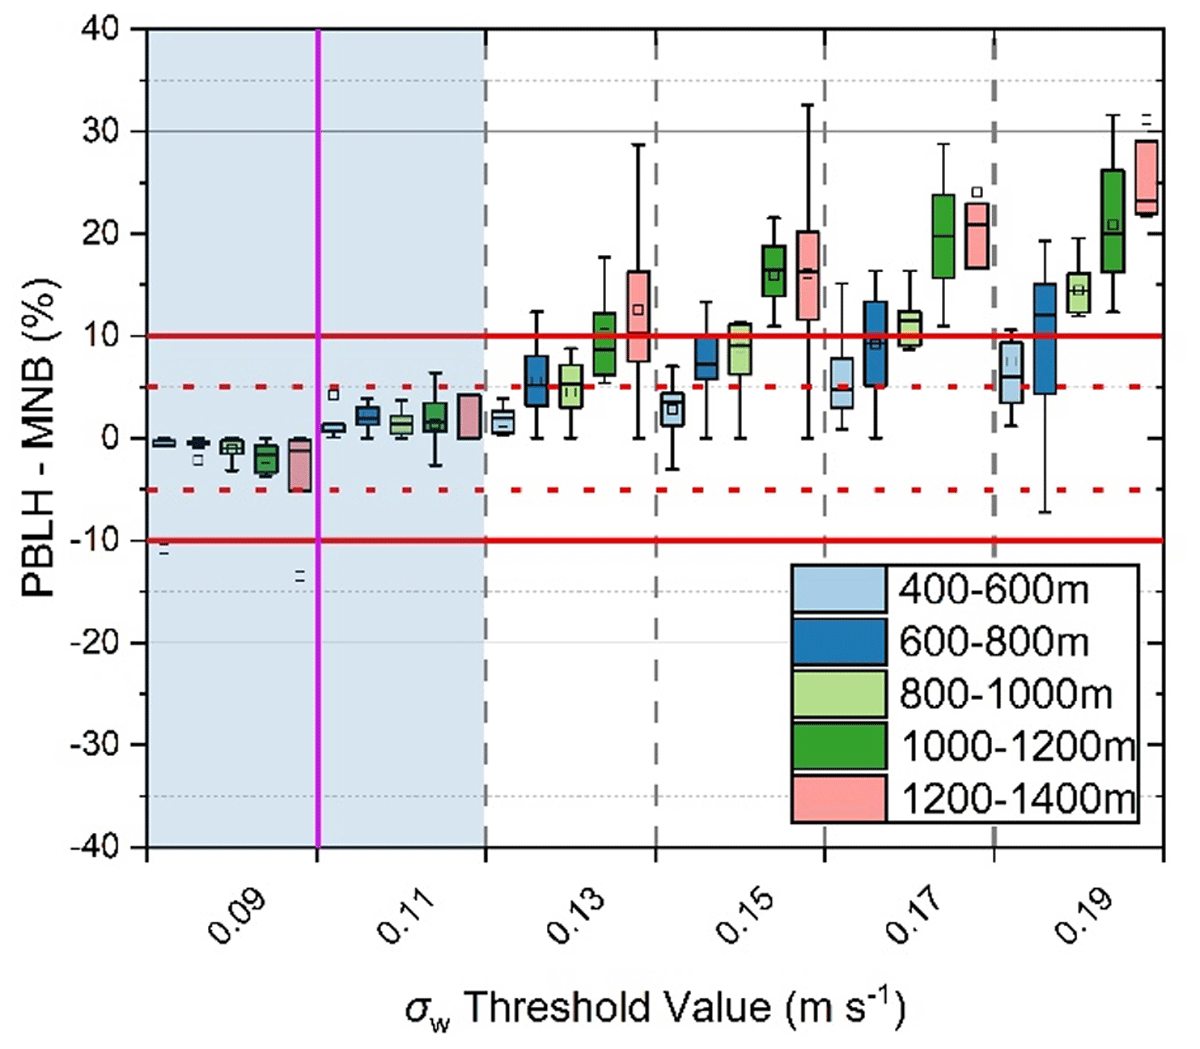
Figure 4
The PBLH-MNB (%) using σw threshold values 0.09 to 0.19 m s–1 compared to 0.1 m s–1 (magenta vertical line) at different PBLH ranges 400–600 m up to 1200–1400 m, respectively, between 18 October to 26 November 2021. The horizontal red solid and dashed lines correspond to a bias of ±5% and ±10%, while the shadow area depicts the σw threshold values where the MNB-PBLH (%) remains within ±15%.
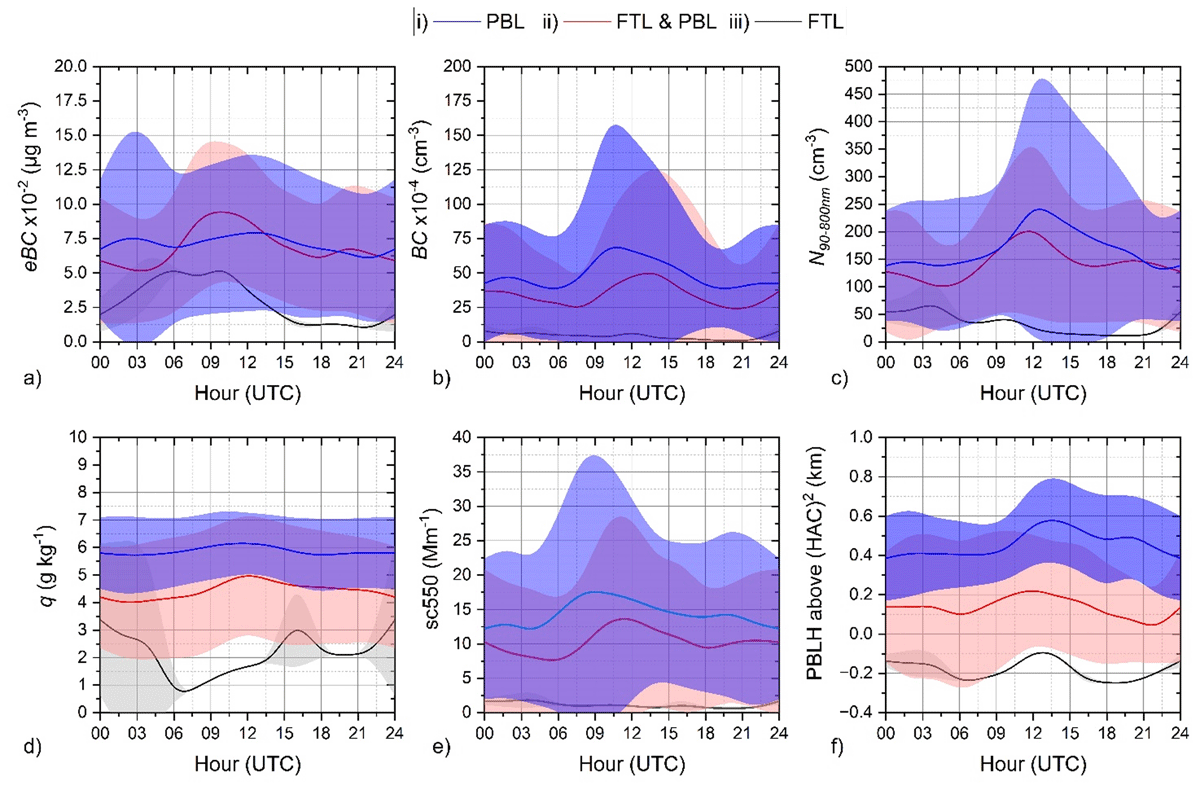
Figure 5
The diurnal cycle of a) eBC, b) BC, c) N90-800 nm, d) q, e) sc550 and f) PBLH for the three different subsets when (HAC)2 i) is within the PBL throughout the day (blue), ii) switches between the FTL and the PBL during the day (red), and iii) is within the FTL the entire day (black), between 18 October to 26 November 2021.
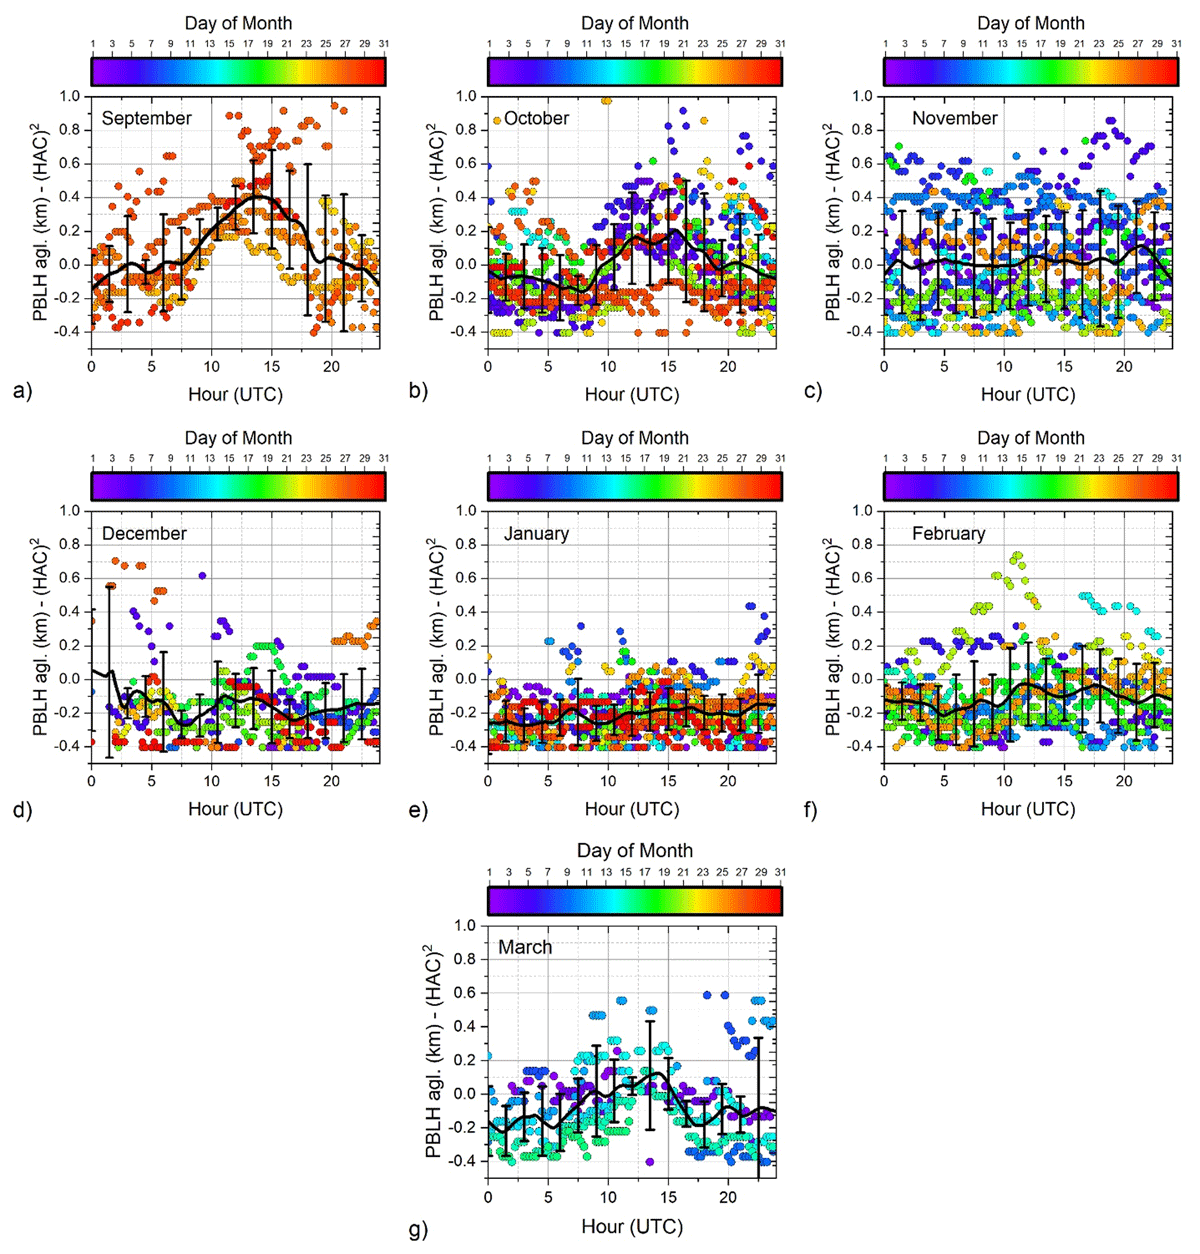
Figure 6
The monthly average diurnal cycle of PBLH for a) September 2021 up to g) March 2022. The PBLH values are colored by the day of the month. The solid black line corresponds to the hourly averaged values of the PBLH, while the error bars are the standard deviation of the PBLH values of each month, respectively.
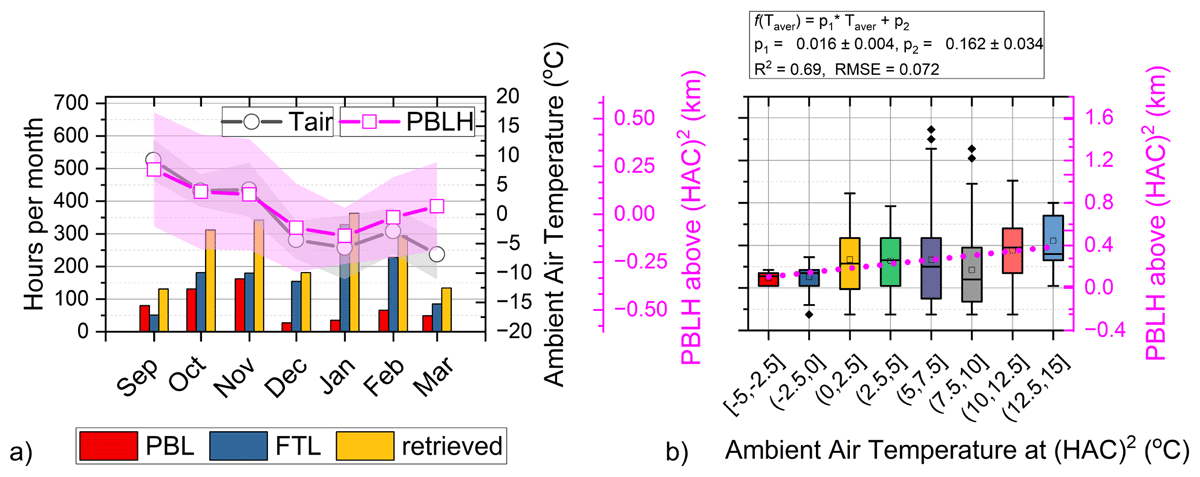
Figure 7
a) The histogram of the total hours where the (HAC)2 was within the PBL or FTL, and the seasonal trend of PBLH and the ambient air temperature, respectively; b) Boxplots of the PBLH values under cloud-free conditions based on the ambient air temperature at (HAC)2, grouped in bins from –5 up to 15°C with a step of 2.5°C, while the magenta dot line shows a linear relation between the ambient air temperature and the PBLH (September 2021 to March 2022).