
Figure 1
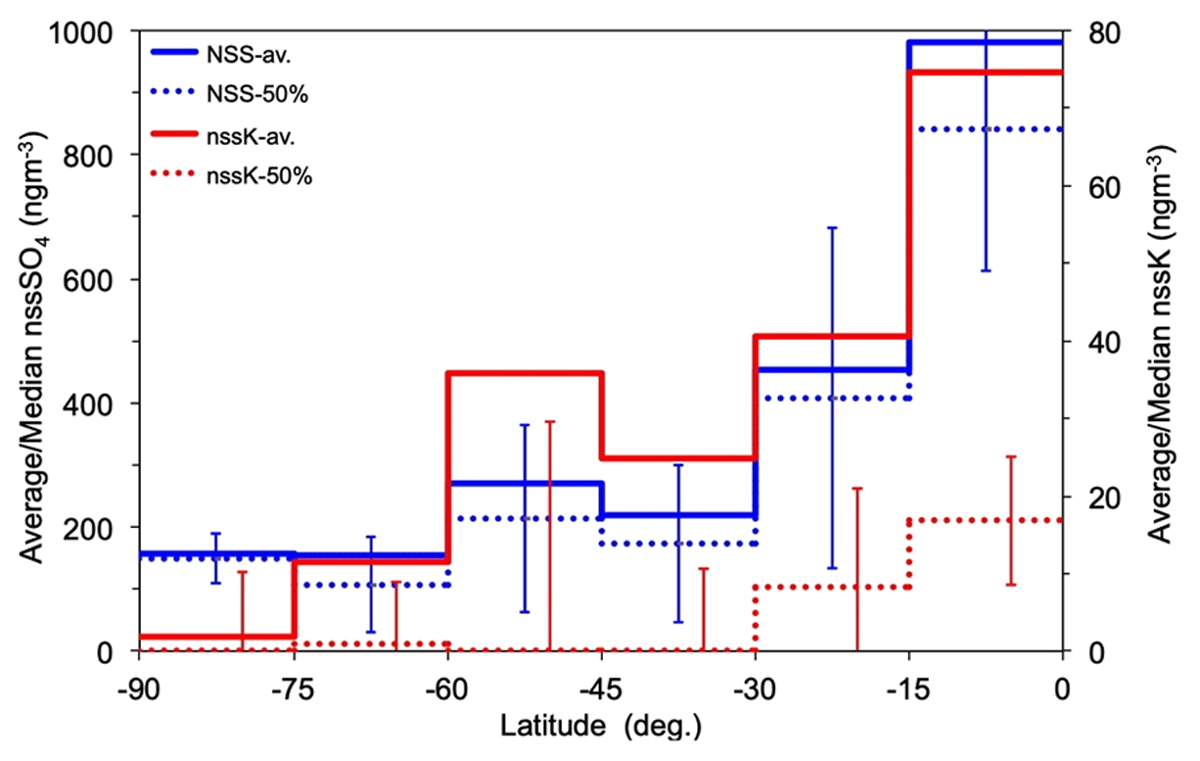
Annual average (av.) and median (50%) meridional distributions of nssSO4 (NSS), and nssK, both in ngm–3. The error bars represent corresponding MAD values.
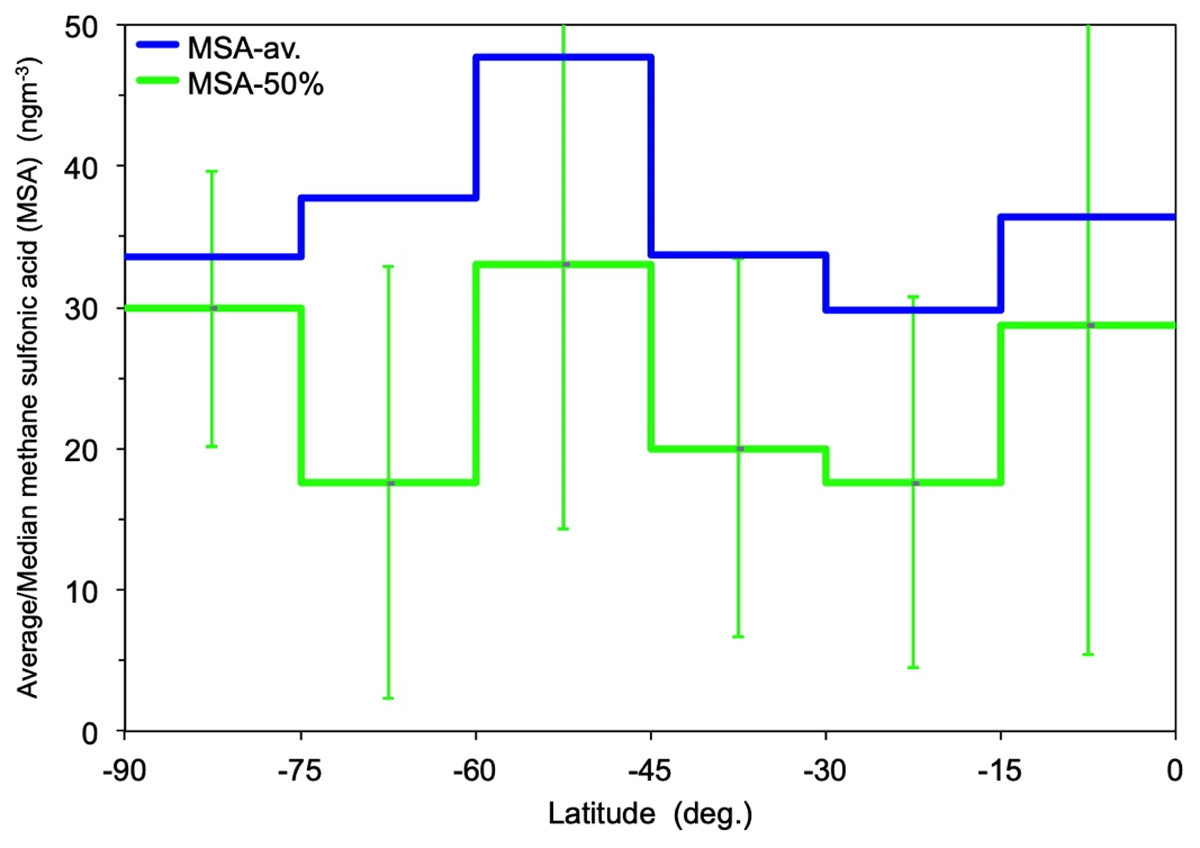
Figure 2
Annual average (av.) and median (50%) meridional distribution of methane sulfonic acid (MSA) in ngm–3. The error bars represent corresponding MAD values.
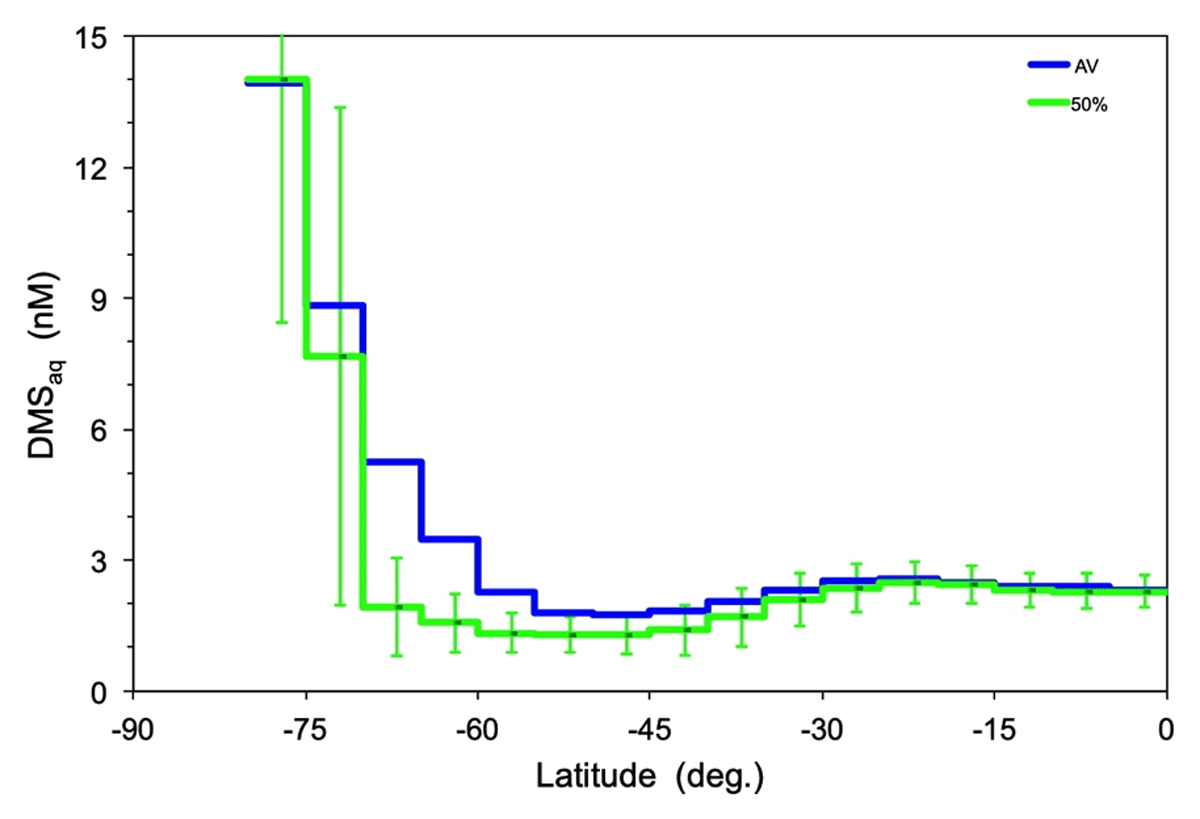
Figure 3
Annual average (av.) and median (50%) meridional distribution of dimethyl sulfide (DMSaq, nM) in surface sea water from Hulswar et al., (2021). The error bars represent corresponding MAD values.
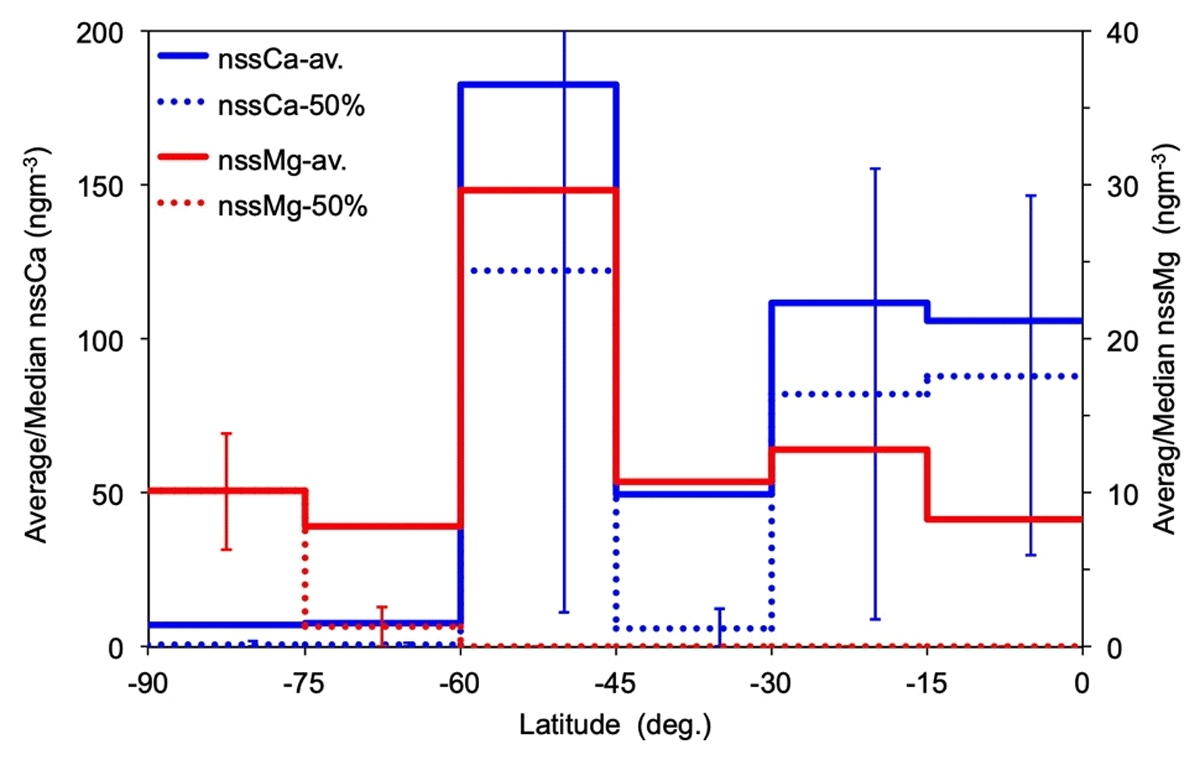
Figure 4
Annual average (av.) and median (50%) meridional distributions of nssCa, and nssMg, both in ngm–3. The error bars represent corresponding MAD values. North of –60° median values of nssMg are zero.
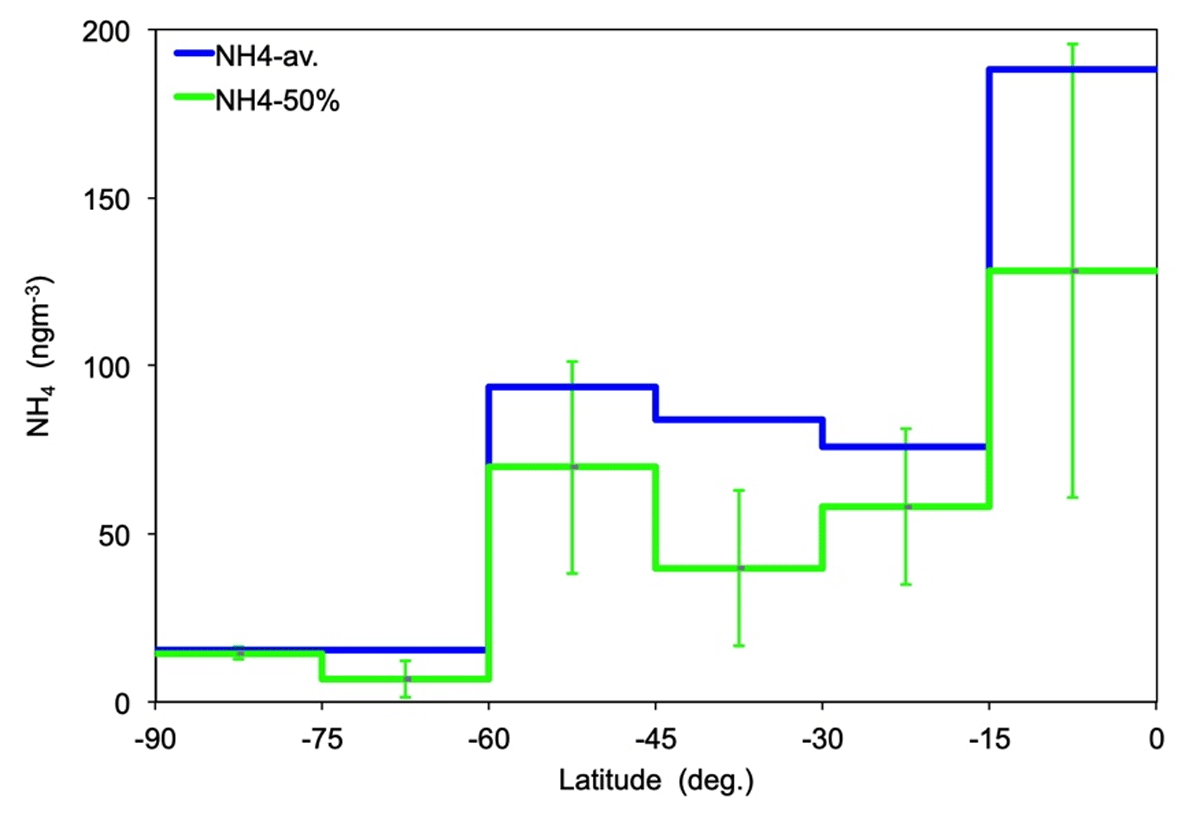
Figure 5
Annual average (av.) and median (50%) meridional distribution of ammonium (NH4) in ngm–3. The error bars represent corresponding MAD values.
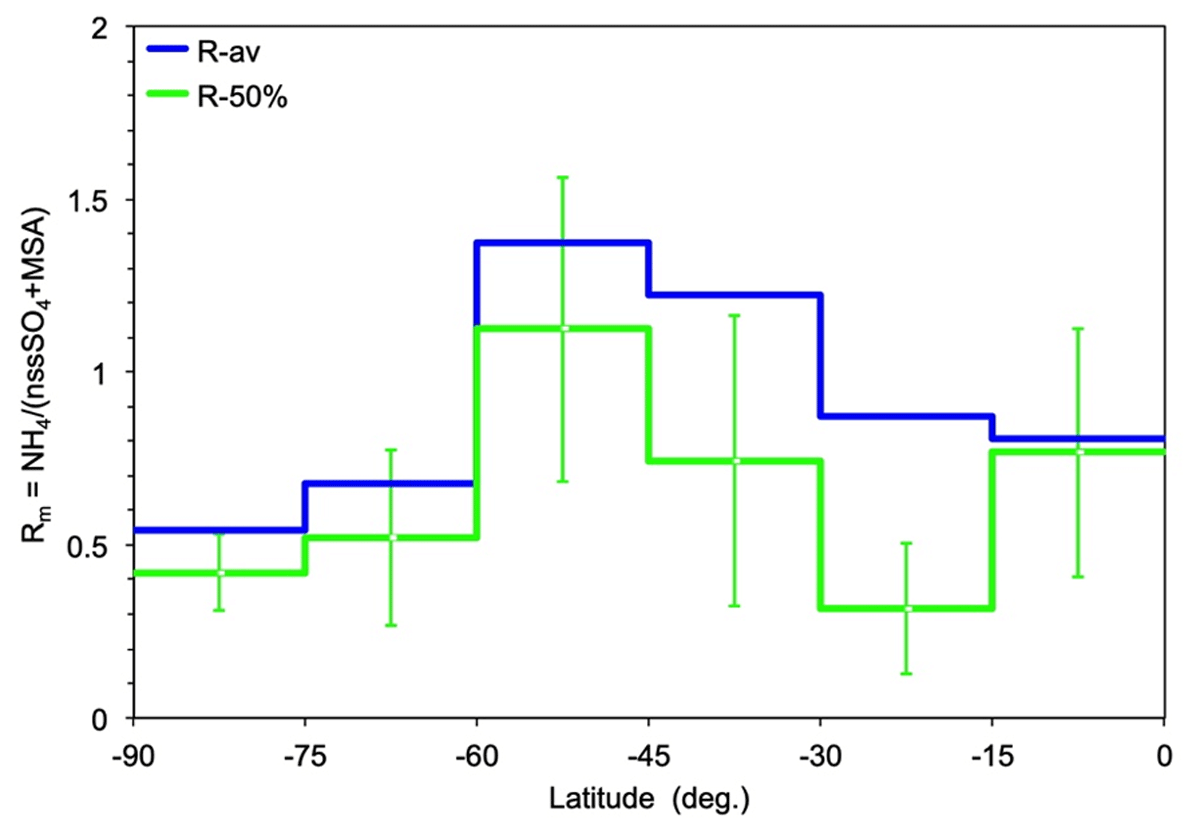
Figure 6
Annual average (av.) and median (50%) meridional distributions of the molar ratio Rm = NH4/(nssSO4+MSA). The error bars represent corresponding MAD values.
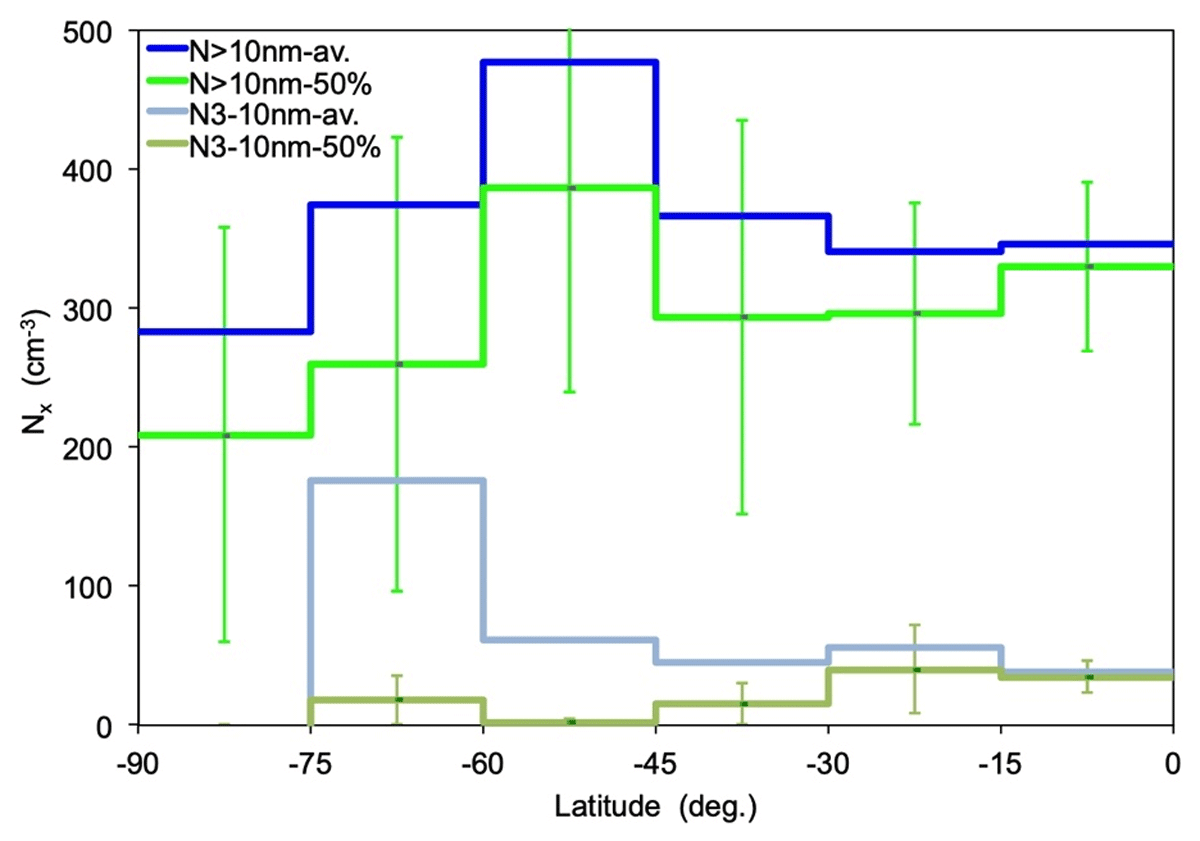
Figure 7
Annual average (av.) and median (50%) meridional distributions of particle number concentrations >10 nm, (N10, cm–3), and between 3 and 10 nm, (N3–10, cm–3). The error bars represent corresponding MAD values.
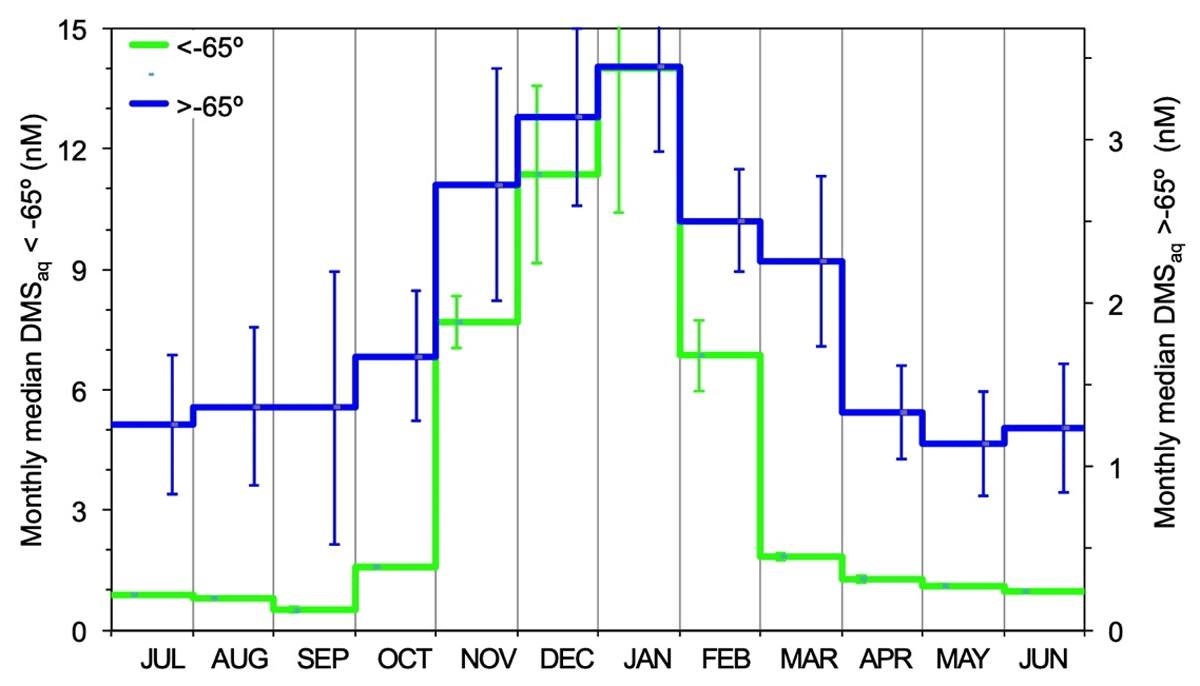
Figure 8
Monthly median DMSaq in surface sea water (nM) of the Southern Ocean south and north of –65° latitude, based on the climatology of Hulswar et al., (2021). The error bars stand for median absolute deviations. The scales for the two regions were chosen to align January values.
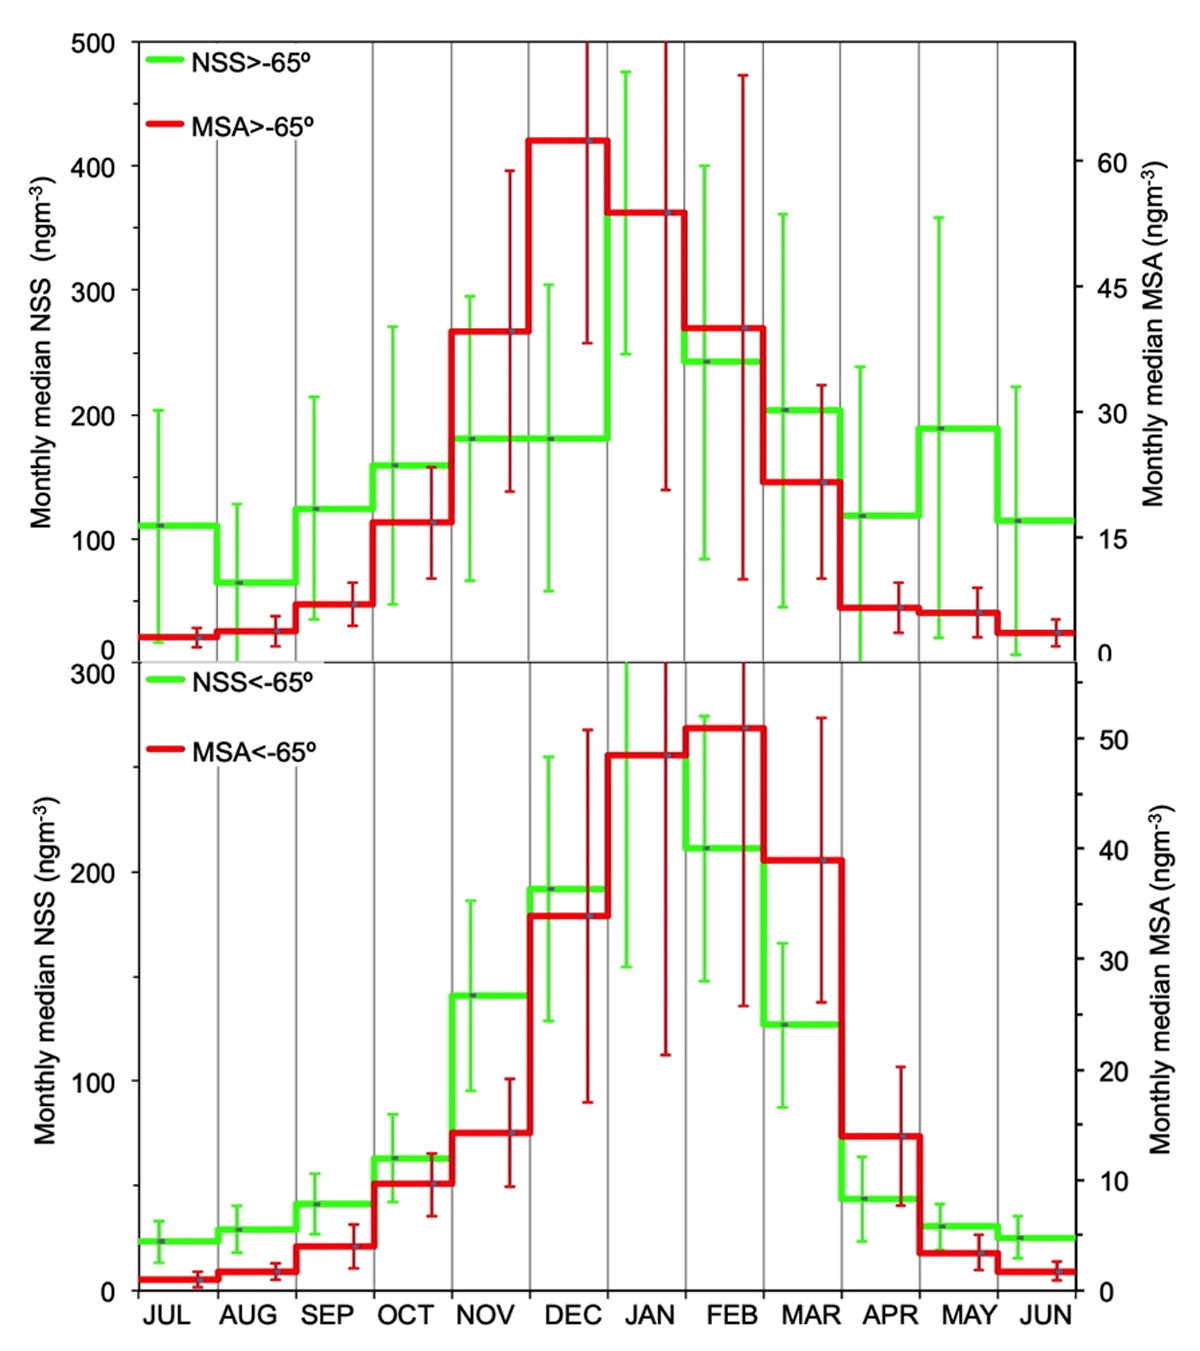
Figure 9
Top: nssSO4, (NSS, ngm–3) and methane sulfonic acid, (MSA, ngm–3) north of –65° latitude. Bottom: Same but south of –65° latitude. The error bars represent median absolute deviations. The scales for MSA were chosen to align January values of NSS and MSA.
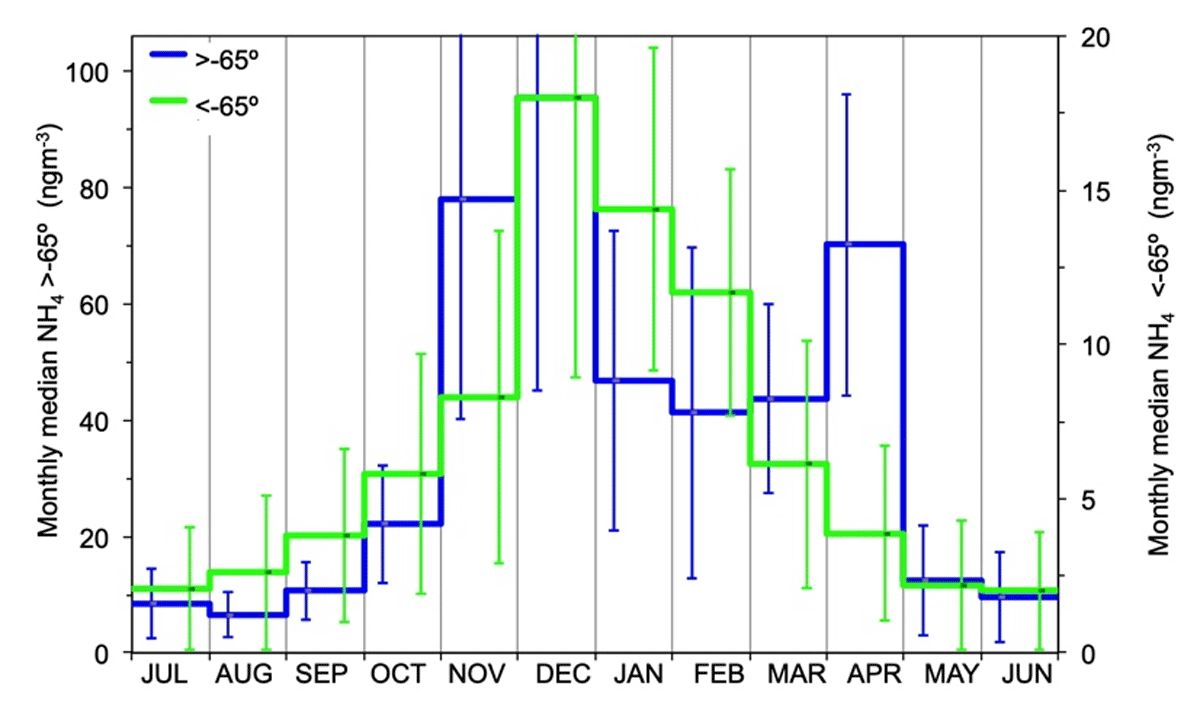
Figure 10
Monthly median ammonium concentrations, (NH4, ngm–3) north of –65° latitude. Bottom: Same but south of –65° latitude. The error bars stand for median absolute deviations. The scales were chosen to align December values in both regions.
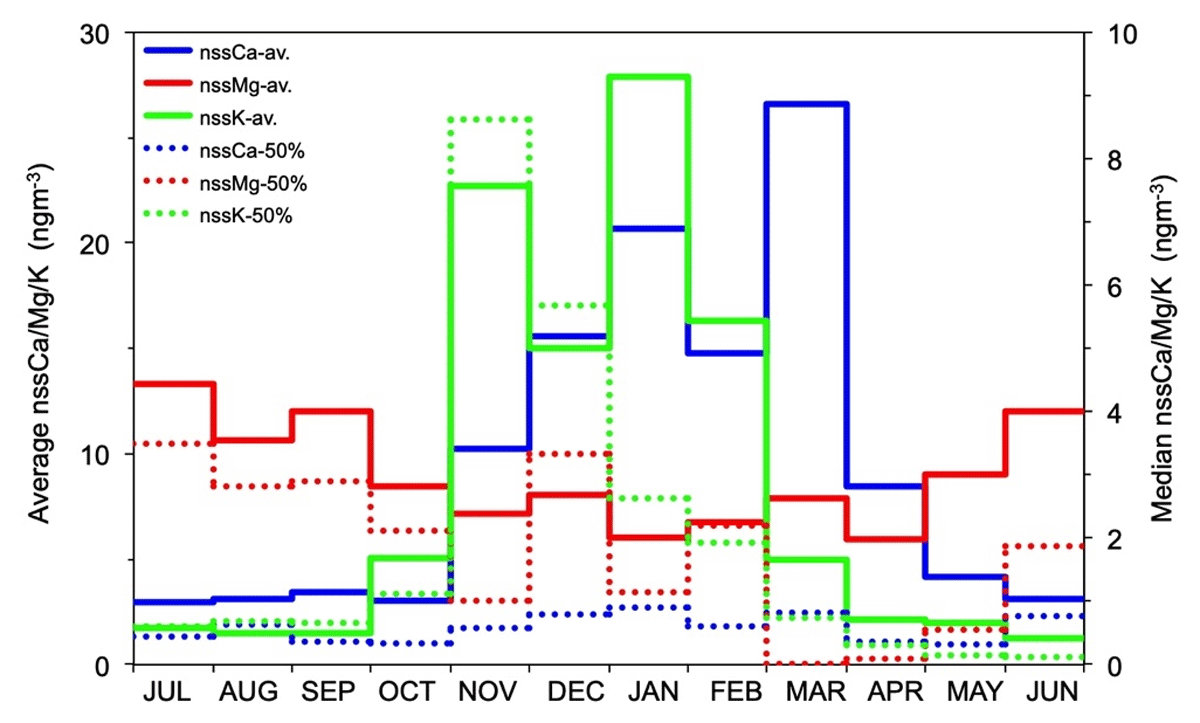
Figure 11
Monthly average and median concentrations of nssCa, nssMg, and nssK, in ngm–3 south of –45° latitude. Note the different scales for averages and medians.
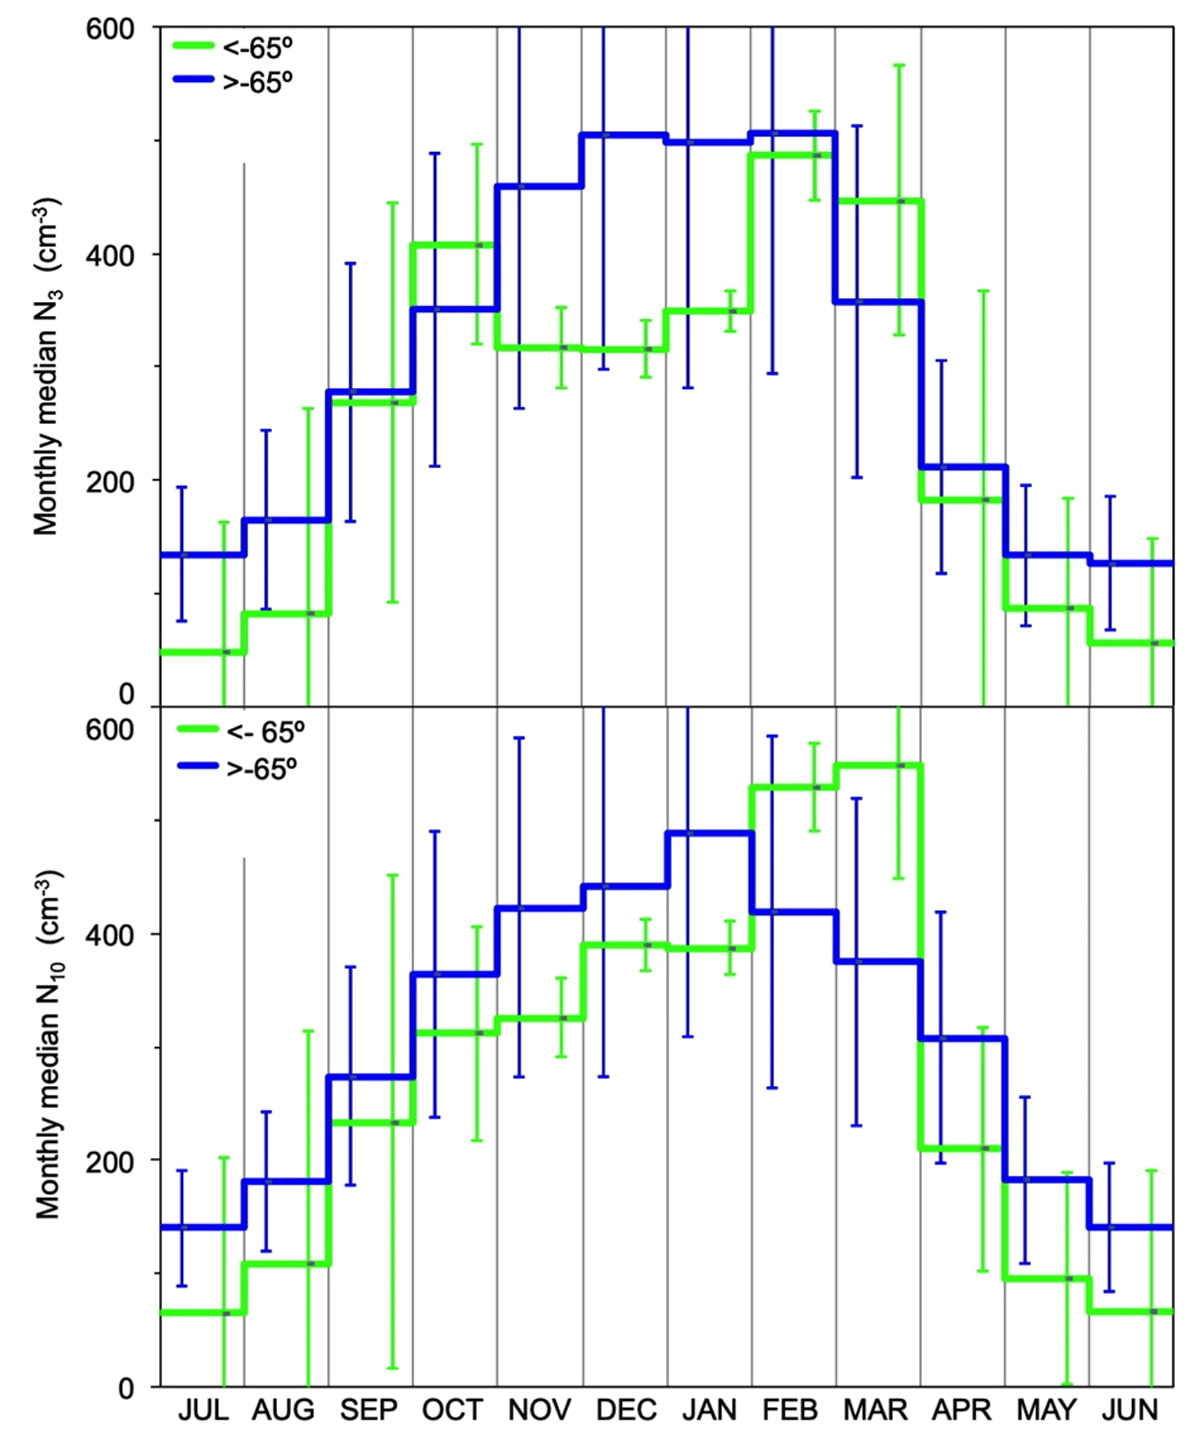
Figure 12
Monthly median number concentrations north and south of –65° latitude. Top: (N3, cm–3). Bottom: (N10, cm–3). The error bars stand for median absolute deviations.
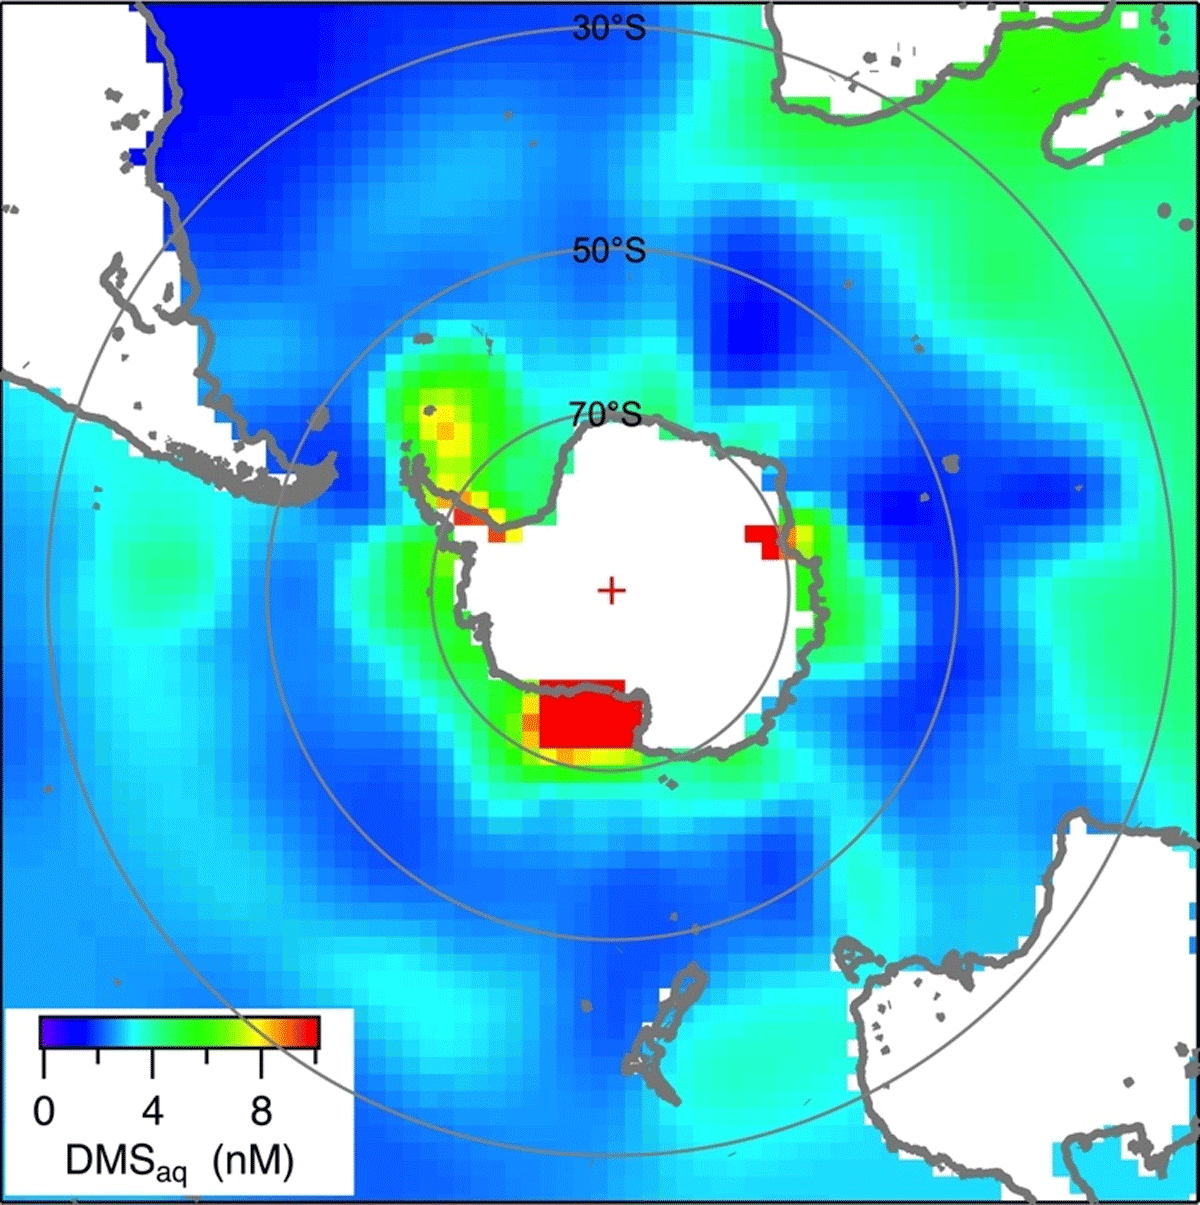
Figure 13
Average distribution of DMSaq, (nM), in surface waters of the Southern Ocean during the months October through April.3
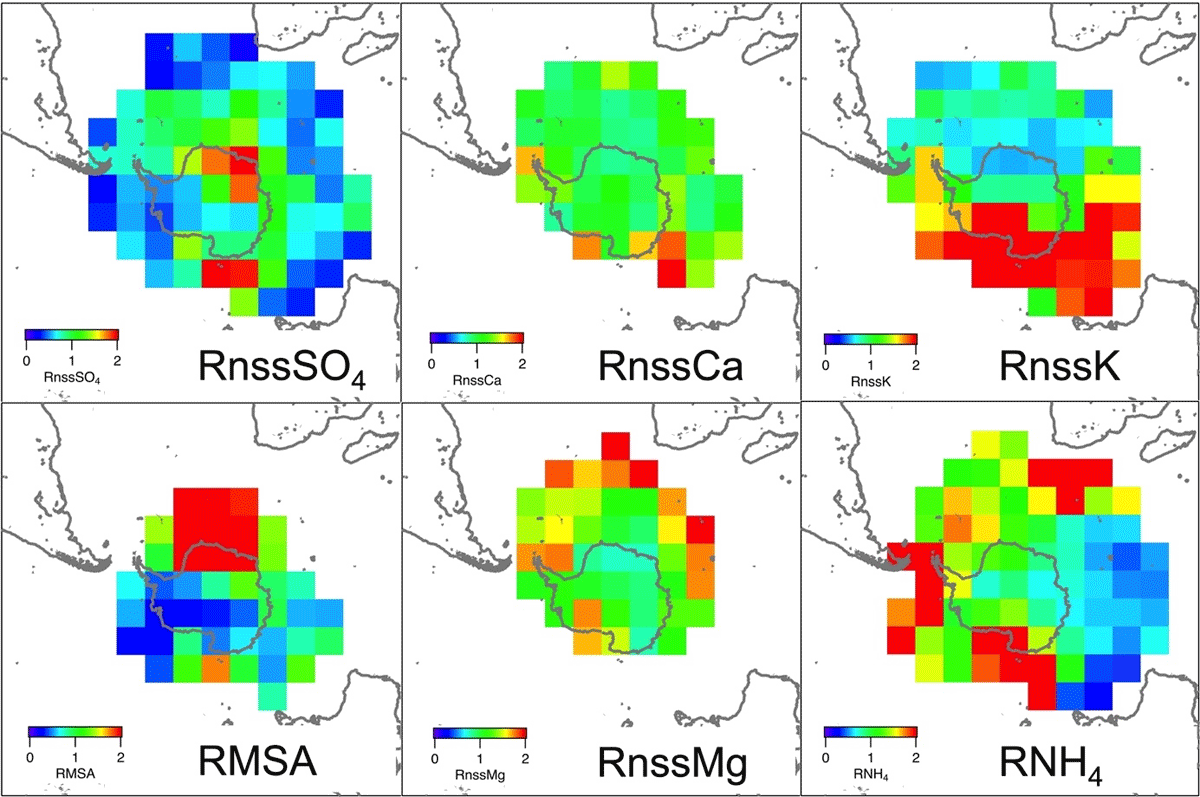
Figure 14
Ratio RX = (nrT>75%/nrT≤25%) of the relative number of trajectory hits for chemical aerosol sample values over the 75%-percentile to that for sample values ≤25%-percentile for the parameters nssSO4, nssCa, nssK, MSA, nssMg, and NH4 during the months October through April. See text for details about ratio RX.
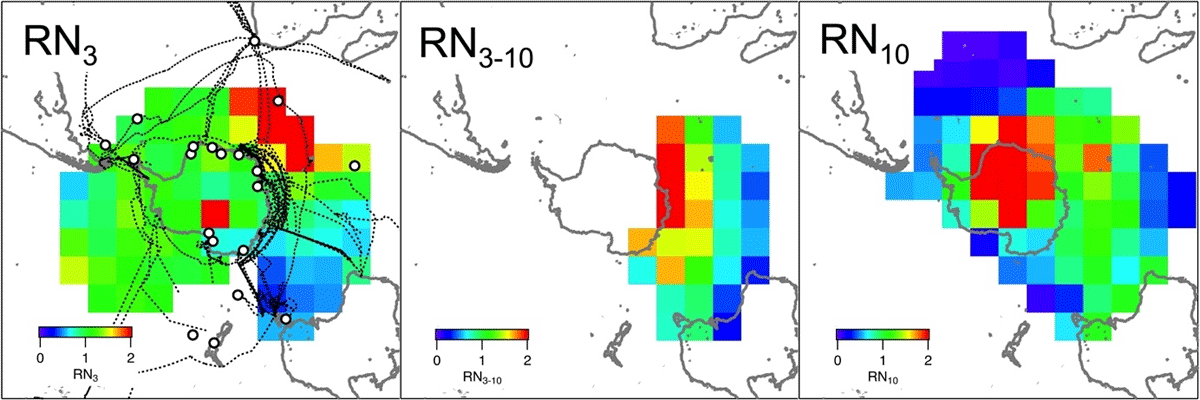
Figure 15
Ratio RX = (nrT>75%/nrT≤25%) of the relative number of trajectory hits for particle number concentrations values over the 75%-percentile to that for sample values ≤25%-percentile for the parameters N3, N3–10, and N10 during the months October through April. See text for details about ratio RX. Circles denote stations, dashed black lines show cruises from which data were used in this study.