
Table 1
Description of some dust physical characteristics for CAMSRA and MERRA-2.
| CAMSRA | MERRA-2 | |
|---|---|---|
| Assimilation system | IFS (CB05) cycle CY42R1, 4D-Var | GEOS-5 (ver 5.12.4), 3D-Var |
| Spatial resolution | 0.75° × 0.75°, 60L hybrid σ-p | 0.5° lat × 0.625° lon, 72L hybrid σ-p |
| Temporal resolution | 3-hourly 3D atmospheric analysis fields | 3-hourly 3D atmospheric analysis fields |
| Dust AOD assimilation | AATSR (2003–2012), MODIS (2003–) | AVHRR (1979–2002), MODIS (2000–), MISR (2000–2014), AERONET (1999–2014) |
| Aerosol module | IFS-AER (Rémy et al., 2019) | GOCART (Chin et al., 2002) |
| Size bins (μm) | 3 bins: 0.03–0.55, 0.55–0.90 and 0.90–20 | 5 bins: 0.1–1.0, 1.0–1.8, 1.8–3.0, 3.0–6.0, 6.0–10.0 |
| Mass fraction of dust emission (%) | 5, 12 and 83 | 6.6, 20.6, 22.8, 24.5 and 25.5 |
| Dust emission scheme | Ginoux et al. (2001) & Rémy et al. (2019), driven by 10 m wind adjusted for gustiness | Ginoux et al. (2001), driven by 10 m wind |
| Dust source | Dynamic. Sources linked to prognostic and diagnostic surface and near-surface variables. (Morcrette et al., 2008; Rémy et al., 2019) | Static. Potential dust source locations based on correleation of dust emitting regions with large-scale topographic depressions (Ginoux et al., 2001) |
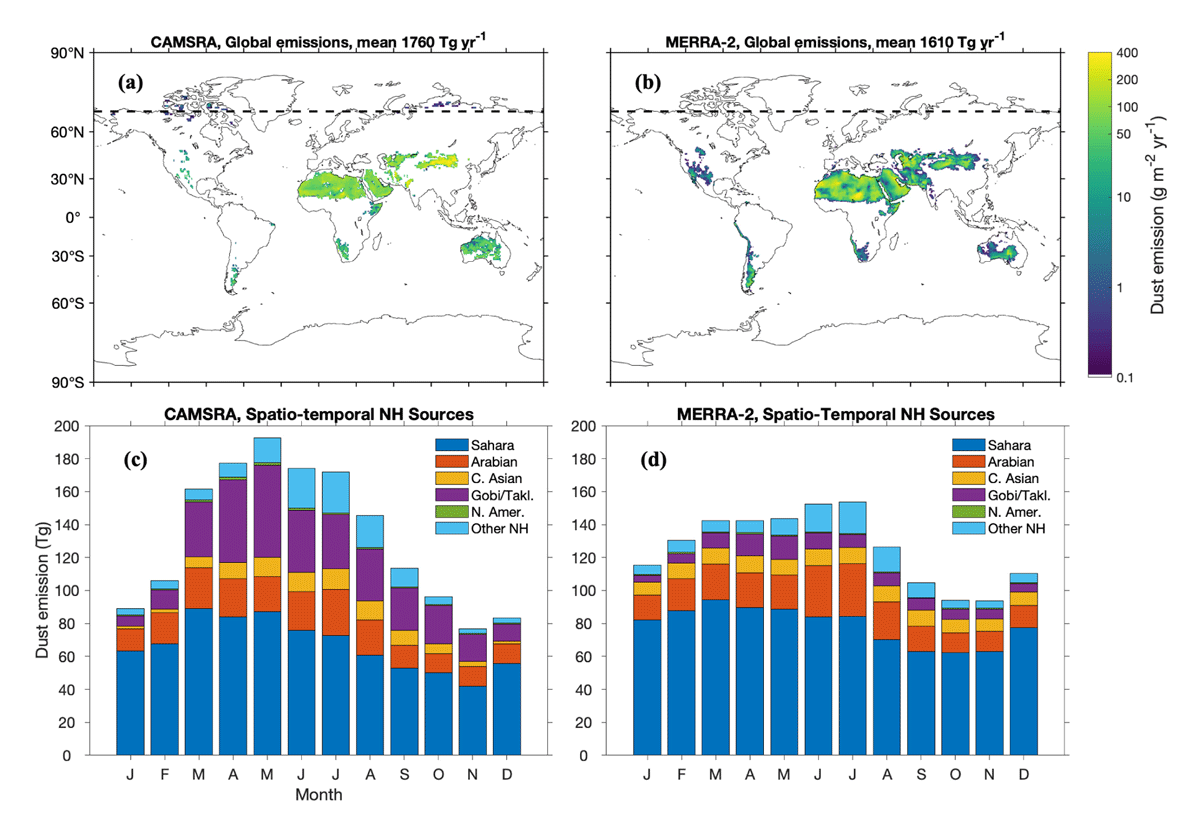
Figure 1
Global climatological (2003–2018) distribution of (a,b) dust emission fluxes (g m–2 yr–1, note the logarithmic scale) and (c,d) spatio-temporal distribution of the northern hemisphere dust sources (Tg Month–1) for CAMSRA (a,c) and MERRA-2 (b,d). The dashed line marks 70° N latitude (a,b).
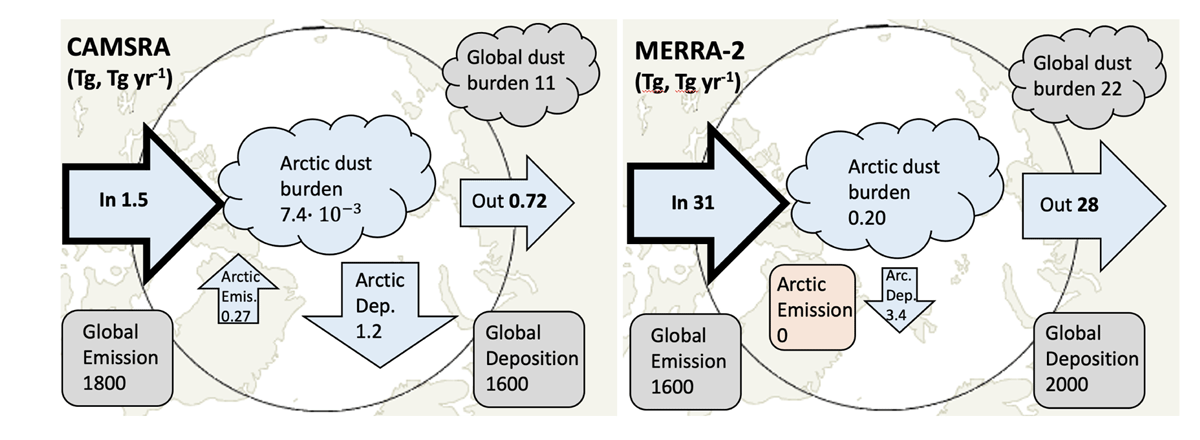
Figure 2
Arctic climatological (2003–2018) dust budget for CAMSRA (left) and MERRA-2 (right).
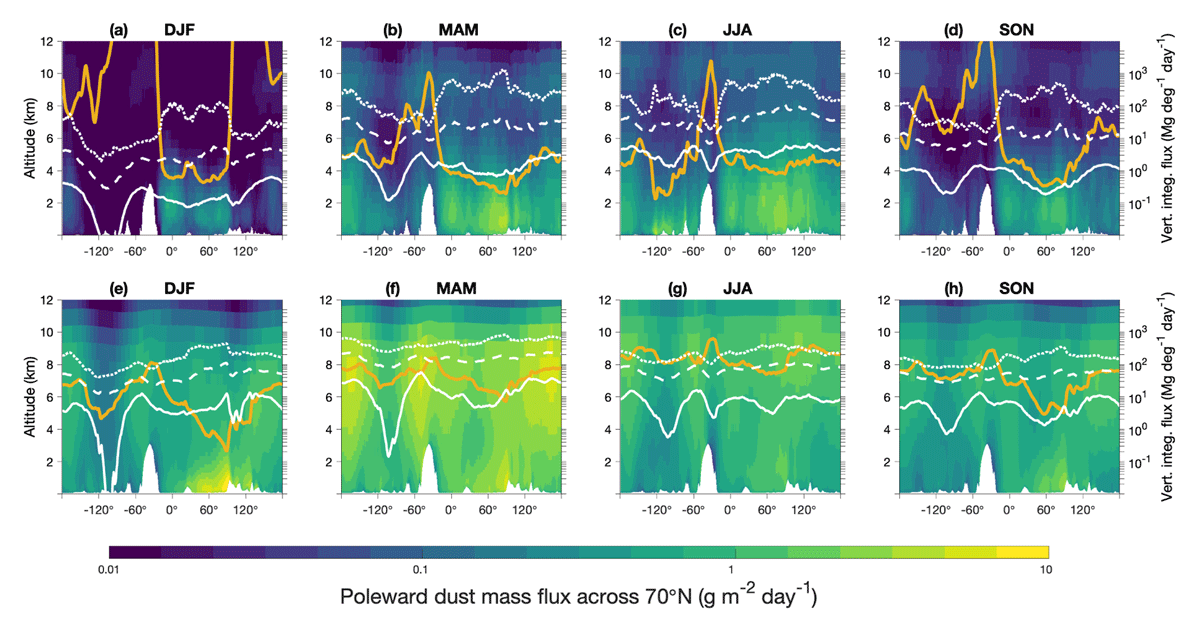
Figure 3
Zonal cross sections showing seasonal climatological poleward dust aerosol flux (g m–2 day–1, logarithmic scale) for CAMSRA (upper panels) and MERRA-2 (lower panels). White lines show 50th (solid), 90th (dashed) and 99th (dotted) percentiles of vertically integrated flux (Mg deg–1 day–1, right axis). Orange lines show scale heights of dust flux (km, left axes).
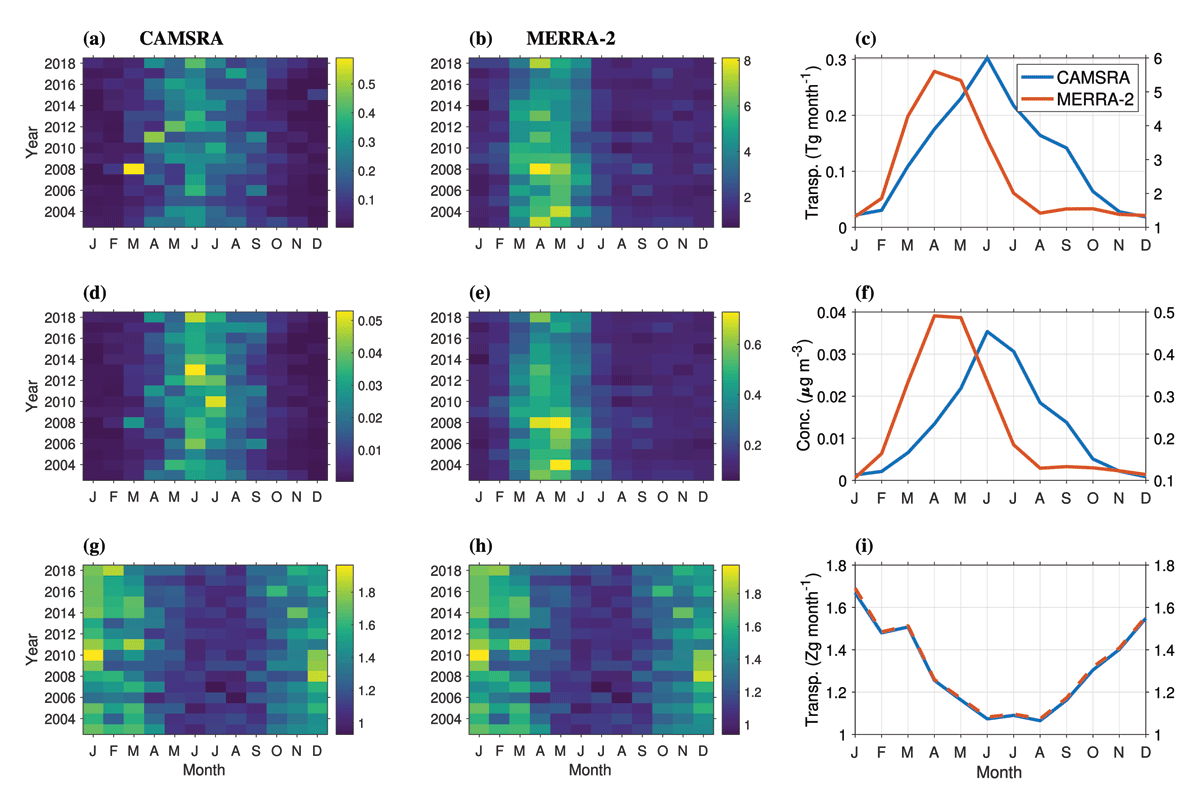
Figure 4
Integrated dust transport across 70° N (Tg month–1) for CAMSRA (a) and MERRA-2 (b). Monthly mean of integrated dust transport across 70° N (c), CAMSRA (blue line, left axis, MERRA-2 (red line, right axis). Mean concentration of dust at 70° N (μg m–3) for CAMSRA (d) and MERRA-2 (e). Monthly mean of dust concentration at 70° N (f), CAMSRA (blue line, left axis), MERRA-2 (red line, right axis). Integrated mass transport of air across 70° N (Zg month–1) for CAMSRA (g) and MERRA-2 (h). Monthly mean of integrated mass transport of air across 70° N for CAMSRA (blue line, left axis, MERRA-2 (red line, right axis). All monthly means are averaged over 2003–2018.
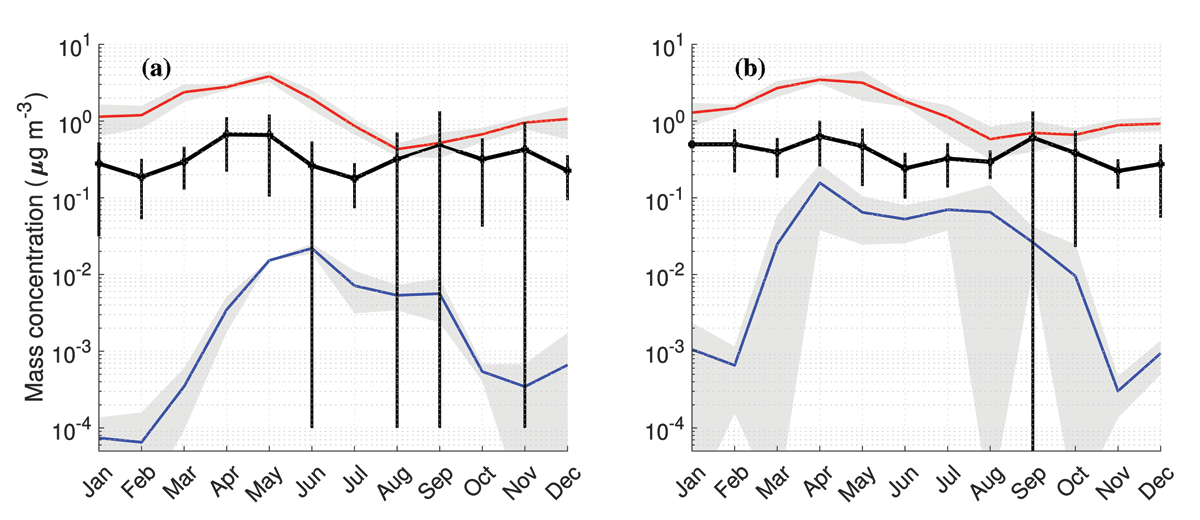
Figure 5
Monthly dust concentrations (μg m–3) at (a) Alert, Canada (82.28° N, 62.30° W) and (b) at Villum, Station Nord, Greenland (81.36° N, 16.40° W) from weekly filter samples (black line, vertical lines one standard deviation) averaged over 2000–2006 (a) and 2008–2012 in (b). Blue line (CAMSRA) and red line (MERRA-2) show monthly means of reanalysis concentrations (2003–2006).
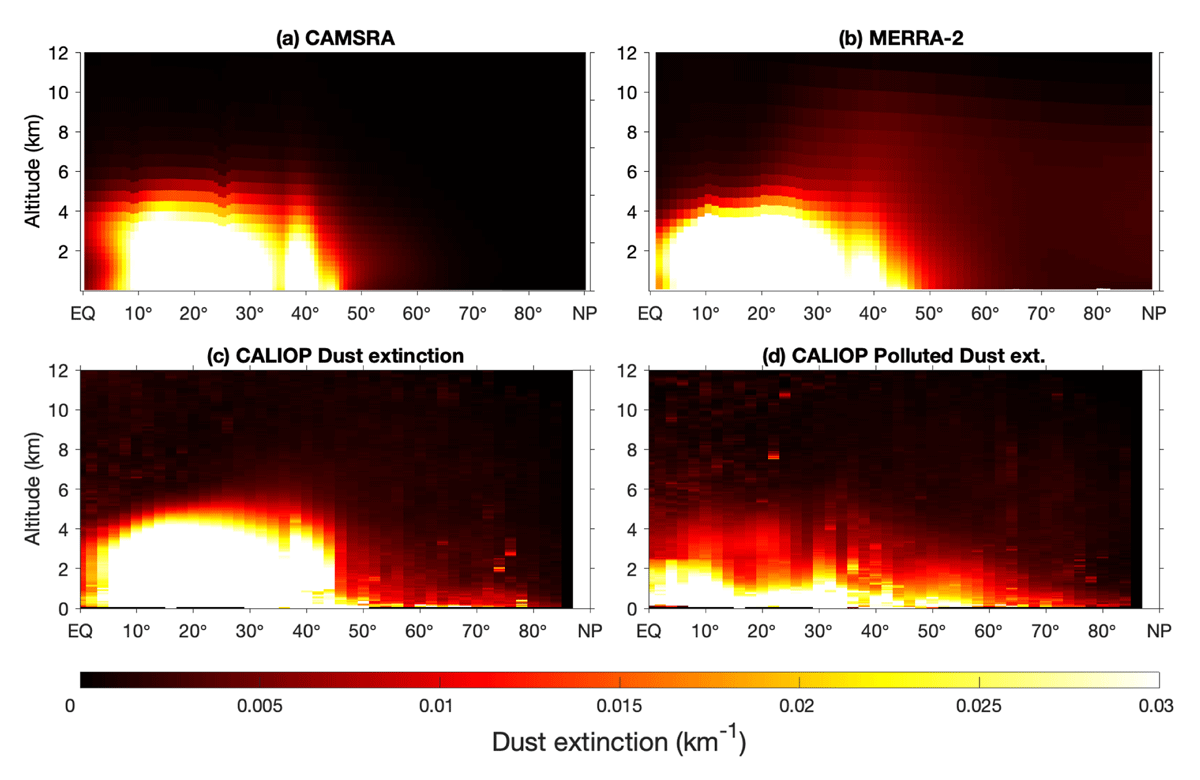
Figure 6
Zonal distribution of dust extinction for CAMSRA (a), MERRA-2 (b) and CALIOP (c & d). Mean values for 25° W to 90° E, MAM 2007–2016.
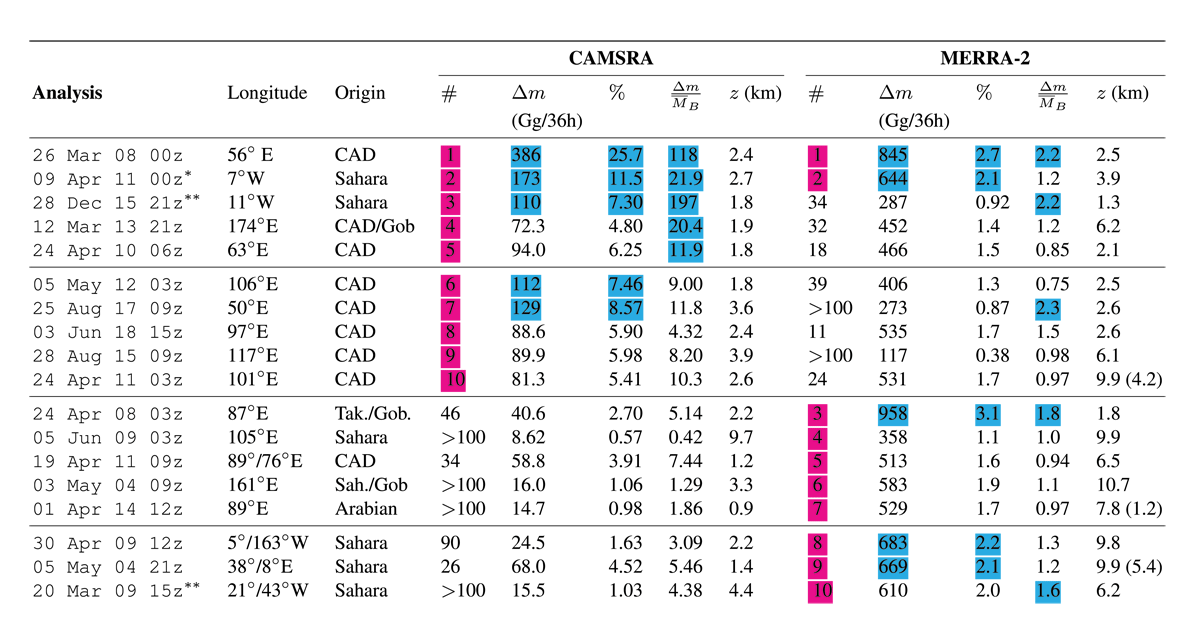
Table 2
The most extreme episodes of dust transport across 70° N according to CAMSRA and MERRA-2 (2003–2018). Headings explained from left to right: ranking number according to respective reanalysis (#), integrated mass transport of event (Δm), relative transport with respect to the annual mean (%) and with respect to the monthly climatological Arctic dust burden (∆(m/M̅B), altitude of flux maximum (z, values within brackets for secondary maxima). Two presented values of longitude indicate that the longitude of maximum poleward flux differs by more than 10° between the reanalyses (CAMSRA’s value to the left). The origin of the air is determined by computing HYSPLIT backward trajectories (Stein et al., 2015). The largest values according to each category are highlighted pink or blue.
*Event has previously been analyzed by Francis et al. (2019) and Varga et al. (2021).
**Event has previously been analyzed by Varga et al. (2021).
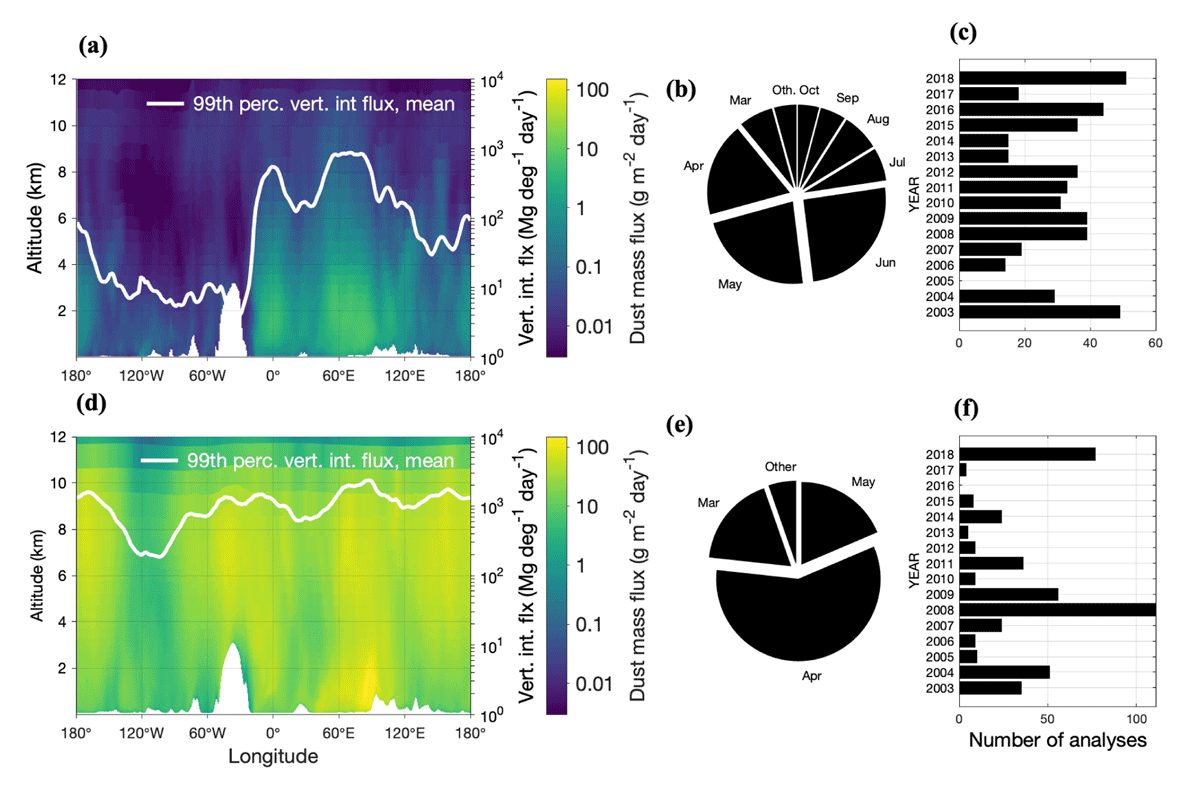
Figure 7
Mean value of 99th percentile dust mass flux (g m–2 day–1, logarithmic scale) across 70° N for CAMSRA (a) and MERRA-2 (b). Mean value of vertically integrated dust flux in the 99th percentile (White lines, Mg deg–1 day–1). Temporal distribution of the 99th percentile analyses (3-hourly time resolution) for CAMSRA (b–c) and MERRA-2 (e–f).