
1 Introduction
Mineral dust, one of the most abundant aerosols in the atmosphere, has multiple effects on the sensitive Arctic climate system. Airborne dust affects the radiation budget directly by scattering, absorbing and re-emitting radiation. It also affects the radiation budget indirectly by altering cloud properties: dust can act as cloud condensation nuclei (CCN) and it is an important ice-nucleating particle (INP) type in the Arctic, with high relevance for mixed-phase cloud formation (Prenni et al., 2009; Morrison et al., 2012; Costa et al., 2017; Schepanski, 2018; Tobo et al., 2019; Si et al., 2019; Sanchez-Marroquin et al., 2020). Once deposited on snow or ice, dust reduces the surface albedo, thereby contributing to the melting of ice and snow during the sunlit part of the year (Bond et al., 2013; Kylling et al., 2018; Dagsson-Waldhauserova and Meinander, 2019; Gunnarsson et al, 2021). Furthermore, dust influences the carbon cycle as it fertilizes oceans and enhances biological productivity (e.g. Mahowald et al., 2005; Baldo et al., 2020).
While some dust sources are anthropogenic (up to 25 %), the majority are not (Ginoux et al., 2012). Furthermore, dust is generally not affected by altered anthropogenic aerosol emissions (Samset et al., 2018). However, dust emissions can be indirectly affected by climate change, for example through desertification (Indoitu, 2015; Thomas and Nigam, 2018) or melting of the cryosphere (e.g. Meinander et al., 2022). The largest contribution to the global dust aerosol burden originates from North Africa and Asia, with estimated emissions of 400–2200 Tg yr–1 and 30–870 Tg yr–1, respectively (Huneeus et al., 2011). The origin of dust aerosols is not only large deserts; substantial local production occurs in ice-free and snow-free areas of Alaska, Iceland, Greenland, Svalbard, Siberia, Patagonia and Antarctica (e.g. Dagsson-Waldhauserova et al., 2014; Bullard et al., 2016; Tobo et al., 2019; Amino et al., 2021; Meinander et al., 2022), but the emissions are rather small. Dust emitted north of 50° N contributes to only around 1 % of the total global dust budget according to a recent study (Meinander et al., 2022), although earlier estimates have been larger (Bullard et al., 2016; Groot Zwaaftink et al., 2016).
Observational constraints on Arctic dust concentrations are limited and dust is not straight-forward to measure (Groot Zwaaftink et al., 2016). Analyses of dust distribution in snowpits sampled at the Penny Ice Cap, Nunavut, Canada, show two deposition maxima, one in spring and one in late summer/autumn with slightly coarser particles, indicating that local dust production can contribute significantly to the aerosol concentration during late summer/early autumn and that long-range transport is important for the aerosol concentrations outside of the summer/early autumn period (Zdanowicz et al., 1998). Similarly, INP measurements in Alert, Nunavut, Canada, indicate that both long-range transport and local production during summer contribute to the surface concentrations of dust in the Arctic (Fan, 2013). The origin of dust in the Arctic also varies with altitude, remote sources contribute more to dust concentrations at higher altitudes (e.g. Bory et al., 2003; Klonecki et al., 2003). Groot Zwaaftink et al. (2016) estimated that 38 % of the Arctic dust burden is sourced from Asia, 32 % from Africa and that 27 % is locally sourced. Shi et al. (2022) suggested a similar contribution from high latitude sources (31 %), but a larger contribution from Asia (44 %) and a lower contribution from Africa (24 %), whereas Breider et al. (2014) estimated that as much as 65 % of the Arctic dust burden was sourced in Sahara.
Stohl (2006) used a particle dispersion model to analyze aerosol transport into the Arctic and suggested three major pathways: (1) low-level transport followed by ascent in the Arctic, (2) low-level transport alone, and (3) uplift outside the Arctic, followed by descent in the Arctic. The second pathway is possible only from Europe and high-latitude Siberia during winter, when the air is cold enough to penetrate the Arctic lower troposphere, whereas the third pathway dominates the transport from North America and Asia (Klonecki et al., 2003; Stohl, 2006). While the dust component of the total aerosol has not been studied as comprehensively, several case studies have been made, examining single events of long-range transport into the Arctic. Unusual synoptic situations can potentially cause dust to travel from the Sahara across western Europe and the Atlantic into the Arctic (Franzén et al., 1994; Barkan and Alpert, 2008; Francis et al., 2019). Varga et al. (2021) studied Saharan dust transport more systematically, identifying two different types of synoptic patterns which defined two specific pathways for dust transport to Iceland: one route directly across the Atlantic Ocean and one across the western parts of Europe. Asian dust, sourced in the Gobi and Taklamakan deserts, can be transported and directed by the East Asia Trough to enter the Arctic across easternmost Russia and the Bering strait (Huang et al., 2015). This type of transport was further investigated by X. Zhao et al. (2022) which distinguished between two typical pathways, one more direct entering the Arctic mainly across the Kamchatka peninsula and one wavier pathway first directed by a high pressure ridge over eastern Russia and then by a low pressure system near the Bering Strait causing the dust to enter the Arctic east of the Bering Strait. Asian transport following such pathways has been claimed to potentially give a substantial contribution to the aerosol maximum in spring known as Arctic haze (Rahn et al., 1977; Mitchell, 1957). All these case studies give valuable insights into where and how dust transport to the Arctic can occur. However, they give little or no information on the statistics of the dust transport into the Arctic in terms of quantity, seasonality, spatial distribution or variability.
Here, we use a novel approach for investigating dust transport into the Arctic and take advantage of two three-dimensional reanalysis datasets of atmospheric composition, Copernicus Atmosphere Monitoring Service reanalysis (CAMSRA, Inness et al., 2019) and Modern-Era Retrospective Analysis for Research and Applications, version 2 (MERRA-2, Gelaro et al., 2017). We compute the dust mass transport into the Arctic, which throughout this study is defined as the area north of 70° N latitude. The instantaneous meridional mass flux, f, across a zonal vertical cross-section can be written as f(x,z,t) = v·c, where x, z and t are longitude, altitude and time respectively. v is the meridional component of the wind and c is the dust concentration. We restrict the mass flux to include only positive transport i.e. v>0 (except for when specifically computing the outflux). The vertically integrated dust flux from surface level to the top of the atmosphere, Φ(x,t), can then be computed as
which can be further integrated over x and t to give e.g. the monthly integrated flux into the Arctic region. Both reanalyses allow for a systematic and quantitative study over a time period long enough for statistical analysis (2003–2018). We examine if the reanalyses agree on where, when and how dust is transported into the Arctic and highlight similarities as well as differences. Additionally, we compare the reanalysis data both with ground measurements sampled in the Arctic and data from NASA’s Cloud-Aerosol Lidar and Infrared Pathfinder Satellite Observations (CALIPSO, Winker et al., 2009) to assess if one of the datasets is more realistic in terms of dust transport into the Arctic.
2 Data sources
This study is based on the two existing global reanalysis datasets of atmospheric composition that cover the period 2003–2018, CAMSRA and MERRA-2 (see Section 2.1 and 2.2). These two reanalyses are similar in several aspects; they both offer 3-dimensional, 3-hourly assimilated data of meteorological variables, chemical species and the same five types of externally mixed aerosols (dust, sea-salt, sulphate, organic matter and black carbon). Furthermore, they both assimilate aerosol optical depth (AOD) as the only source of aerosol information. Next follows a description of the individual datasets, with their main features presented in Table 1.
Table 1
Description of some dust physical characteristics for CAMSRA and MERRA-2.
| CAMSRA | MERRA-2 | |
|---|---|---|
| Assimilation system | IFS (CB05) cycle CY42R1, 4D-Var | GEOS-5 (ver 5.12.4), 3D-Var |
| Spatial resolution | 0.75° × 0.75°, 60L hybrid σ-p | 0.5° lat × 0.625° lon, 72L hybrid σ-p |
| Temporal resolution | 3-hourly 3D atmospheric analysis fields | 3-hourly 3D atmospheric analysis fields |
| Dust AOD assimilation | AATSR (2003–2012), MODIS (2003–) | AVHRR (1979–2002), MODIS (2000–), MISR (2000–2014), AERONET (1999–2014) |
| Aerosol module | IFS-AER (Rémy et al., 2019) | GOCART (Chin et al., 2002) |
| Size bins (μm) | 3 bins: 0.03–0.55, 0.55–0.90 and 0.90–20 | 5 bins: 0.1–1.0, 1.0–1.8, 1.8–3.0, 3.0–6.0, 6.0–10.0 |
| Mass fraction of dust emission (%) | 5, 12 and 83 | 6.6, 20.6, 22.8, 24.5 and 25.5 |
| Dust emission scheme | Ginoux et al. (2001) & Rémy et al. (2019), driven by 10 m wind adjusted for gustiness | Ginoux et al. (2001), driven by 10 m wind |
| Dust source | Dynamic. Sources linked to prognostic and diagnostic surface and near-surface variables. (Morcrette et al., 2008; Rémy et al., 2019) | Static. Potential dust source locations based on correleation of dust emitting regions with large-scale topographic depressions (Ginoux et al., 2001) |
2.1 Camsra
The Copernicus Atmosphere Monitoring Service reanalysis (CAMSRA) is produced by the European Centre for Medium-Range Weather Forecasting (ECMWF, Inness et al., 2019). The dataset is produced using four-dimensional variational analysis (4D-Var) in the cycle 42r1 of the ECMWF weather prediction model Integrated Forecast System (IFS, Benedetti et al., 2009). The spatial resolution of the dataset is approximately 80 km globally on 60 hybrid sigma-pressure (model) levels from the surface up to the model top at 0.1 hPa. The CAMSRA dataset is available from 2003 and onwards. Aerosols in CAMSRA are represented with the radiatively coupled aerosol module IFS-AER (Morcrette et al., 2008; Rémy et al., 2019). The assimilation system uses satellite retrievals of AOD from Envisat’s Advanced Along-Track Scanning Radiometer (AATSR) sensor during 2003–2012 and from the Moderate Resolution Imaging Spectroradiometer (MODIS) Aqua and Terra sensors for 2003–2018 (Inness et al., 2019) to update the modeled aerosol concentrations.
Aerosol dust is separated into three size bins, 0.03–0.55 (fine), 0.55–0.9 (coarse), and 0.9–20 (super coarse) μm spherical radius with a density of 2610 kg m–3 for all three dust bins (Rémy et al., 2019). Dust emissions are injected at the surface, then vertically distributed by the model’s convection and vertical diffusion scheme (Inness et al., 2019). The emission flux is parameterized following the formulation of Ginoux et al. (2001), albeit modified by adding a gustiness effect to the 10 m wind as the meteorological variable driving the dust emission (Rémy et al., 2019). The emissions are distributed as 5 % fine dust, 12 % coarse dust and 83 % super coarse dust. The areas likely to produce dust must satisfy the following criteria (Rémy et al., 2019):
– Surface albedo must be below 0.52
– The grid cell must be entirely composed of land
– The fraction of bare soil must be above 0.1
– No high vegetation and the fraction of low vegetation must be below 0.5
– No snow cover, ice, or wet skin
– The standard deviation of subgrid orography must be under 50 m.
The dust removal processes consist of wet and dry deposition and sedimentation or gravitational settling (Rémy et al., 2019). For our study, we retrieve temperature, mass mixing ratio of dust and meridional wind on all 60 model levels and the logarithm of surface pressure from the lowest level. The altitude, pressure and density corresponding to each model level are computed according to the IFS documentation1. Other variables retrieved are emission, sedimentation, dry deposition, wet deposition and vertically integrated mass of dust.
2.2 Merra-2
The Modern-Era Retrospective Analysis for Research and Applications, version 2 (MERRA-2) is provided by the NASA Global Modeling and Assimilation Office (GMAO). The dataset was produced using the Goddard Earth Observing System model version 5 with a three-dimensional variational data analysis algorithm (Gelaro et al., 2017). The spatial resolution of the data is 0.5° × 0.625° latitude by longitude on 72 hybrid sigma-pressure levels (model levels), from the surface up to 0.01 hPa. The temporal resolution is 3-hourly on model levels, but 1-hourly data is available for integrated vertical column variables. The MERRA-2 reanalysis is available from 1979 and is continually being extended onward in time.
MERRA-2 assimilates AOD data from the Aerosol Robotic Network (AERONET, 1999–2014), the Advanced Very High Resolution Radiometer (AVHRR, 1979–2002), MODIS (2000–present) and over bright surfaces (albedo > 0.15) also Multi-angle imaging Spectroradiometer (MISR, 2000–2014, Gelaro et al., 2017). Aerosols in MERRA-2 are simulated with a radiatively coupled version of the Goddard Chemistry, Aerosol, Radiation and Transport model (GOCART, Chin et al., 2002). The dust aerosols are separated into five size bins, 0.1–1.0, 1.0–1.8, 1.8–3.0, 3.0–6.0 and 6.0–10 μm in particle radius. Dust emissions are based on an observed correlation between dust emitting regions and topographic depressions, thus a static topographic depression source map is used to define the dust emission potential (Ginoux et al., 2001). The emissions, driven by the 10 m wind speed, are based on the parametrization of Marticorena and Bergametti (1995). The distribution of the mass emitted into the different size bins is 6.6, 20.6, 22.8, 24.5 and 25.5 %, respectively. The dust removal processes consist of dry deposition, sedimentation and wet deposition which is divided into large scale wet-removal and convective scavenging (Randles et al., 2017).
For our study, we retrieve dust mass mixing ratio, density and meridional wind on all 72 model levels. Surface level emission, sedimentation, dry deposition, wet deposition and vertically integrated mass of dust aerosol are also retrieved.
2.3 Limitations of AOD assimilation and known issues in CAMSRA and MERRA-2 of relevance for dust transport
Assimilation of AOD generally reduces the bias between simulated and observed aerosol properties (Benedetti et al., 2019; Buchard et al., 2017). However, there are limitations to the assimilation process. While the assimilated observations are retrievals of total AOD from various instruments (Table 1), the forecast models have 12 (CAMSRA) and 15 (MERRA-2) different aerosol variables. Therefore, an accurate representation of a certain aerosol type relies on that the forecast model manages to produce a correct partitioning between the aerosols, and the reanalysis product is ultimately dependent on the forecast model and its aerosol modules (Inness et al., 2019; Randles et al., 2017; Gueymard et al, 2020; A. Zhao et al., 2022). For instance, if the underlying aerosol module overestimates the production of one aerosol type, then its relative contribution to the total aerosol concentration will be too large. This bias may then be further enhanced by the assimilation process. Similarly, for aerosol components with a relatively long atmospheric residence time, the effect of the assimilation will be maintained for a longer time, which may produce a bias in the relative contributions of different aerosol types (Flemming et al., 2017).
Another limitation to consider is the conversion of dust mass concentrations into dust extinction. The dust extinction decreases substantially with increasing dust aerosol size (Randles et al., 2017). Hence, two diverging dust mass concentrations could yield a similar dust extinction and dust optical depth (DOD).
In both CAMSRA and MERRA-2, there are some known issues of relevance for long-range transport of dust. Errera et al. (2021) show that CAMSRA strongly underestimates the DOD in source regions and concentrations in remote areas are also too low. This issue is likely linked to the assimilation procedure that reinforces a model bias of too much organic matter at the expense of dust. In MERRA-2, excessive convective transport causes an overestimation of dust extinction in the upper troposphere — and a subsequent overprediction of the long-range dust transport (Ginoux et al., 2001; Buchard et al., 2017, Wu et al., 2020). In addition, the assimilation of AOD in MERRA-2 further increases the dust concentrations in remote regions (Wu et al., 2020).
2.4 Dust emissions in CAMSRA and MERRA-2
In both reanalyses, the major dust emitting areas are the Sahara, Arabian, Central Asian and the Gobi/Taklamakhan deserts (Figure 1). There are also emissions from deserts in North America, the Horn of Africa, India, Pakistan, Afghanistan, Iran, and Iraq. In contrast to CAMSRA, MERRA-2 has some minor dust sources in Southern Europe along the Mediterranean Sea while CAMSRA has minor sources at high latitudes in Alaska, the Canadian Arctic Archipelago and northern Russia. Overall, the reanalyses agree well on the major dust sources, although the procedure of localizing areas with a potential of emitting dust rests on fundamentally different approaches.
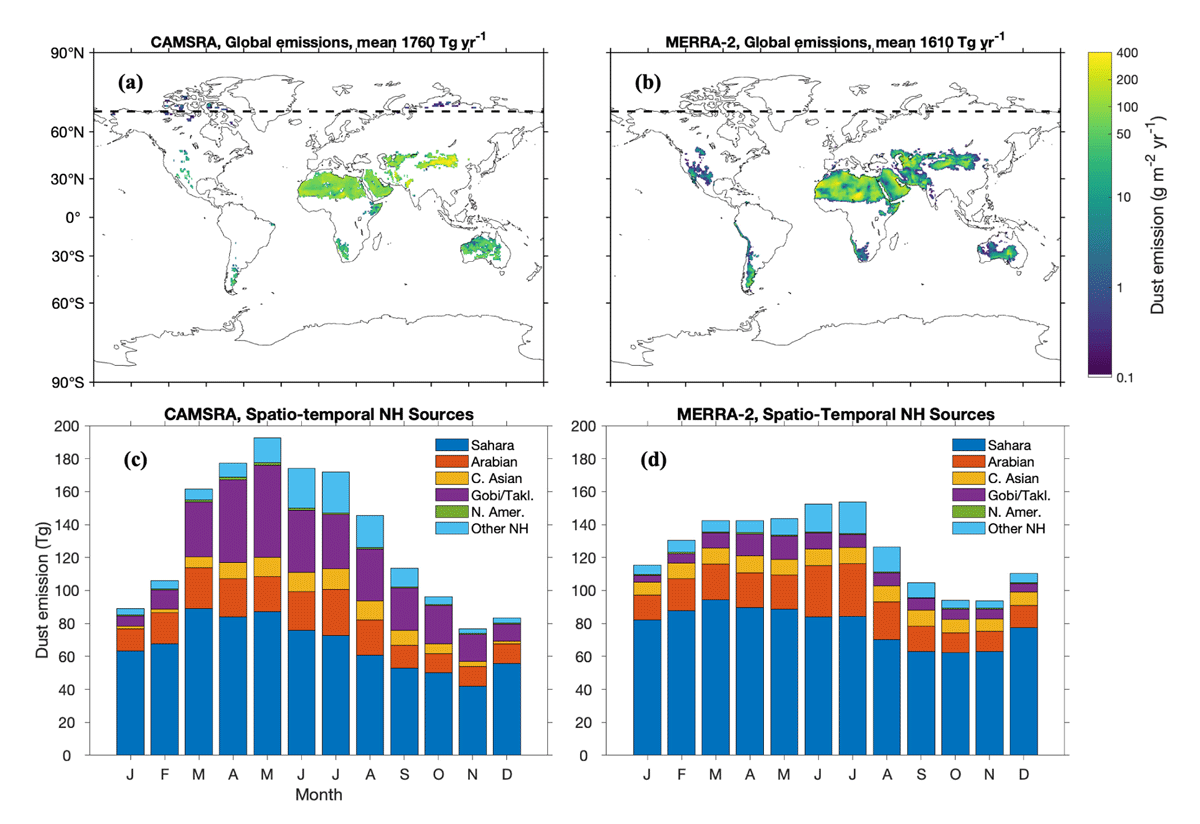
Figure 1
Global climatological (2003–2018) distribution of (a,b) dust emission fluxes (g m–2 yr–1, note the logarithmic scale) and (c,d) spatio-temporal distribution of the northern hemisphere dust sources (Tg Month–1) for CAMSRA (a,c) and MERRA-2 (b,d). The dashed line marks 70° N latitude (a,b).
However, within the main source regions, spatial variations are less prominent in CAMSRA than in MERRA-2. MODIS deep blue aerosol products, which display the frequency of occurrence of dust optical depth >0.2, show substantial spatial variability and high contrasts within the Sahara and Arabian desert regions (Ginoux et al., 2012; Rémy et al., 2019). In this respect, the MERRA-2 approach of defining dust emission potential agrees better with observations. On the other hand, the MERRA-2 parametrization has other shortcomings, e.g. no emissions north of 53° N latitude i.e. sources at high latitudes are absent despite that they have been identified in recent literature (e.g. Abbatt et al., 2019; Tobo et al., 2019; Meinander et al., 2022).
Both reanalyses show an overall seasonal dependence (Figure 2c, d), albeit less pronounced in MERRA-2, with maxima in the total emissions in spring and (early) summer and a minimum in late fall. The Sahara accounts for 54.9 % (800 Tg yr–1) and 67.8 % (947 Tg yr–1) of the Northern Hemisphere (NH) dust emissions for CAMSRA and MERRA-2, respectively, with emissions peaking in early spring. According to CAMSRA, the second largest contributor to the NH emissions is the Gobi and Taklamakan deserts with 334 Tg yr–1. The large emissions in CAMSRA can be ascribed to a relatively low lifting threshold wind speed assumed in this specific desert area (Rémy et al., 2019). In MERRA-2, the corresponding emission is 95 Tg yr–1 and both the Arabian and Central Asian deserts have higher emissions than the Gobi and Taklamakan.
2.5 Observations
2.5.1 Surface measurements
In-situ observations of aerosols in the Arctic are in general scarce and no long-term, direct measurements of dust concentrations are (to our knowledge) available. Filter samples of aluminum can provide an estimate of the dust concentration by assuming a mass ratio between the aluminum and total dust concentration. In the present study, we have used the conversion factor 7.1 % (Guieu et al., 2002; Fan, 2013; Barrie and Barrie, 1990), together with observed surface concentrations of aluminum from Alert, Canada (82.28° N, 62.30° W, Fan, 2013) and Villum, Greenland (81.36° N, 16.40° W, Nguyen et al., 2013).
2.5.2 CALIOP satellite retrievals
To evaluate the spatial, and in particular the vertical, distribution of dust aerosols in the reanalyses, we analysed 10 years (2007–2016) of retrievals from the Cloud-Aerosol Lidar with Orthogonal Polarization (CALIOP) sensor onboard NASA’s Cloud-Aerosol Lidar and Infrared Pathfinder Satellite Observations (CALIPSO) satellite (Winker et al., 2009, Winker et al., 2013). We used the combination of the standard Version 4.2, 5 km Aerosol Profile and Layer products (Young et al., 2018) to investigate the vertical extinctions as well as the tropospheric aerosol optical depths. The dust and polluted dust aerosols were identified using the aerosol typing information provided as a part of the vertical feature mask embedded in the data (Kim et al., 2018). We apply the following control criteria on the CALIOP data following Thomas et al. (2019; 2022). We use the retrievals when the Cloud-Aerosol Discrimination (CAD) Score is in the interval [–100,–20] and the extinction quality flag is set to zero, suggesting that the initial lidar ratio is unchanged and the retrieval converged successfully. We selected only those profiles where the total AOD was less than or equal to 3.0. The aerosol layers in the lowermost 100 m are removed due to possible ground clutter and high uncertainties (Tackett et al., 2018). Despite careful selection, misclassifications still occur; in the Arctic and pan-Arctic so-called diamond dust (wind-blown snow particles, thin ice fog or clouds) can sometimes be classified as dust aerosols. There is also a possibility of misclassifications during the pollen season and when the anthropogenic aerosols are well-mixed with the natural aerosols in the lowermost boundary layer, as their depolarization signal is in some cases similar to dust aerosols (Bohlmann et al., 2021). At present, there is no well validated method available to identify and correct for these misclassifications. Given that these situations are time and space limited and episodic, we believe that their impact on the large-scale statistical distributions of aerosol properties is also limited.
3 Results
3.1 Climatology of dust transport into the Arctic
3.1.1 Arctic dust budget
On a global scale, the dust emissions in the two reanalyses are of similar magnitude, albeit slightly higher in CAMSRA (1800 Tg yr–1) in comparison to MERRA-2 (1600 Tg yr–1, Figure 2). There is a discrepancy between the total deposition and emission flux in both reanalyses, which is a result of the assimilation of AOD (Errera et al., 2021; Wu et al., 2020); in CAMSRA the deposition is 8 % lower than the emission, whereas in MERRA-2 the deposition is 25 % higher than the emission. The global dust burden is nearly twice as large in MERRA-2 as in CAMSRA. In the Arctic, the difference is relatively even larger, with 27 times lower burden in CAMSRA than in MERRA-2. This difference is directly related to differences in transport, the dust flux across the Arctic border is 20 times lower in CAMSRA compared to MERRA-2. A substantial difference between the reanalyses is that CAMSRA has a local dust production in the Arctic, which is not the case in MERRA-2. During May–September, when local sources are active in CAMSRA, this emission contributes to about 21 % of the dust flux into the Arctic atmosphere. For the total annual flux, this local contribution is 15 %. Nonetheless, in absolute numbers, this local production appears modest. For the purpose of comparison, the annual dust emission in CAMSRA north of 60° N is 0.34 Tg, which is likely in the lower range, given that there are estimates of 4–40 Tg only from Icelandic sources (Arnalds et al., 2016; Groot Zwaaftink et al., 2017).
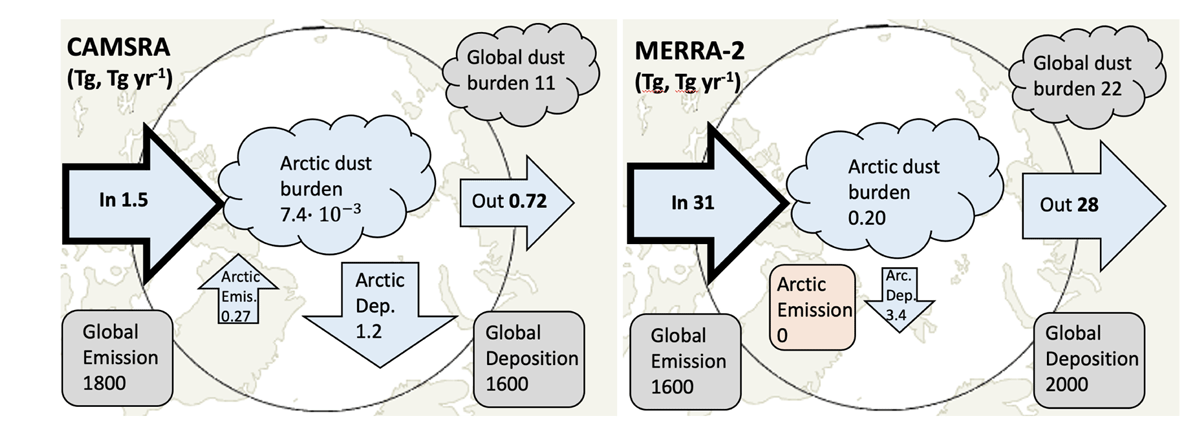
Figure 2
Arctic climatological (2003–2018) dust budget for CAMSRA (left) and MERRA-2 (right).
A considerably larger fraction of the dust transported into the Arctic remains in CAMSRA compared to MERRA-2; the fraction outflux/influx is 48 % (CAMSRA) and 88 % (MERRA-2), whereas the fraction Arctic deposition/influx is 81 % and 11 % for CAMSRA and MERRA-2, respectively. This may partly be due to the different transport altitudes; MERRA-2 transports a larger fraction of its dust at high altitudes (see Section 3.1.2), and therefore a significant fraction of the dust stays airborne until the air is transported out of the Arctic. The stable stratification that often caps the Arctic may also accentuate the difference between the reanalyses as the exchange between the upper and lower troposphere is small (Tjernström and Graversen, 2009; Stohl, 2006; Thomas et al., 2019). Different dust aerosol residence times is another factor that contributes to the differences; for CAMSRA the residence time is 2.4–2.6 days, whereas for MERRA-2 it is 4.1–5.1 days. Hence, a larger fraction of dust will be deposited in CAMSRA than in MERRA-2.
The reanalyses partition the dust differently, both with regard to size ranges and the number of bins, which does not facilitate comparisons of a particular size range (see Table 1). However, for the two smallest bins (0.03–0.9 μm), CAMSRA has a total NH emission of 270 Tg yr–1, while the emission in MERRA-2 is only 100 Tg yr–1 for the smallest aerosols (0.1–1.0 μm). Despite that the NH emission in CAMSRA is almost three times larger than in MERRA-2 for these sizes, the dust transport into the Arctic is eight times smaller in CAMSRA (0.77 Tg) than in MERRA-2 (6.1 Tg). For the larger ranges, i.e. 0.9–20 μm (CAMSRA) and 1.0–10 μm (MERRA-2), the emission in the reanalyses is similar, around 1500 Tg (slightly larger in CAMSRA). Nonetheless, the transport in CAMSRA is almost 35 times smaller than in MERRA-2. Hence, differences in dust size distributions cannot explain the substantial differences in transport. Rather, it is likely a matter of a stronger vertical transport overall in MERRA-2 (see Section 3.1.2).
3.1.2 Spatio-temporal distribution of dust transport
Figure 3 shows seasonal zonal cross sections along 70° N, illustrating the climatological (2003–2018) poleward dust fluxes. The fluxes in CAMSRA (Figure 3a-d) are in general substantially smaller than in MERRA-2 (Figure 3e–h), as also noted in Section 3.1.1. Both reanalyses have a relatively large transport at low altitudes (below 3km) across Europe and western Russia (20° W–90° E), with an agreement on a (global) maximum in the annual transport around 87–89° E. The transport in these areas shows seasonal variations, with the largest flux during spring or early summer in CAMSRA (Figure 3b–c), but already during winter and early spring in MERRA-2 (Figure 3e–f). In CAMSRA, notable transport at low altitudes also occurs across North America during JJA (Figure 3c). This flux is caused by local dust sources situated in the Canadian Arctic archipelago, but this feature is not seen in MERRA-2 as such high latitude sources are absent (see Section 2.4). For the purpose of comparing flux altitudes between the reanalyses, we define a scale height of dust transport, i.e. the altitude above ground level where the vertically integrated dust mass flux reaches the factor 1/e of the total flux (orange lines in Figure 3). As a consequence of the large flux at low altitudes across the area 20° W–90° E, the scale heights are relatively low in that region. MERRA-2 has lowest scale heights during winter (Figure 3e), particularly between 30°–90° E i.e. where there is a pronounced maximum at low altitude. Low-level transport across northern Eurasia during winter has previously been suggested to be important for general aerosol transport into the Arctic (Stohl, 2006); here most clearly MERRA-2 indicates that this pathway is also relevant specifically for dust.
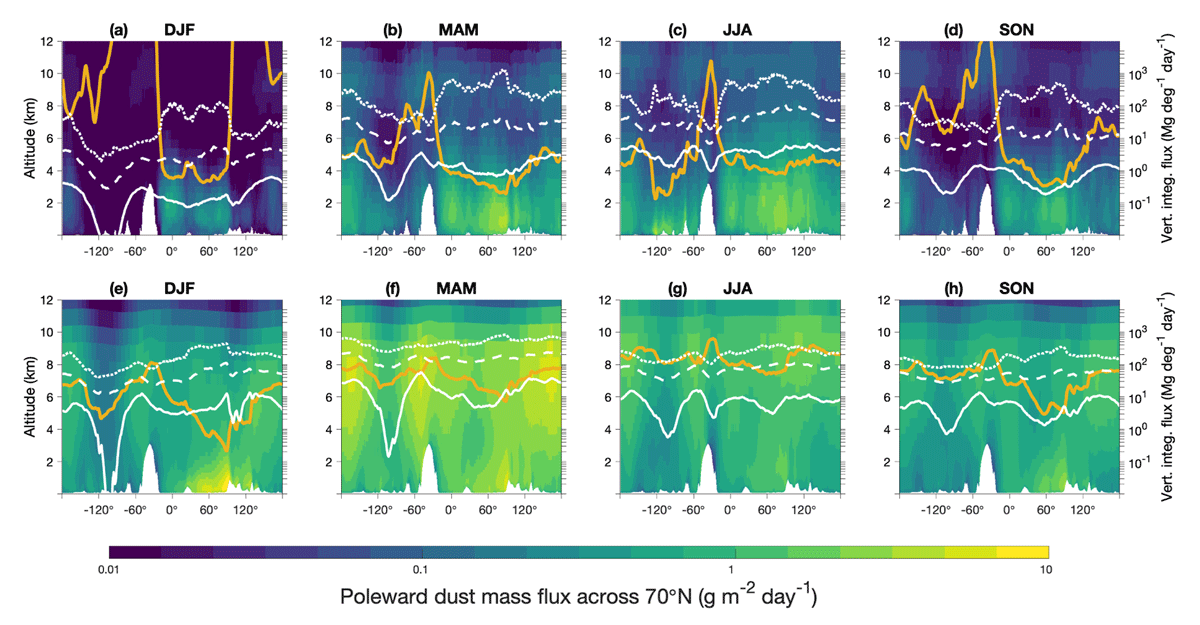
Figure 3
Zonal cross sections showing seasonal climatological poleward dust aerosol flux (g m–2 day–1, logarithmic scale) for CAMSRA (upper panels) and MERRA-2 (lower panels). White lines show 50th (solid), 90th (dashed) and 99th (dotted) percentiles of vertically integrated flux (Mg deg–1 day–1, right axis). Orange lines show scale heights of dust flux (km, left axes).
The dust transport in CAMSRA occurs at lower altitudes than in MERRA-2, with scale heights generally varying around 4–5 km, compared to 7–8 km for MERRA-2. The transport in CAMSRA is also less spread out and the scale heights show a larger topographical dependence. The reanalyses furthermore disagree on the inter-seasonal variations of scale height. In CAMSRA, the wintertime scale heights are generally higher than in summer. The large DJF scale height (Figure 3a) e.g. west of Greenland is caused by almost no poleward flux at low altitudes in combination with a weak poleward flux at high altitude. However, this flux at high altitude is likely overestimated, in large part due to the lack of effective removal processes for aerosols in the upper troposphere and lower stratosphere (Bozzo et al., 2020). In MERRA-2, the situation is the opposite with summertime scale heights being higher than during winter, following the seasonality of the vertical distribution of the dust concentration in the northern hemisphere source areas. During summer, convection reaches a maximum and efficiently transports the aerosols to high altitudes where they are subject to long-range transport (van der Does, 2018; Groot Zwaaftink et al., 2016). The potential influence of subarctic dust sources is of concern here, as no such (wintertime) emissions exist in the reanalyses. It is known that substantial dust emissions occur frequently during winter in Iceland and Alaska (Dagsson-Waldhauserova et al., 2019; Crusius, 2021), which likely influences the altitude of the dust flux into the Arctic as the dust from subarctic sources can reach up to 6 km height.
Next, we investigate the monthly integrated poleward dust transport across 70° N. Both reanalyses show a clear seasonal pattern, with relatively low values during fall and winter, followed by an increased transport that peaks in spring (MERRA-2) and early summer (CAMSRA), see Figure 4a–c). In CAMSRA (Figure 4a), the transport generally peaks in June but some notable cases with large transport can be found outside this month, e.g. in March 2008, April 2011 and December 2015. In MERRA-2 (Figure 4b), the transport peaks already in April — coincident with the Saharan emission peak (Figure 1) and with the seasonal maximum in Arctic DOD (Xie et al., 2022). Furthermore, MERRA-2 does not display a particularly large transport for March 2008 & April 2011 as seen in CAMSRA and the seasonal variations are relatively smaller in MERRA-2 than in CAMSRA (Figure 4c). CAMSRA has a distinct minimum in Dec–Jan, whereas in MERRA-2 the transport is instead relatively low from August to February (Figure 4c).
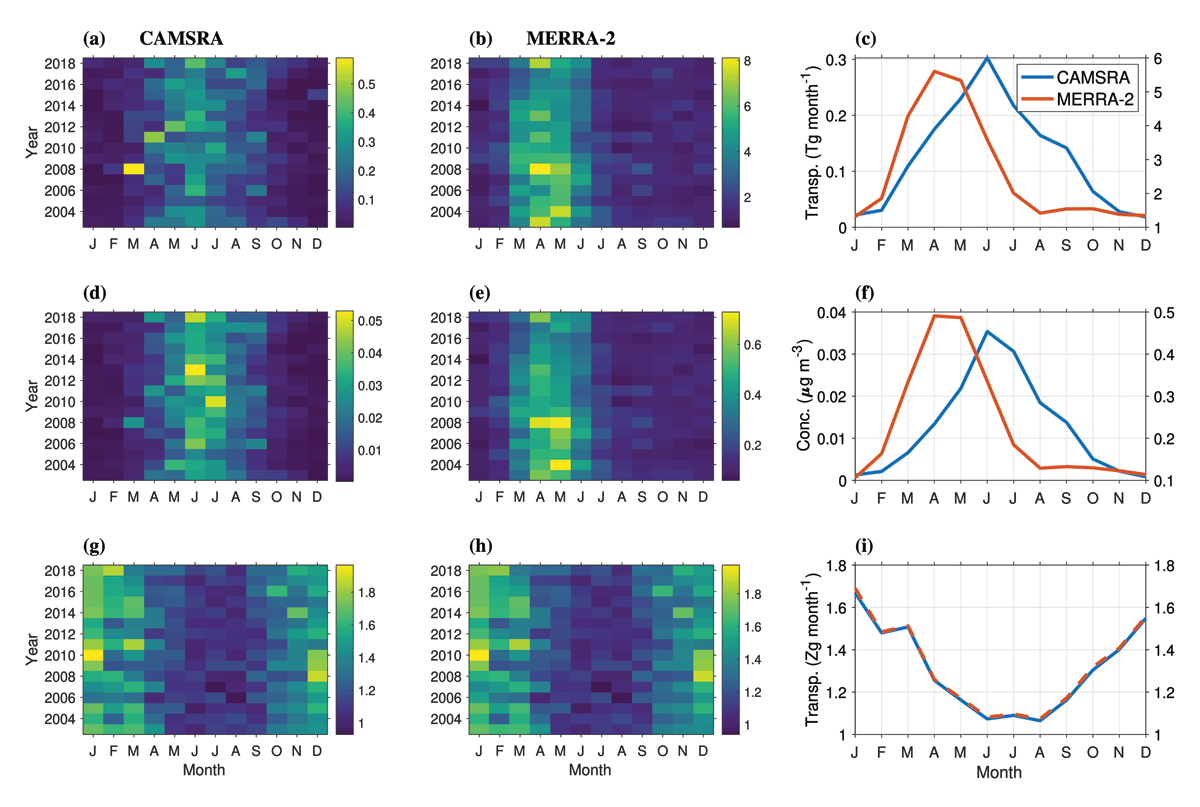
Figure 4
Integrated dust transport across 70° N (Tg month–1) for CAMSRA (a) and MERRA-2 (b). Monthly mean of integrated dust transport across 70° N (c), CAMSRA (blue line, left axis, MERRA-2 (red line, right axis). Mean concentration of dust at 70° N (μg m–3) for CAMSRA (d) and MERRA-2 (e). Monthly mean of dust concentration at 70° N (f), CAMSRA (blue line, left axis), MERRA-2 (red line, right axis). Integrated mass transport of air across 70° N (Zg month–1) for CAMSRA (g) and MERRA-2 (h). Monthly mean of integrated mass transport of air across 70° N for CAMSRA (blue line, left axis, MERRA-2 (red line, right axis). All monthly means are averaged over 2003–2018.
The monthly mean dust concentrations at 70° N (Figure 4d–f) resemble the patterns of the dust transport across 70° N (a-c) indicating that differences in dust concentrations explain the differences in transport between CAMSRA and MERRA-2. In contrast, the monthly integrated poleward transport of air across 70° N (Figure 4g–i) is approximately inverse to the seasonality of the dust transport; it peaks during winter and reaches a minimum during JJA. We note that this seasonality (Figure 4g–i), is consistent e.g. with the large emission of dust occurring in the Southern parts of Iceland during winter (Dagsson-Waldhauserova et al., 2014) — but these dust sources are not included in the reanalyses. The correlation coefficient of monthly integrated air mass transport between the reanalyses is r = 0.997 (r = 0.985 for 3-hourly data). This result confirms that differences in Arctic dust transport between the reanalyses cannot be ascribed to differences in circulation at 70° N but are rather mainly a consequence of different aerosol concentrations. Moreover, MERRA-2 has a strong correlation between the 3-hourly poleward flux of air mass and dust. For instance, for the month of May r = 0.76 (MERRA-2) compared to only r = 0.015 (CAMSRA). The strong correlation in MERRA-2 could be attributed to persistent high concentrations of dust; when air moves poleward across 70° N, dust transport is probable.
3.1.3 Comparison between reanalysis data and observations
The annual cycles of dust concentration at two sites in the high Arctic, Alert and Villum Station Nord, are compared with reanalysis dust concentrations at the lowest model layer in Figure 5. It is clear that CAMSRA consistently underestimates the observed concentrations while MERRA-2 overestimates the concentrations at both sites. The discrepancy spans over several orders of magnitude, with the largest difference occurring during winter when the abundance of dust is low in general. There is a tendency of a bimodal distribution in both CAMSRA and in the observations, but the timing does not agree, showing a slightly too late peak in spring in Alert and a too early peak in fall in Villum. CAMSRA also shows a too large variability between the seasons compared to the observations, with winter values being too low. MERRA-2 captures the spring peak quite well, but does not display a maximum in fall — likely because of absent local sources at high latitudes.
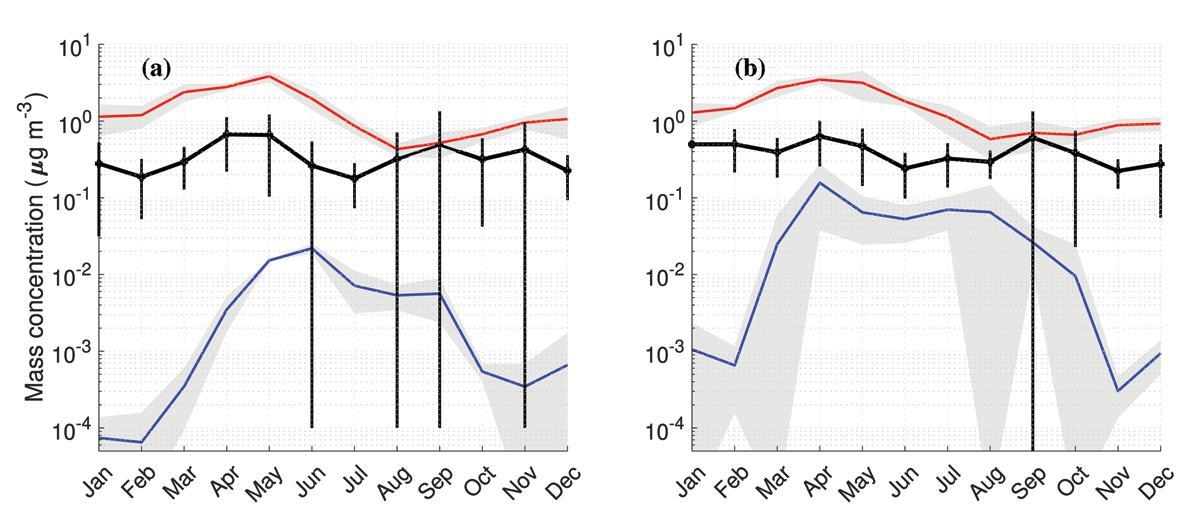
Figure 5
Monthly dust concentrations (μg m–3) at (a) Alert, Canada (82.28° N, 62.30° W) and (b) at Villum, Station Nord, Greenland (81.36° N, 16.40° W) from weekly filter samples (black line, vertical lines one standard deviation) averaged over 2000–2006 (a) and 2008–2012 in (b). Blue line (CAMSRA) and red line (MERRA-2) show monthly means of reanalysis concentrations (2003–2006).
The observed concentrations must be interpreted with caution, as there might be an anthropogenic contribution to the atmospheric aluminum concentrations (Hashimoto et al., 1992). At Villum, the anthropogenic contribution has been estimated to contribute with up to 50 % of the mass, thus the estimated dust concentrations are likely an overestimation (Nguyen et al., 2013). Ground level concentrations can also differ substantially from concentrations aloft, especially in the Arctic where ground inversions are frequent and multiple aerosol layers can occur (e.g. Pacyna and Ottar, 1988; Devasthale et al., 2011; Thomas et al., 2019). Nevertheless, the differences between the observational estimates and the reanalyses are considerable.
It is worth noting that the Arctic age of air i.e. the time that air has resided north of 70° N in the lowest 100 m of this Arctic sector is on average more than one week (Stohl, 2006). Therefore, long-range transported dust sampled in air at both Alert and Villum has been subjected to deposition for a week or more longer than air at the Arctic border, where we evaluate the transport. As CAMSRA has shorter dust aerosol residence time (2.4–2.6 days) than MERRA-2 (4.1–5.1 days), the discrepancies between the reanalysis dust concentrations can be expected to be lower at 70° N than in the high Arctic, where Alert and Villum are located.
Figure 6 compares the mean zonal distribution of dust extinction for CAMSRA, MERRA-2 and CALIOP. The extinction is averaged over the sector 25° W–90° E, thereby covering the major source regions and common dust transport pathways. We choose to analyze the extinction during March–May, when both emissions and transport are substantial (Figures 1, 3, 4, 7 and Table 2). To transform the reanalysis dust mass concentration to dust extinction, we use mass extinction coefficients from the CAMSRA dataset documentation2 and from Randles et al. (2017) for MERRA-2. According to CALIOP, the largest extinction is found south of 45° N, i.e. where the main dust source areas are located. In these areas there is a sharp gradient aloft and the extinction declines fast above ~4 km altitude. North of 45° N, the extinction is low and restricted to the lowest 1–2 km. The distributions of dust extinction in CAMSRA and MERRA-2 partially resembles that retrieved by CALIOP: the area of largest extinction has a similar meridional extent, with rapidly decreasing values poleward of 45°–60° N and rapidly decreasing values with height above 4–5 km. In MERRA-2, however, the vertical transport (around 40° N) and the poleward transport of dust aloft is stronger than what is indicated by CALIOP. Around 70° N, where we evaluate the dust transport into the Arctic (Figure 3), the extinction values are substantially lower in CAMSRA than in CALIOP. In MERRA-2 the extinction values are higher than retrieved by CALIOP above 3 km altitude, but lower than CALIOP below that. North of 70° N, MERRA-2 extinction values increase slightly poleward. This feature is not seen in CALIOP. Moreover, it is noteworthy that CALIOP indicates the presence of dust sources north of ~50° N. These are not represented in the reanalyses (see also Figure 1a, b).
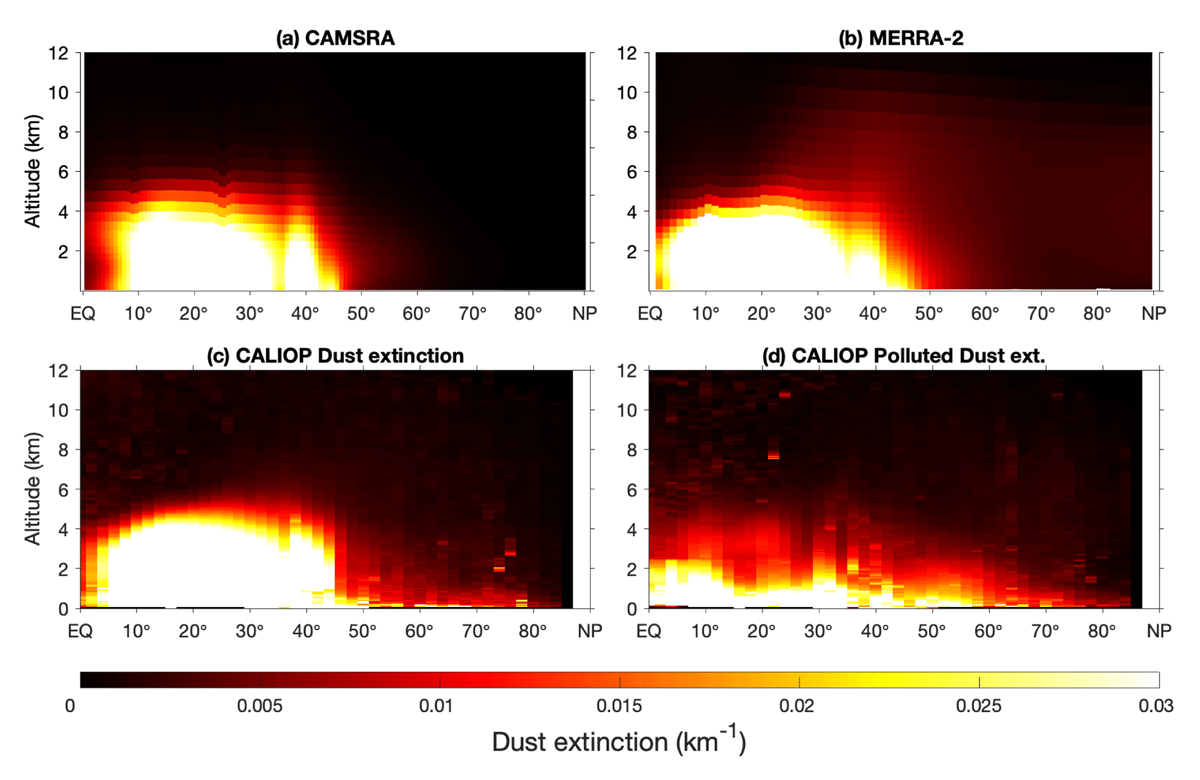
Figure 6
Zonal distribution of dust extinction for CAMSRA (a), MERRA-2 (b) and CALIOP (c & d). Mean values for 25° W to 90° E, MAM 2007–2016.
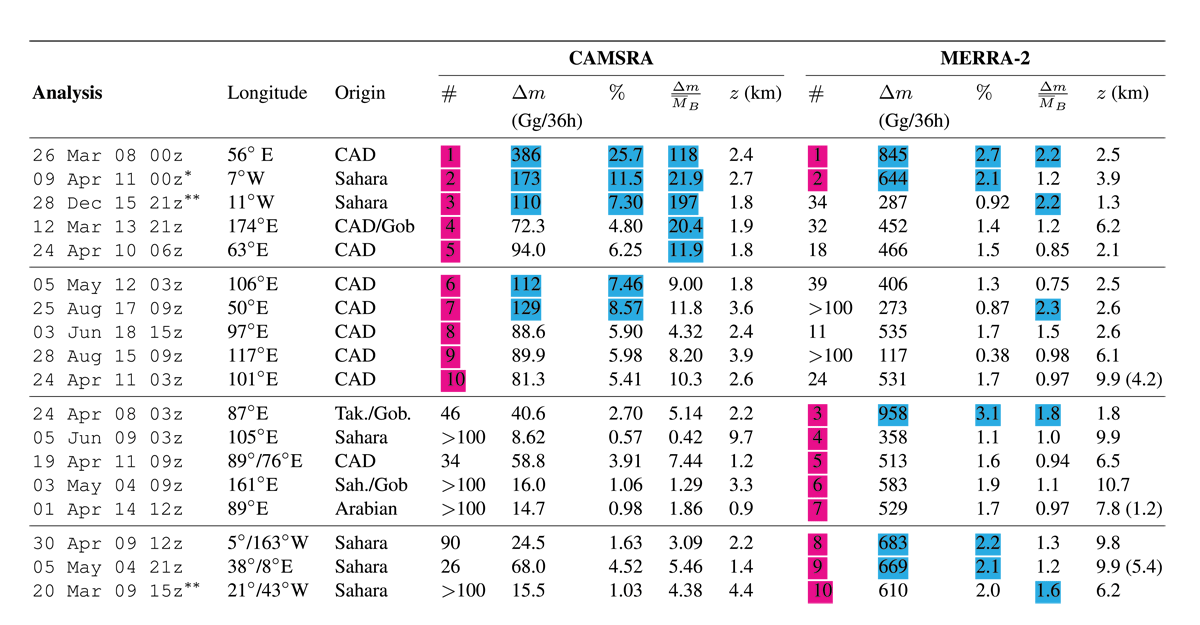
Table 2
The most extreme episodes of dust transport across 70° N according to CAMSRA and MERRA-2 (2003–2018). Headings explained from left to right: ranking number according to respective reanalysis (#), integrated mass transport of event (Δm), relative transport with respect to the annual mean (%) and with respect to the monthly climatological Arctic dust burden (∆(m/M̅B), altitude of flux maximum (z, values within brackets for secondary maxima). Two presented values of longitude indicate that the longitude of maximum poleward flux differs by more than 10° between the reanalyses (CAMSRA’s value to the left). The origin of the air is determined by computing HYSPLIT backward trajectories (Stein et al., 2015). The largest values according to each category are highlighted pink or blue.
*Event has previously been analyzed by Francis et al. (2019) and Varga et al. (2021).
**Event has previously been analyzed by Varga et al. (2021).
CALIOP also provides retrievals of polluted dust i.e. dust mixed with anthropogenic pollution and smoke from biomass burning (Figure 6d). The reanalyses has no equivalent variable to polluted dust, as the aerosols are treated as externally mixed (Inness et al., 2019; Gelaro et al., 2017). A comparison between the distribution of polluted dust and the distribution of dust shows that polluted dust has a shallower and meridionally more widespread distribution than dust. Therefore, polluted dust does not add any complementary information that substantially can help to explain the differences between the CALIOP distribution of dust and the reanalyses.
3.2 Extreme dust flux into the Arctic
3.2.1 Spatio-temporal variability
We now investigate in more detail the temporal variability in the dust transport to the Arctic in the two reanalyses. Figure 3 (a–h) indicates that the dust transport to a high degree is driven by episodic dust events as there is a considerable range between the lines showing the percentiles of vertically integrated flux. In CAMSRA (a–d), the 99th percentile of the vertically integrated flux can exceed 103 Mg deg–1 day–1 for some seasons and areas, while the median in the same areas fluctuate around 1 Mg deg–1 day–1. Furthermore, the integrated transport in the 99th percentile contributes to more than 15 % of the total transport while the transport in the 90th percentile constitutes 50 % of the total. In MERRA-2, dust transport is less variable; the 99th and 90th percentile transport contribute to 4.5 % and 28 % of the total dust transport. This feature of transport is illustrated by the smaller separation between lines of percentiles in comparison to CAMSRA (Figure 3).
To further investigate the extremes that drive a large part of the transport, we analyze the spatio-temporal distribution of the 99th percentile flux for both datasets (Figure 7). This percentile consists of 468 (3-hourly) analyses of the largest integrated flux, adding up to a total time of almost two months out of the 16-year analysis period. The two reanalyses agree on that the largest extreme transport occurs across western Russia (40° E–90° E) and also that the transport across the Atlantic is substantial. This agreement is particularly good at low altitudes, below 2–3 km above ground level. They also agree on a maximum over easternmost Russia and the Bering Strait (170° E–170° W), although this maximum is more prominent in MERRA-2. A cause for this difference might be the relatively short residence time in CAMSRA in combination with the relatively long transport distance from the closest source region (Gobi and Taklamakan) to the Bering Strait. Furthermore, Figure 7 (a, d) show some general similaritites with the climatologies of dust transport (Figure 3); CAMSRA has less spread out transport with essentially less transport located at high altitudes compared to MERRA-2. The 99th percentile transport occurs mainly in spring and early summer, albeit slightly later in CAMSRA (Apr–Jun, Figure 7b) than in MERRA-2 (Mar–May, Figure 7e) in agreement with Figure 4 (a and b). In CAMSRA, the 99th percentile flux has contributions from every month throughout the year, while in MERRA-2 there is none from the period Jul–Nov — despite that the total emission peaks in July in the NH in MERRA-2 (Figure 1). It is noteworthy that the climatological July transport in CAMSRA is 24 % larger than that of April despite the fact that April contributes more to the 99th percentile transport than July does (Figure 7c). This could be explained by the higher variability in April; the relative standard deviation (RSD) of monthly integrated flux is RSDApr = 3.8 % in contrast to RSDJul = 1.9 % for July. The relatively low variability in July could to some extent be explained by active sources at high latitudes giving rise to a substantial and more continuous transport.
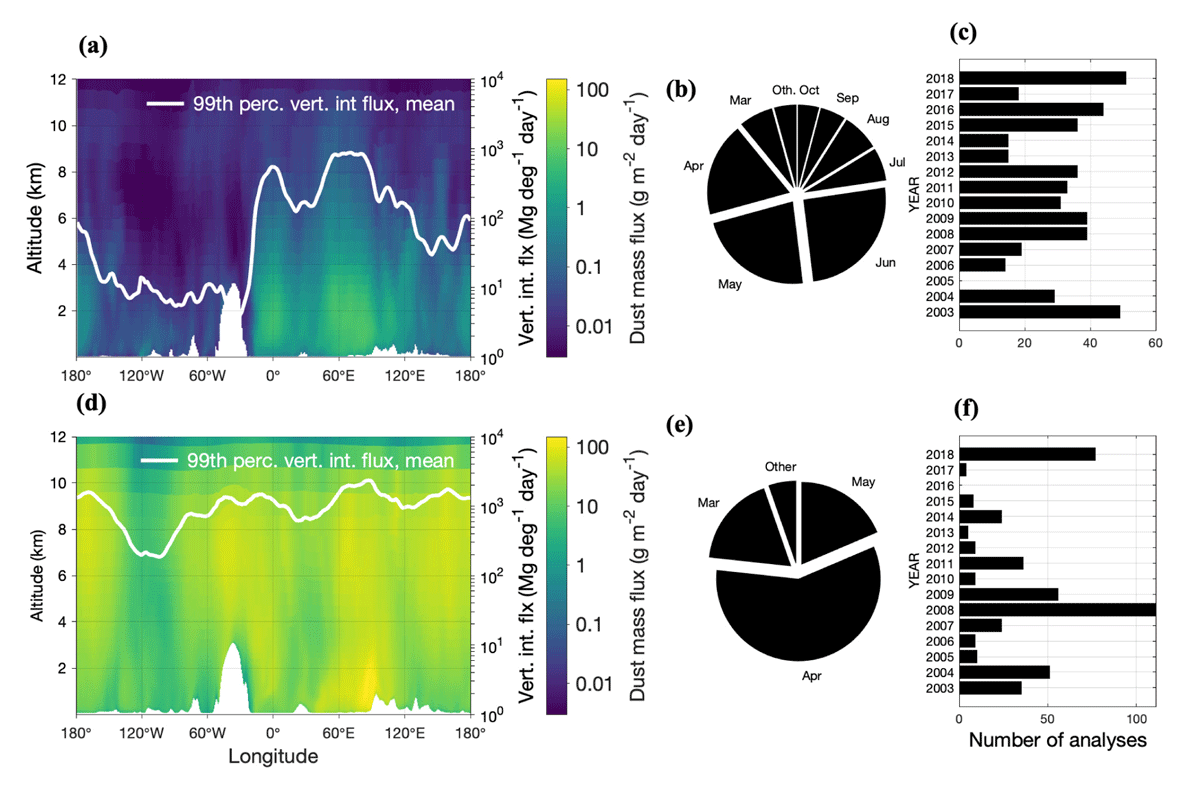
Figure 7
Mean value of 99th percentile dust mass flux (g m–2 day–1, logarithmic scale) across 70° N for CAMSRA (a) and MERRA-2 (b). Mean value of vertically integrated dust flux in the 99th percentile (White lines, Mg deg–1 day–1). Temporal distribution of the 99th percentile analyses (3-hourly time resolution) for CAMSRA (b–c) and MERRA-2 (e–f).
Extreme transport occurs almost every year in both reanalyses (Figure 7d, f), however, there is a general disagreement on the distribution between years. In CAMSRA the years 2003 and 2018 stand out for their relatively large contribution, whereas 2005 stand out for not contributing at all. As mentioned earlier, the year 2005 has a low transport overall in CAMSRA (Figure 4a). In MERRA-2, 2008 and 2018 stand out for their large transport, while 2016, commented earlier for its low transport, does not contribute at all to the most extreme transport (Figure 7f).
3.2.2 Episodes of extreme transport
The 3-hourly analyses of the 99th percentile of integrated dust flux are all components of specific synoptic situations with enhanced dust transport into the Arctic. Following this, we identify the ten most extreme episodes of dust transport (2003–2018) in the reanalyses and investigate if the two reanalyses give consistent results. We define an episode of extreme transport to be the 36h period of maximum integrated flux enclosing the particular 3-hourly analysis. Table 2 shows that CAMSRA and MERRA-2 only agree on the top two events — thus underscoring the significance of these. Episode #1 (26 Mar 2008), originating from the Central Asian deserts (CAD), transported more than 25 % of the annual mean mass transport according to CAMSRA, whereas the fraction is only 2.7 % in MERRA-2. According to CAMSRA, the transported mass during that episode, Δm, is more than 100 times larger than the climatological monthly Arctic dust burden, whereas in MERRA-2 the transported mass is around twice as large as the climatological monthly Arctic dust burden. The results once again show that the CAMSRA transport to a higher degree than MERRA-2 is driven by episodes of anomalously large transport, rather than by a continuous transport associated with high background concentrations. Also, if we consider the integrated mass transport of the 10 most extreme episodes, it constitutes 6 % of the total integrated dust transport 2003–2018 in CAMSRA, whereas the corresponding value for MERRA-2 is only 1 %. Furthermore, outside of the main period of transport, when the Arctic dust burden is low, the relative impact becomes large. In event #3 (29 Dec 2015, origin Sahara), the transported dust mass into the Arctic in CAMSRA is almost 200 times larger than the climatological monthly Arctic dust burden. However, this value is probably an overestimate caused by CAMSRA’s low dust concentrations in the Arctic during winter (Figure 5).
Table 2 reveals that the origin of the dust varies among the primary episodes of extreme transport, eight of the largest ten episodes identified by CAMSRA originate from the Central Asian deserts, while only three of the ten largest identified by MERRA-2 originate from the same region — instead Sahara is the dominating origin (six of ten episodes). As a consequence of the shorter residence time in CAMSRA, proximal deserts, such as the Central Asian (northern) deserts, are more frequently the source areas. In MERRA-2, an efficient vertical transport and the higher relative emissions from Sahara (see Section 2.4) may partly explain the dominance of the Saharan source. Moreover, these biases are enhanced along the routes northward due to the assimilation (see Section 2).
Table 2 also shows that the altitude of the transport differs between the two reanalyses. For the events #1–10, the mean altitude of maximum flux is 2.5 and 6.9 km in CAMSRA and MERRA-2 respectively. Clearly, the most favorable pathways for efficient dust transport are different between the reanalyses, causing disagreement between CAMSRA and MERRA-2 on which individual episodes that account for the greater mass transport.
It is difficult to use CALIOP data to evaluate the performance of the reanalyses for the different dust events. For instance, the CALIOP track may not intersect with the specific dust event, or CALIOP may observe a dust layer at a slightly different altitude or longitude than the reanalyses. However, a visual comparison with CALIOP data confirms that elevated dust concentrations are generally present during the extreme dust episodes identified by CAMSRA and MERRA-2.
4 Discussion
The reanalyses show considerable differences regarding the dust transport into the Arctic despite a comparable size of the NH emissions and an almost identical meridional circulation that drives the transport into the Arctic. In CAMSRA, the dust transport is significantly smaller, more limited and distinct in space, and occurs at lower altitudes than in MERRA-2 (see Section 3.1.2). Several factors can explain the overall difference between the reanalyses. In CAMSRA, DOD is strongly underestimated in the source areas and the assimilation process in CAMSRA consistently assimilates too much organic matter at the expense of dust (Errera et al., 2021). This leads to an underestimation of dust concentrations in remote areas. Furthermore, MERRA-2 likely overestimates the convective transport, which allows for the particles to be transported over larger areas (Ginoux et al., 2001; Buchard et al., 2017; Wu et al., 2020). Moreover, the assimilation of AOD increases dust concentrations in remote areas and prolongs the residence time of dust (Figure 2 & Wu et al., 2020). Altogether, these biases have additive effects, thereby they tend to increase differences between the datasets in remote areas such as the Arctic; the concentration in CAMSRA becomes (too) low and in MERRA-2 (too) high.
Different dust size distributions between the reanalyses cannot explain the discrepancy in transport into the Arctic. The reanalyses partition the dust aerosols differently, making a direct comparison difficult. However, CAMSRA has around three times larger NH production of fine dust (0.03–0.9 μm) than MERRA-2 (0.1–1.0 μm). Nevertheless, the transport of fine dust into the Arctic in CAMSRA is eight times smaller than in MERRA-2. For the larger particles (0.9–20 μm, CAMSRA; 1.0–10 μm, MERRA-2), the NH emission is similar between the reanalyses, but the transport into the Arctic is 35 times smaller in CAMSRA than in MERRA-2 — therefore, differences in dust size distributions do not explain the substantial differences in transport. The emission of fine dust is substantially larger in CAMSRA than in MERRA-2. But the CAMSRA size distribution is adjusted to ensure that the dust is coarse enough (Rémy et al., 2019; Kok, 2011).
Our study indicates that MERRA-2 has significantly larger concentrations and transport at high altitudes in comparison with both CAMSRA and independent (i.e. non-assimilated) CALIOP data (Figure 6). This result is consistent with Wu et al. (2020) who showed that MERRA-2 has a persistent high model bias of dust extinction in the upper troposphere at many locations around the globe as well as with Winker et al. (2010) who found a stronger vertical and poleward dust transport in GEOS-5/GOCART than in CALIOP. Furthermore, MERRA-2 also overestimates observed dust concentrations at the surface in the Arctic (Figure 5) — which is notable considering that the derived dust concentrations might be overestimated (Nguyen et al., 2013). Furthermore, MERRA-2 disregards high latitude dust sources which should lead to a local underestimate of dust concentrations in subarctic areas where emissions are known to be considerable (Zamora et al., 2022). For instance, the annual dust emission only in Iceland is estimated to be of comparable magnitude to the dust transport into the Arctic in the reanalyses, 4–40 Tg yr–1 compared to 1.5–31 Tg yr–1 respectively (Arnalds et al., 2016; Groot Zwaaftink et al., 2017). Nonetheless, and despite that the global dust emission in MERRA-2 is only half as large as that of the CMIP6 multimodel mean (MEM, A. Zhao et al., 2022), the dust burden in the Arctic (> 70° N) is more than a factor of two larger than that of the CMIP6 MEM — revealing that MERRA-2 has an unusually strong poleward transport when compared to the most recent generation of Earth system models. Taken together, the annual transport of 31 Tg yr–1 in MERRA-2 should be considered as an upper range of the possible long-range dust transport into the Arctic. For CAMSRA, the present study indicates that the extinction at 70° N instead is too low and that the transport is likely underestimated (Figures 5 and 6). Thus, the annual transport of 1.5 Tg yr–1 should be regarded as a lower limit of the annual dust transport into the Arctic.
The advantages of using reanalysis datasets for this type of study is that we can both quantify the transport of mineral dust into the Arctic and analyze the spatio-temporal distribution. Nonetheless, uncertainties in the reanalysis (dust aerosol) data are considerable and one might ask which one of the reanalyses is the more realistic with respect to dust transport into the Arctic. However, this is a complex question and needs to be answered from different perspectives; for example CAMSRA is more realistic regarding dust production at high latitudes (see Section 3.1.1), as the contribution to the Arctic dust burden can be significant and affect the seasonality of the dust flux into the Arctic (e.g. Dagsson-Waldhauserova et al., 2014; Bullard et al., 2016; Groot Zwaaftink et al., 2016; Kylling et al., 2018; Tobo et al., 2019; Abbatt et al., 2019; Dagsson-Waldhauserova et al., 2019; Meinander et al., 2022). Therefore, MERRA-2 is not realistic from this aspect and including high-latitude sources should be an area of improvements for future reanalyses. However, MERRA-2 is better at capturing spatial variations within the major source regions compared to CAMSRA (see Section 2.4). Overall, one of the reanalyses alone can not provide a robust answer on when and how dust is transported into the Arctic. The combination of them, however, provides more insights into the nature of the dust transport. The key here is that they favor opposite features of the poleward transport due to differences in concentrations and altitude of the transported particles; too high (MERRA-2) vs. too low (CAMSRA) concentration aloft at 70° N, and, too high (MERRA-2) vs. low (CAMSRA) altitude of transport. Thus, with more observations of dust concentrations including their temporal and spatial distribution around and within the Arctic, we could gain more solid knowledge regarding the dust transport into the Arctic.
5 Summary and conclusions
Two three-dimensional reanalysis datasets of atmospheric composition, CAMSRA and MERRA-2, have been analyzed with respect to the poleward dust transport into the Arctic for the years 2003–2018. In particular, we have examined the spatio-temporal distribution, quantity and seasonality of the transport. We have also compared the dust concentrations in the reanalyses with ground measurements and independent (i.e. non-assimilated) CALIOP satellite data. Moreover, we have used the reanalyses to examine if they consistently agree on the most intense individual events of dust transport into the Arctic.
The two reanalyses agree on that the largest dust mass transport into the Arctic occurs across western Russia during spring and early summer. Substantial dust events also occur, for instance, across the Atlantic and easternmost Russia/the Bering Strait during any season. The reanalyses furthermore agree on a peak in the vertically integrated annual transport at 87–89° E longitude. They also agree on that the annual variability in dust transport into the Arctic is driven by annual variability in dust concentrations at the Arctic periphery, rather than variability in the air inflow across 70° N. Moreover, the reanalyses identify the same two episodes as the most extreme in terms of dust transport into the Arctic, 26 March 2008 and 09 Apr 2011, originating from the Central Asian deserts and the Sahara, respectively — thereby suggesting that these two episodes were indeed the two most intense during 2003–2018.
Despite their agreement on some general features of the dust transport into the Arctic, there are also some significant discrepancies between the reanalyses. The transport in CAMSRA is around 20 times smaller than in MERRA-2. The transport in CAMSRA is also more variable in space and time, more dominated by individual dust events, and occurs at lower altitudes — below 4 km a.g.l. in areas where transport is substantial compared to 7–8 km in MERRA-2. In MERRA-2, the substantial poleward transport aloft generate persistently high concentrations of dust at 70° N throughout the entire troposphere, thereby the transport into the Arctic becomes more widespread and continuous compared to CAMSRA. Comparisons with both CALIOP dust extinction and ground measurements of aluminum in filter samples indicate that MERRA-2 likely overestimates the long-range dust mass transport, while CAMSRA likely underestimates it. The two reanalyses thereby indicate a possible range of transport from 1.5 to 31 Tg yr–1, where the comparison with observations indicates that the upper end of that interval is more likely.
The seasonal dependence of the total dust flux into the Arctic is also different in the two reanalyses; In CAMSRA the transport peaks in June, whereas in MERRA-2 it peaks already in April. There are likely several factors that contribute to this discrepancy, such as different seasonality in the emissions, the relative contribution between the sources within each dataset, and the residence time of dust aerosol — the relatively shorter residence time in CAMSRA will favor transport from more proximal deserts. A concrete difference between the two reanalyses is that MERRA-2 does not include high-latitude sources, while they play a crucial role in CAMSRA during summer, causing a noticeable dust transport in the boundary layer across North America into the Arctic.
The large discrepancy between CAMSRA and MERRA-2 regarding the dust mass transport into the Arctic is likely caused by multiple contributing factors, where our results support earlier studies that show that assimilation of too much organic matter aerosol at the expense of dust in CAMSRA causes underestimation of the dust concentration in remote areas, while the assimilation of AOD in MERRA-2 increases the dust concentration in remote areas and enhances the dust residence time. Altogether, these biases have additive effects, contributing to the substantial differences between CAMSRA and MERRA-2 in remote areas.
This study has brought new insights into the spatio-temporal distribution and magnitude of the dust transport into the Arctic. However, scarce and uncertain observations of dust mass concentrations in combination with uncertainties in the reanalyses in the Arctic limit the basis for firm conclusions. The large discrepancies between CAMSRA and MERRA-2 in terms of dust transport into the Arctic indicate that the reanalyses are heavily dependent on the model emission and vertical diffusion schemes, and that it is necessary that the model manages to simulate the correct partitioning between the aerosol types — issues that cannot be compensated or corrected for by the current assimilation of AOD. This study shows that reanalysis dust aerosol data in remote regions are uncertain and thereby must be used with caution e.g. when validating model output against reanalysis data. Nonetheless, improvements in model and assimilation systems in future reanalyses3 are in progress, which may help to narrow down the uncertainties.
Data Accessibility Statement
The CAMSRA data are available at the Atmosphere Data Store (ADS) via the following link: https://atmosphere.copernicus.eu/data and MERRA-2 data are available at the Modeling and Assimilation Data and Information Services Center (MDISC) at https://disc.gsfc.nasa.gov/. The CALIPSO level 2 standard aerosol profile product is created by the NASA Langley Atmospheric Science Data Center (ASDC) and data are accessible via https://asdc.larc.nasa.gov/project/CALIPSO/CAL_LID_L2_05kmAPro-Standard-V4-20_V4-20 (NASA/LARC/SD/ASDC, 2018). Measurements of aluminum surface concentrations at Villum are available at the EBAS database operated by Norwegian Institute for Air Research, https://ebas.nilu.no. Aluminum concentrations from Alert was provided by Dr. Songmiao Fan.
Notes
Acknowledgements
We would like to thank Kevin Marsh from the ECMWF for preparing and providing the CAMSRA dust emission and deposition data, Dr. Songmiao Fan at NOAA for providing the measurements of aluminum surface concentrations at Alert and Alasdair Skelton for the coordination of the Research School for Teachers on Climate and the Environment.
Funding Information
We would like to acknowledge financial support from the Research School for Teachers on Climate and the Environment, Swedish Research Council Grant 2017-06037. SB acknowledges financial support from Smitt’s and Kobb’s scholarship foundations. AE acknowledges financial support from the European Union’s Horizon 2020 research and innovation programme (project FORCeS under grant agreement No 821205) as well as the Swedish National Space Agency (SNSA) grant 16317.
Competing Interests
The authors have no competing interests to declare.
Author Contributions
AE, GS and SB defined the research question. SB performed the analysis and wrote the first draft of the manuscript. AD processed and provided the CALIOP data. All authors discussed the results, read and commented on the manuscript.