
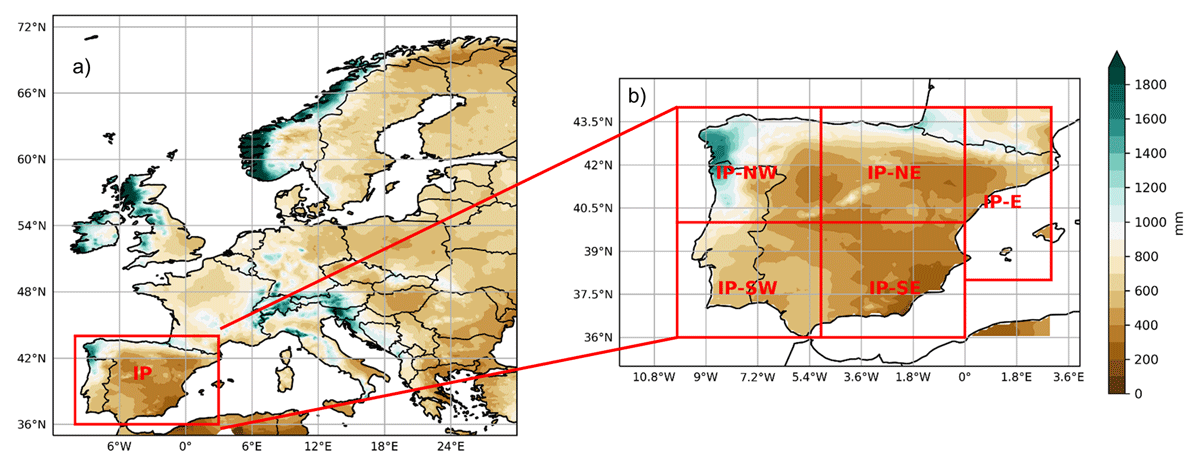
Figure 1
Climatology of annual precipitation (mm) for 1971–2000 derived from E-OBS. (a) Europe, with Iberian Peninsula as defined by Christensen and Christensen (2007) marked by red box; (b) Iberian Peninsula with sub-regions as used in this study.
Table 1
Overview on GCM-RCM model chains (including references) used in this study. Every RCM is driven with every GCM.
| GCM | RCM |
|---|---|
| CNRM-CM5 (Voldoire et al., 2013) | COSMO-CLM4-8-17 (Rockel et al., 2008) |
| EC-EARTH (Prodhomme et al., 2016) | HIRHAM5 (Christensen et al., 1998) |
| HadGEM2-ES (Collins et al., 2011) | RACMO22E (Meijgaard et al., 2012) |
| MPI-ESM-LR (Giorgetta et al., 2013) | RCA4 (Samuelsson et al., 2011) |
| NorESM1-M (Bentsen et al., 2013) | REMO2015 (Jacob et al., 2012) |
Table 2
30-year periods under which the GCMs show a global warming level (GWL) of +2°C and +3°C.
| GCM | +2°C PERIOD | +3°C PERIOD |
|---|---|---|
| CNRM-CM5 | 2029 – 2058 | 2052 – 2081 |
| EC-EARTH | 2026 – 2055 | 2051 – 2080 |
| HadGEM2-ES | 2016 – 2045 | 2037 – 2066 |
| MPI-ESM-LR | 2029 – 2058 | 2052 – 2081 |
| NorESM1-M | 2031 – 2060 | 2057 – 2086 |
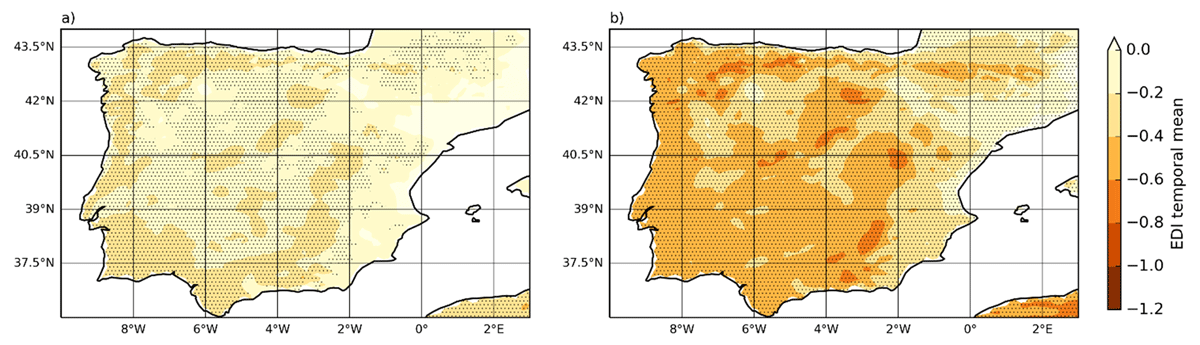
Figure 2
Changes in effective drought index (EDI) for the multi-model ensemble mean for a global warming level (GWL) of (a) +2°C, and (b) +3°C relative to the pre-industrial level. Reference is the historical period 1971-2000 (corresponds to a GWL of +0.5°C). Black dots indicate robust climate change signals, meaning that 17 or more ensemble members (corresponds to 68%) agree on the sign of change.
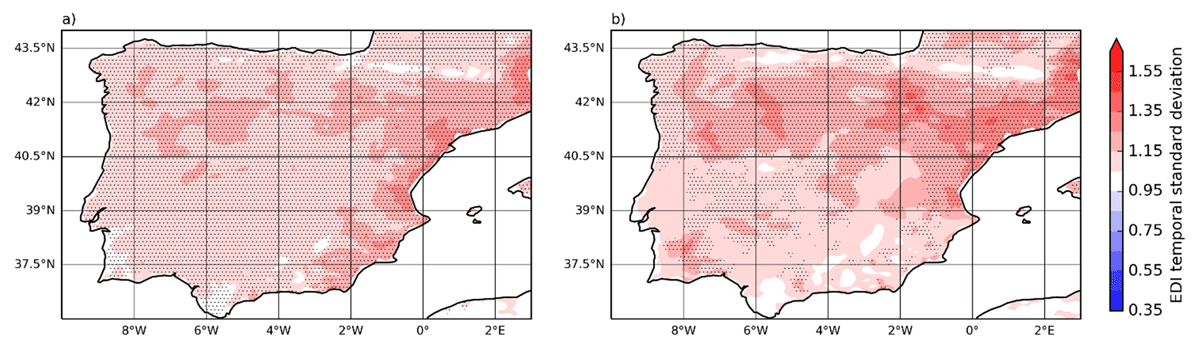
Figure 3
Changes in EDI variability for the multi-model ensemble mean for a GWL of (a) +2°C, and (b) +3°C. Reference is the historical period 1971–2000 (corresponds to a GWL of +0.5°C). Black dots indicate robust climate change signals, meaning that 17 or more ensemble members (corresponds to 68%) agree on the sign of change.
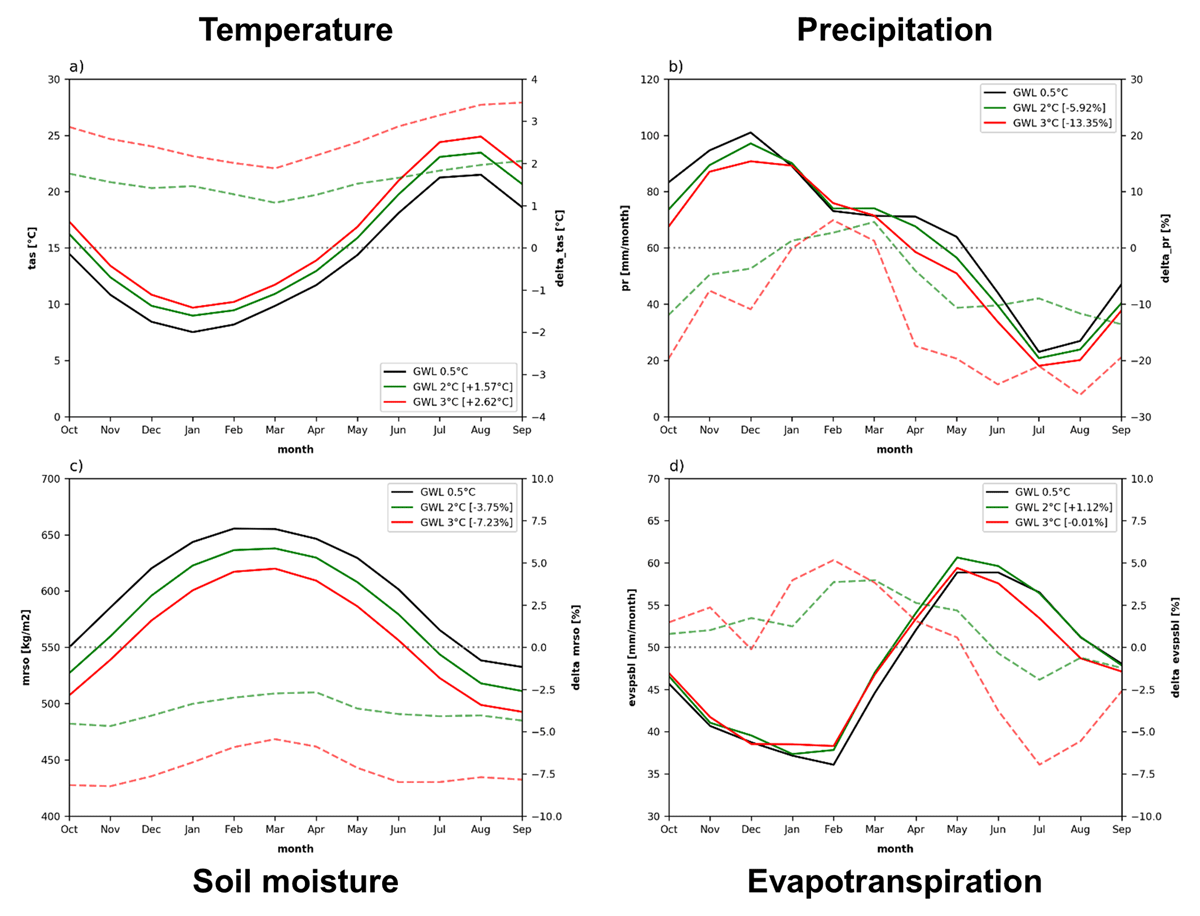
Figure 4
Mean annual cycle (solid lines) of monthly (a) temperature (tas; °C), (b) precipitation (pr; mm/month), (c) soil moisture (mrso; kg/m²), and (d) evapotranspiration (evspsbl; mm/month) – for a GWL of +0.5°C (black), +2°C (green), and +3°C (red). Climate change signals (dashed lines; °C for tas and % for the rest) calculated as GWL2°C – GWL0.5°C (green) and GWL3°C – GWL0.5°C (red). The values in brackets indicate the mean annual change. Depicted is the multi-model ensemble mean, spatially averaged for IP. Please note that we use direct model output.
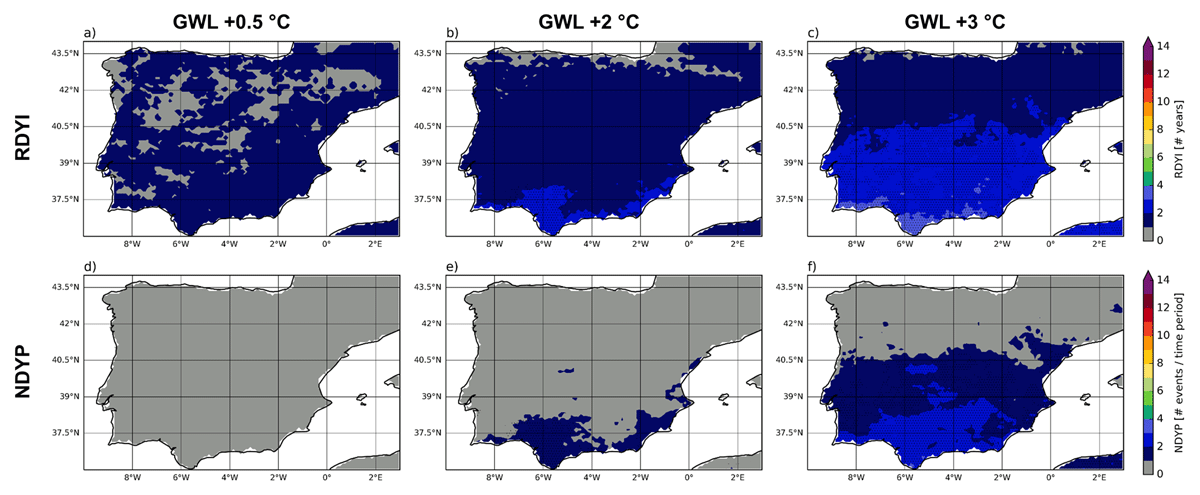
Figure 5
Recurrent dry year index (RDYI; top row) and corresponding number of dry year periods (NDYP; bottom row) derived from the ensemble mean for a GWL of +0.5°C (historical reference; a, d), +2°C (b, e), and +3°C (c, f). For future GWLs, black dots indicate robust climate change signals, meaning that 17 or more ensemble members (corresponds to 68%) agree on the sign of change.
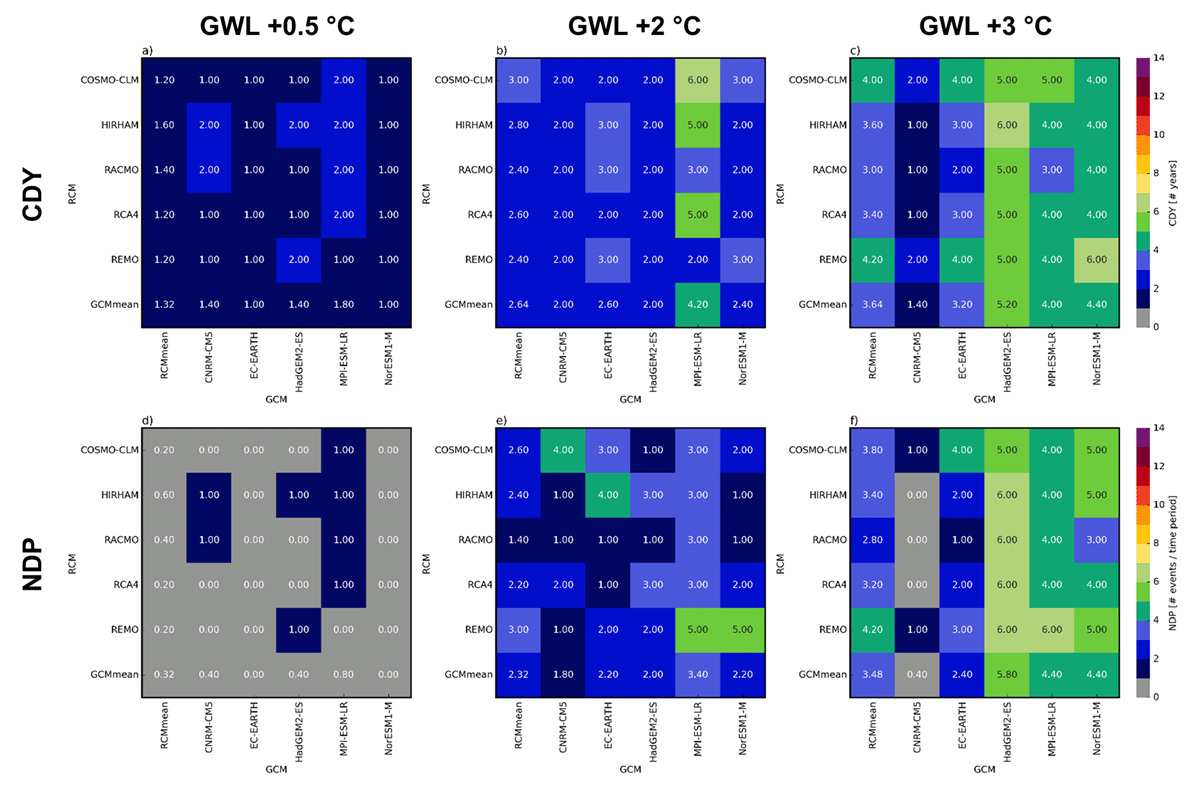
Figure 6
Consecutive drought year index (CDY; top row) and corresponding number of drought periods (NDP; bottom row) for the individual ensemble members derived for whole IP for a GWL of +0.5°C (historical reference; a, d), +2°C (b, e), and +3°C (c, f). For each matrix, rows represent RCMs and columns GCMs, while the RCM (GCM) mean is depicted in the first column (last row).
Table 3
Consecutive drought year index (CDY; left) and consecutive drought year index based on EDI (CDY-EDI; right) for a GWL of +0.5°C, +2°C, and +3°C. Numbers represent the ensemble minimum, the ensemble mean and the ensemble maximum – derived as spatial average for IP and its five sub-regions. The highest values per GWL are highlighted in bold.
| CDY | CDY-EDI | ||||||
|---|---|---|---|---|---|---|---|
| GWL +0.5°C | GWL +2°C | GWL +3°C | GWL +0.5°C | GWL +2°C | GWL +3°C | ||
| IP | min | 1.00 | 2.00 | 1.00 | 1.00 | 2.00 | 2.00 |
| mean | 1.32 | 2.64 | 3.64 | 1.56 | 3.48 | 5.28 | |
| max | 2.00 | 6.00 | 6.00 | 3.00 | 7.00 | 14.00 | |
| IP-NW | min | 1.00 | 1.00 | 1.00 | 1.00 | 1.00 | 1.00 |
| mean | 1.20 | 1.68 | 2.44 | 1.92 | 3.32 | 5.96 | |
| max | 2.00 | 3.00 | 4.00 | 3.00 | 7.00 | 18.00 | |
| IP-NE | min | 1.00 | 1.00 | 1.00 | 1.00 | 2.00 | 2.00 |
| mean | 1.12 | 1.96 | 2.80 | 1.96 | 3.84 | 5.52 | |
| max | 2.00 | 5.00 | 5.00 | 4.00 | 7.00 | 14.00 | |
| IP-E | min | 1.00 | 1.00 | 1.00 | 1.00 | 1.00 | 1.00 |
| mean | 1.36 | 1.88 | 2.32 | 1.64 | 2.52 | 3.76 | |
| max | 3.00 | 5.00 | 5.00 | 3.00 | 6.00 | 8.00 | |
| IP-SW | min | 1.00 | 2.00 | 1.00 | 1.00 | 1.00 | 1.00 |
| mean | 1.68 | 3.12 | 3.76 | 1.52 | 3.24 | 4.88 | |
| max | 4.00 | 6.00 | 10.00 | 3.00 | 6.00 | 10.00 | |
| IP-SE | min | 1.00 | 1.00 | 1.00 | 1.00 | 1.00 | 2.00 |
| mean | 1.76 | 3.48 | 4.52 | 1.48 | 3.04 | 5.08 | |
| max | 3.00 | 9.00 | 7.00 | 3.00 | 7.00 | 14.00 | |
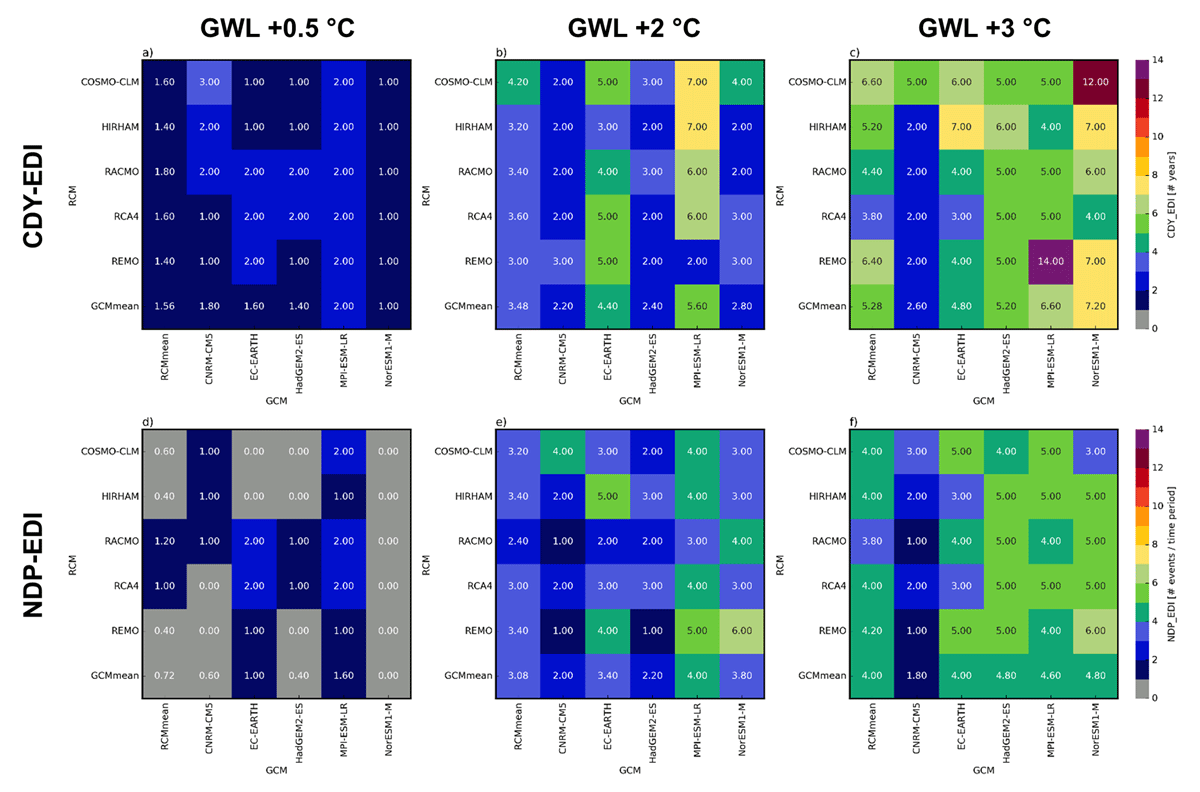
Figure 7
Same as Figure 6, but for consecutive drought year index based on EDI (CDY-EDI; top row) and corresponding number of drought periods (NDP-EDI; bottom row).
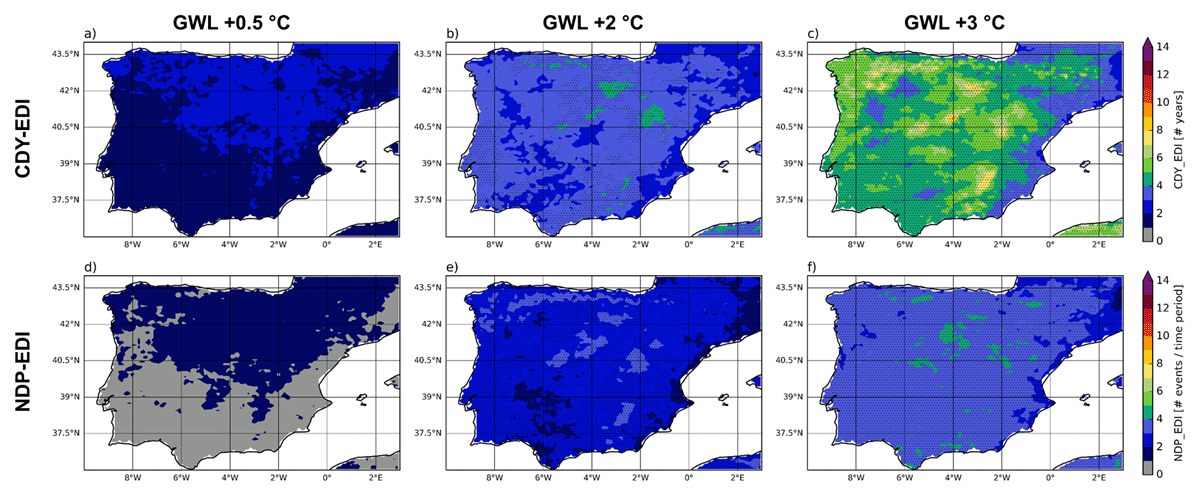
Figure 8
Consecutive drought year index based on EDI (CDY-EDI; top row) and corresponding number of drought periods (NDP-EDI; bottom row) derived from the ensemble mean for a GWL of +0.5°C (historical reference; a, d), +2°C (b, e), and +3°C (c, f). For future GWLs, black dots indicate robust climate change signals, meaning that 17 or more ensemble members (corresponds to 68%) agree on the sign of change.