
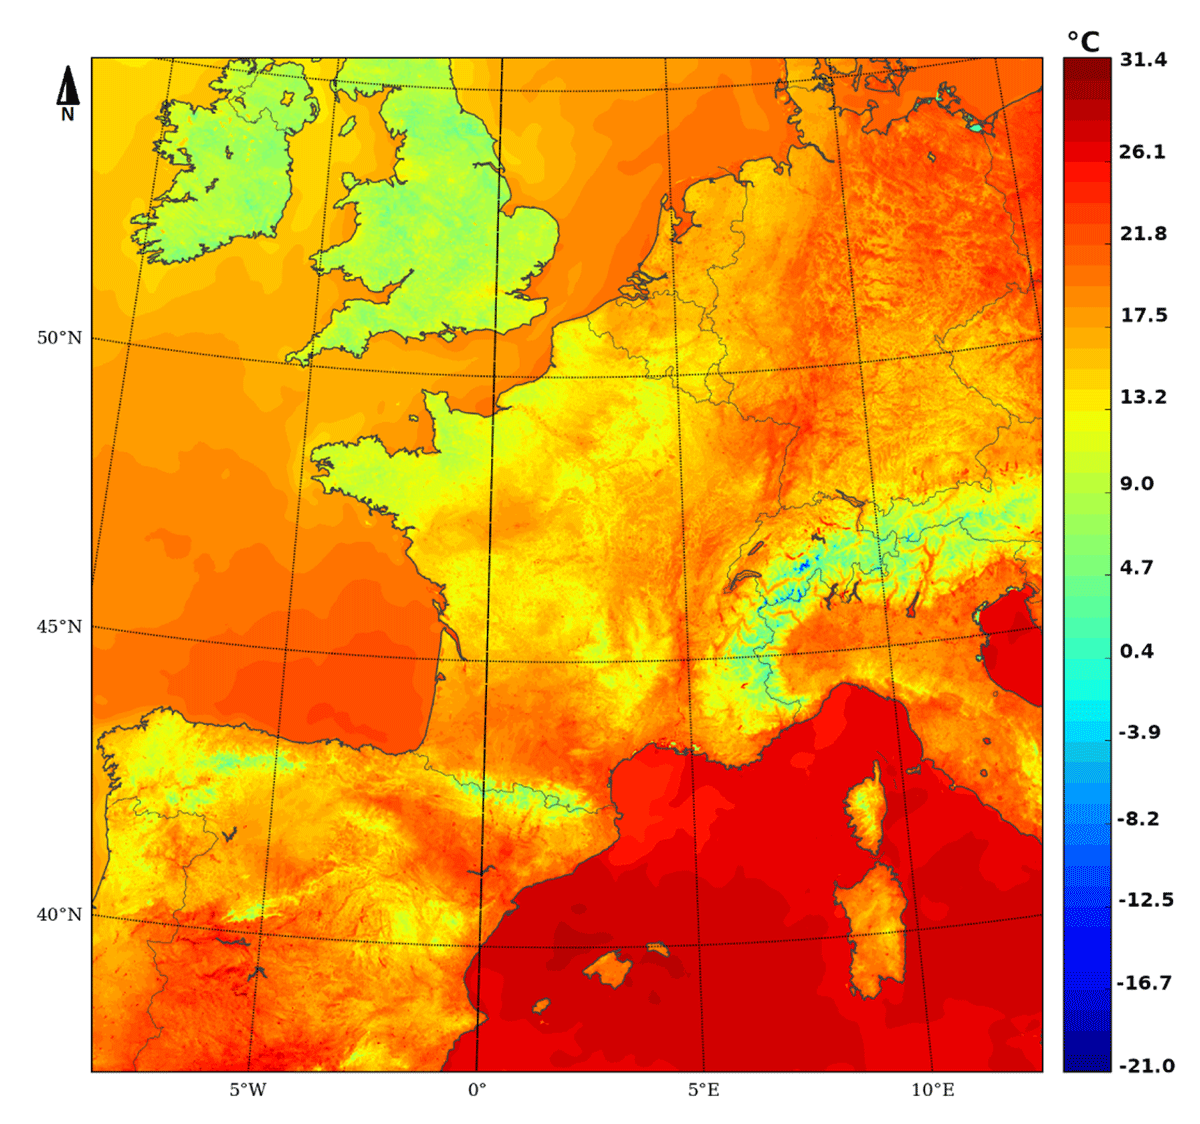
Figure 1
Geographical domain of AROME-France represented by Surface temperature field (°C) of September 1st 2019, 01 h range of 00 UTC forecast.
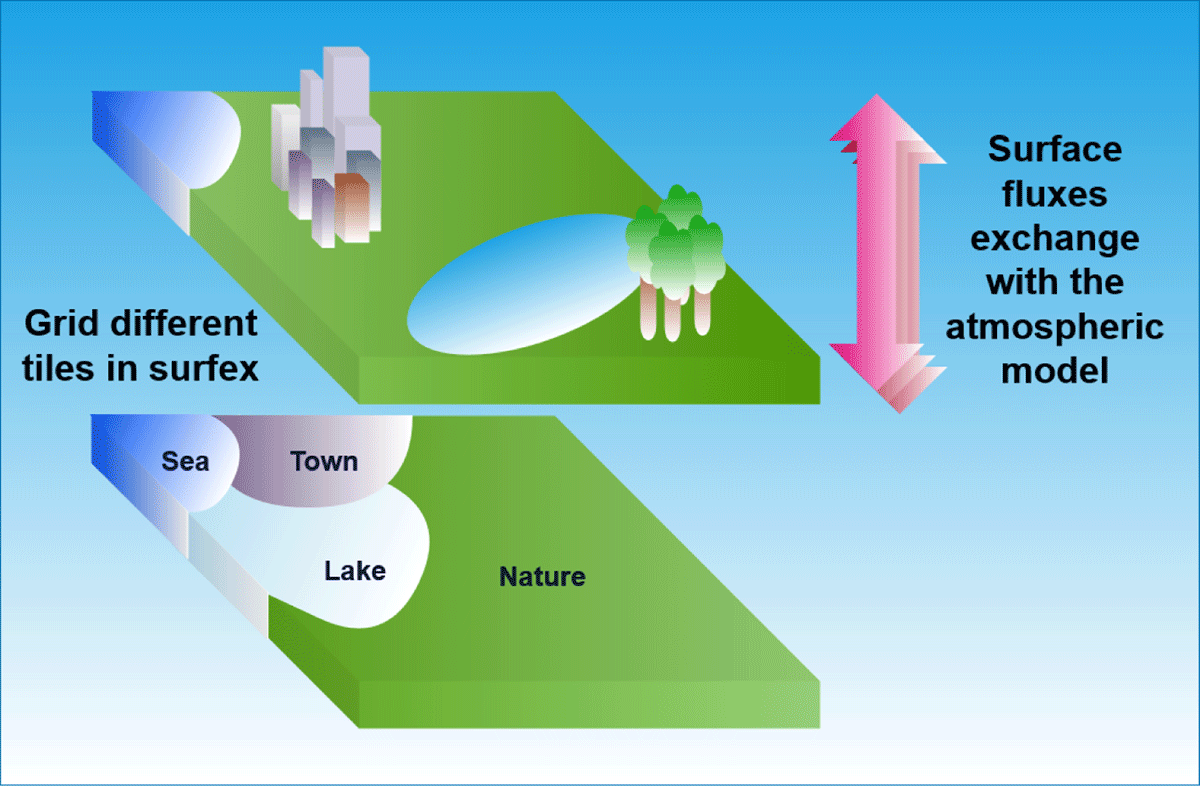
Figure 2
Description of SURFEX tiling and coupling with an atmospheric model.
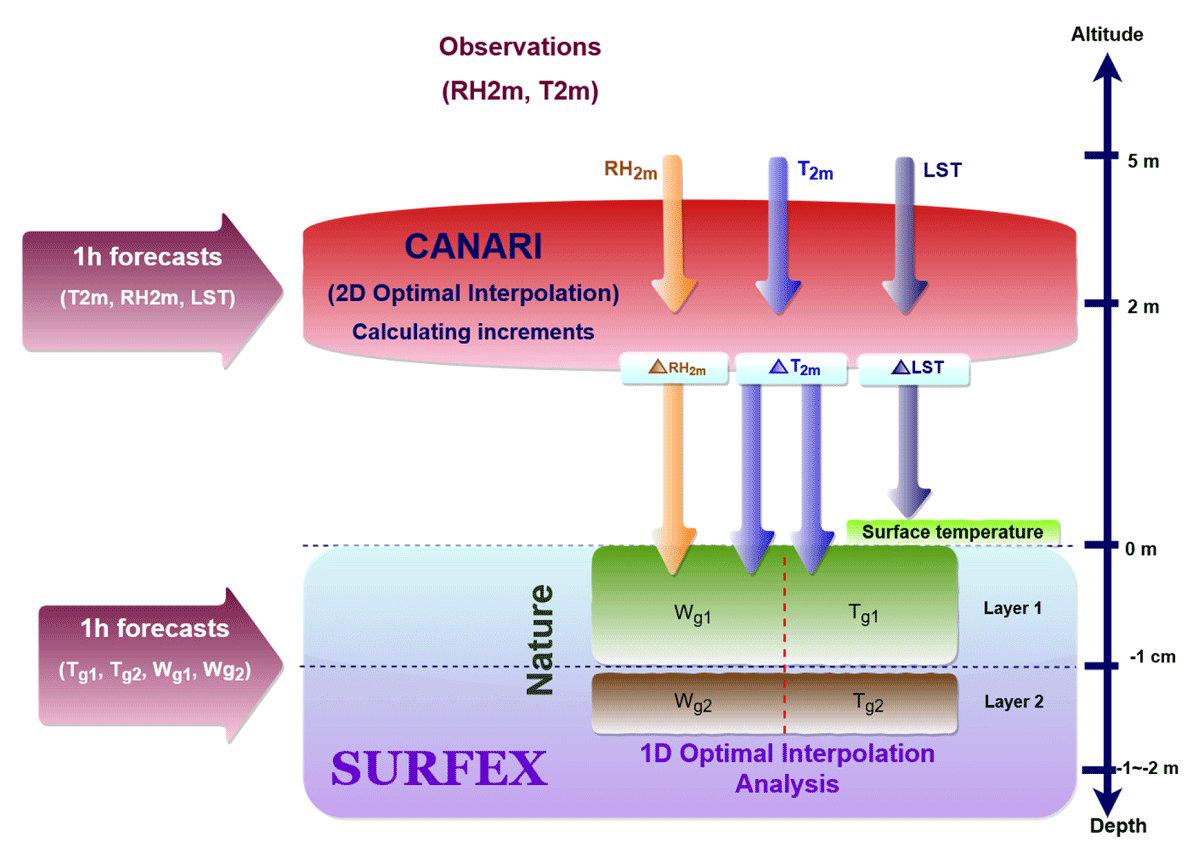
Figure 3
Implementation of the Land Surface Temperature assimilation in the surface analysis of AROME model.
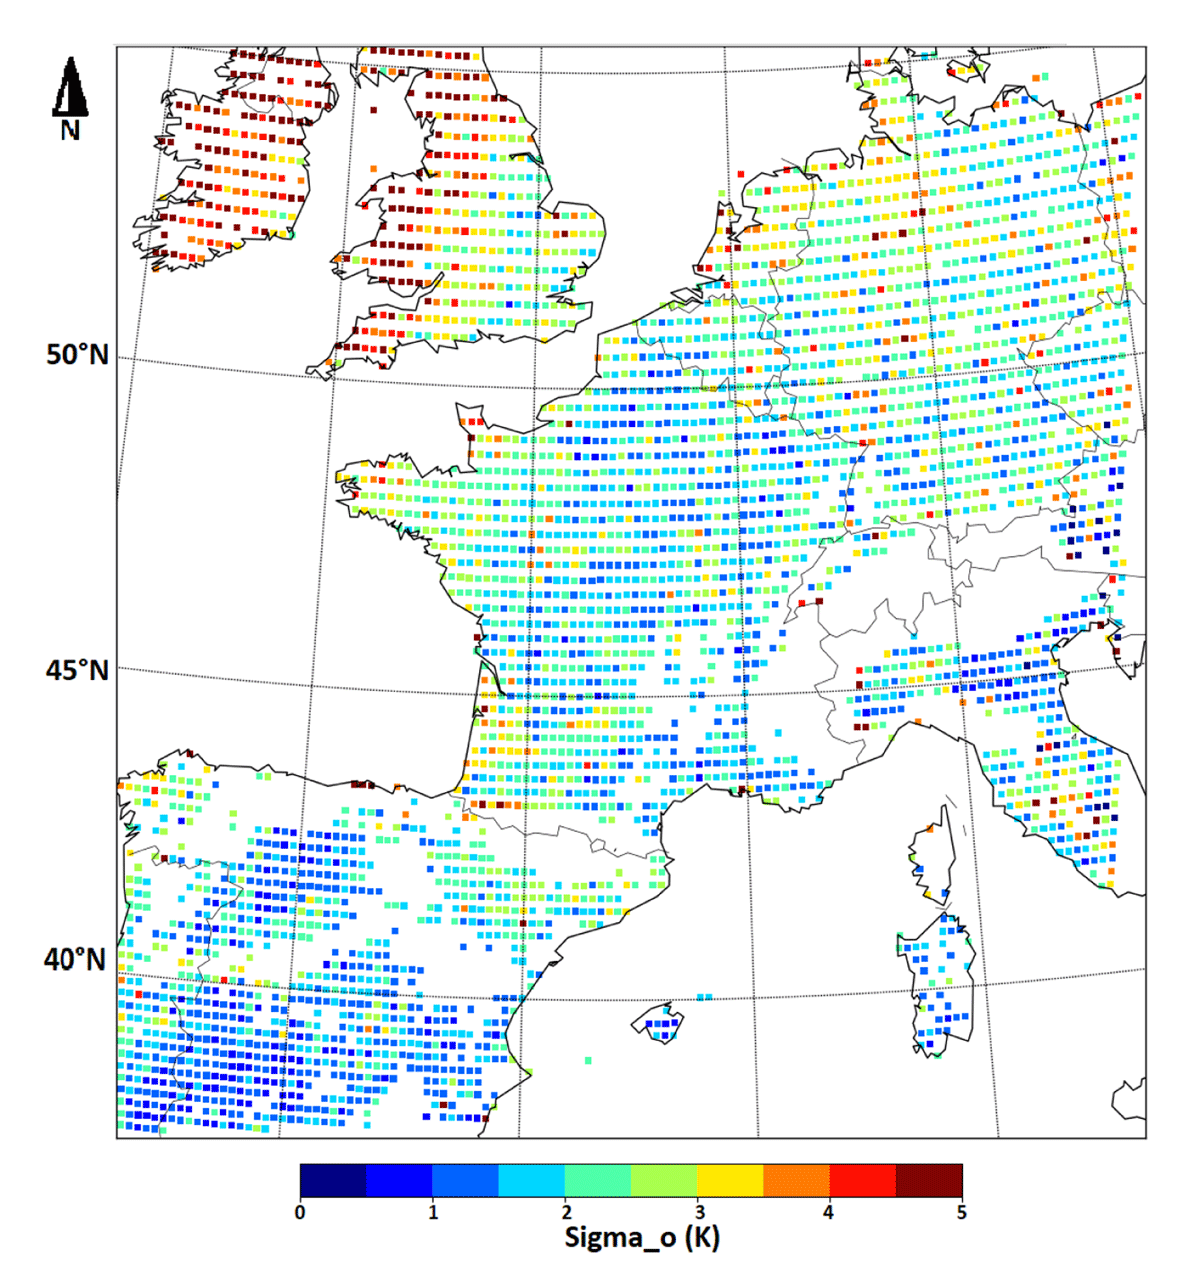
Figure 4
Standard deviations of diagnosed LST “observation” errors for July and August 2019 (00 and 03 UTC). The missing pixels are due to the application of an orography filter (see text for explanation).
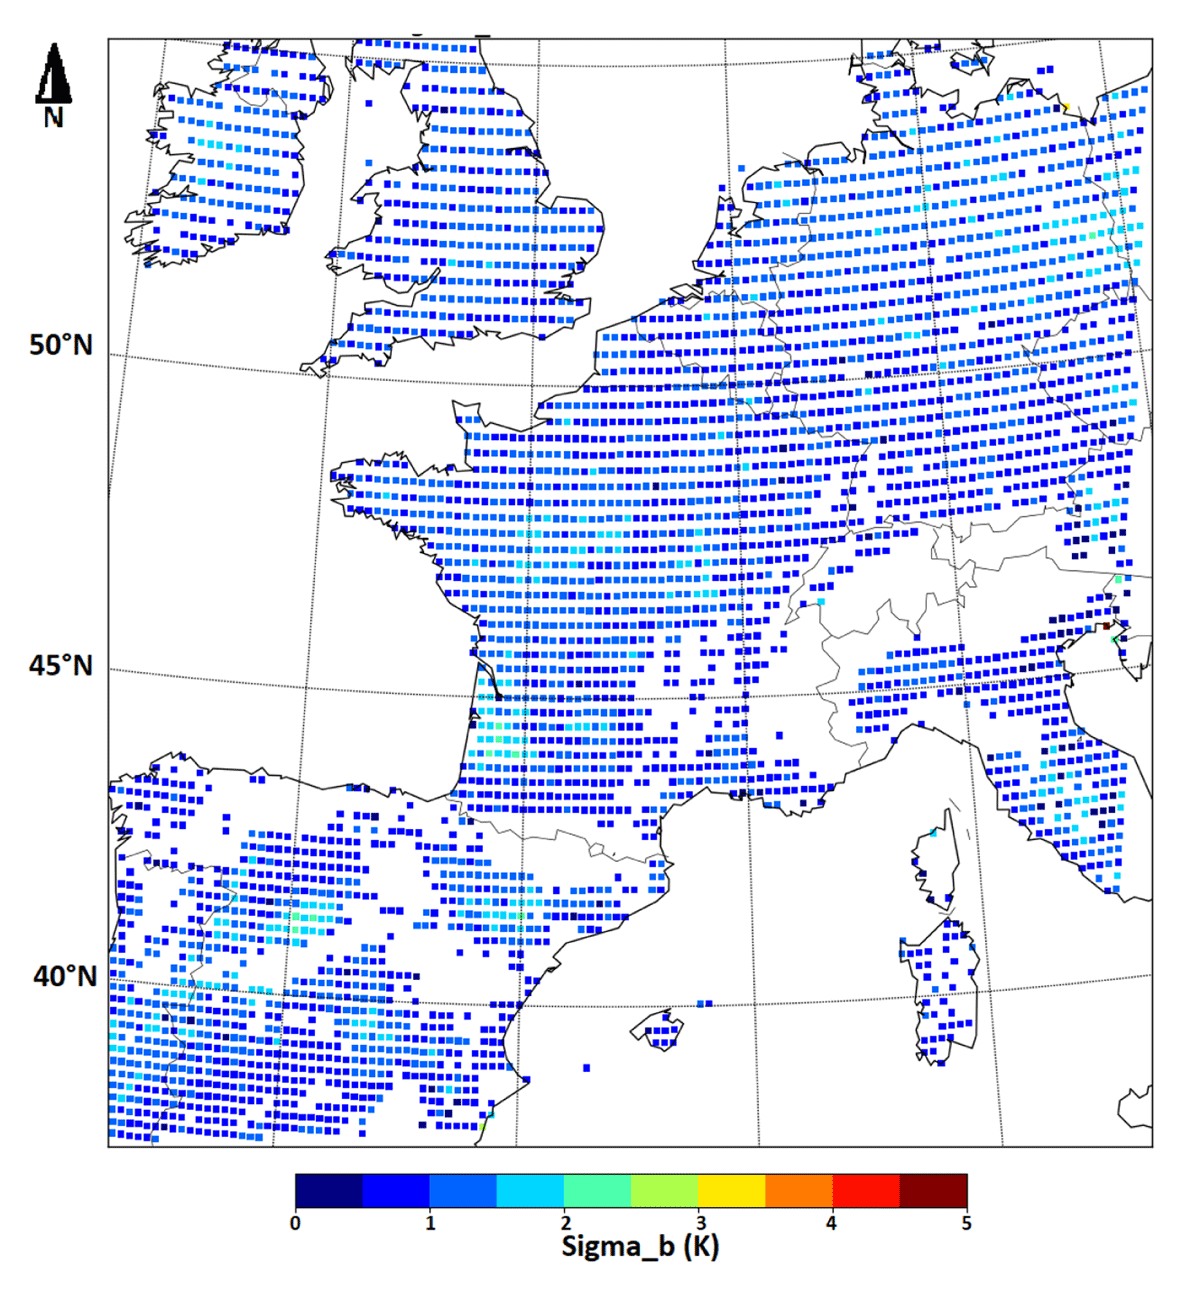
Figure 5
Standard deviations of LST model errors for July and August 2019 (00 and 03 UTC).
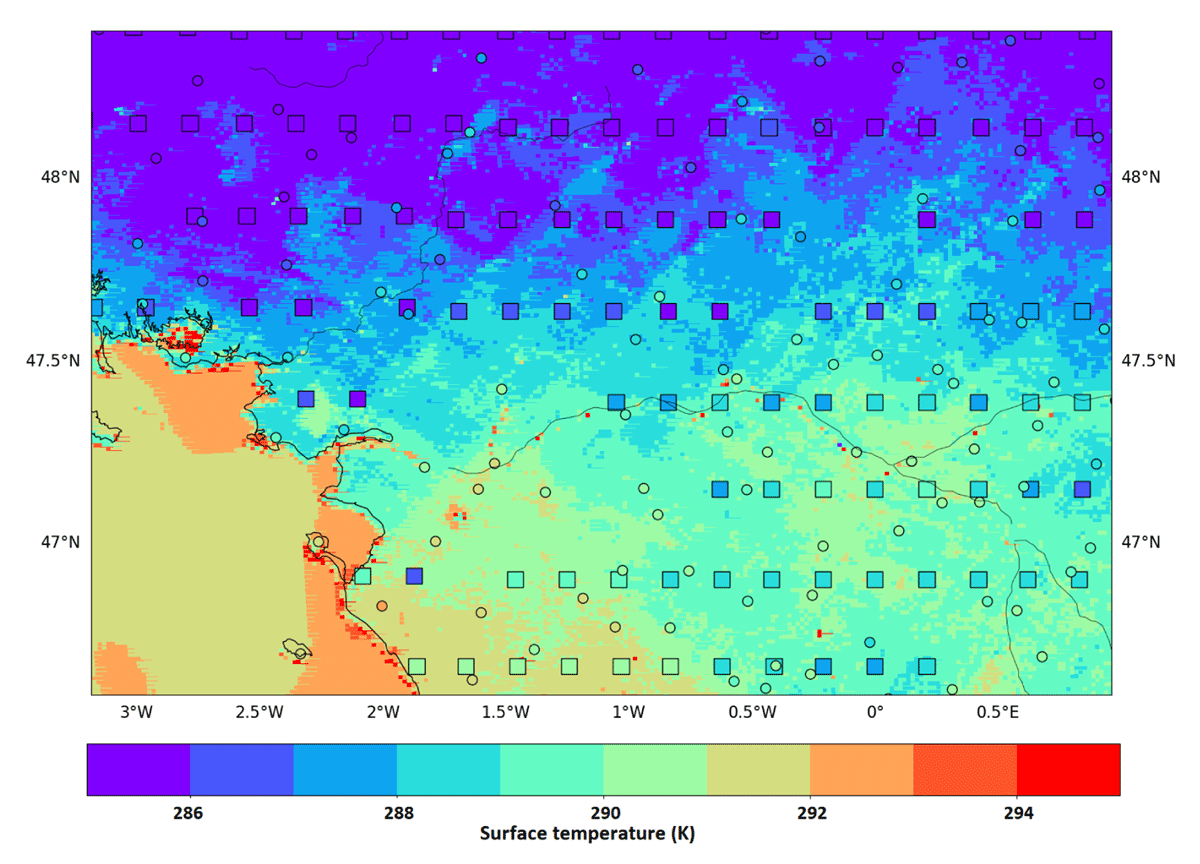
Figure 6
Model surface temperature from 1-h forecast (K, colors), T2m observations (K, circles) and SEVIRI Land Surface Temperature (K, squares) for the July 4th 2019 at 03 UTC over the Loire river basin sub-domain.
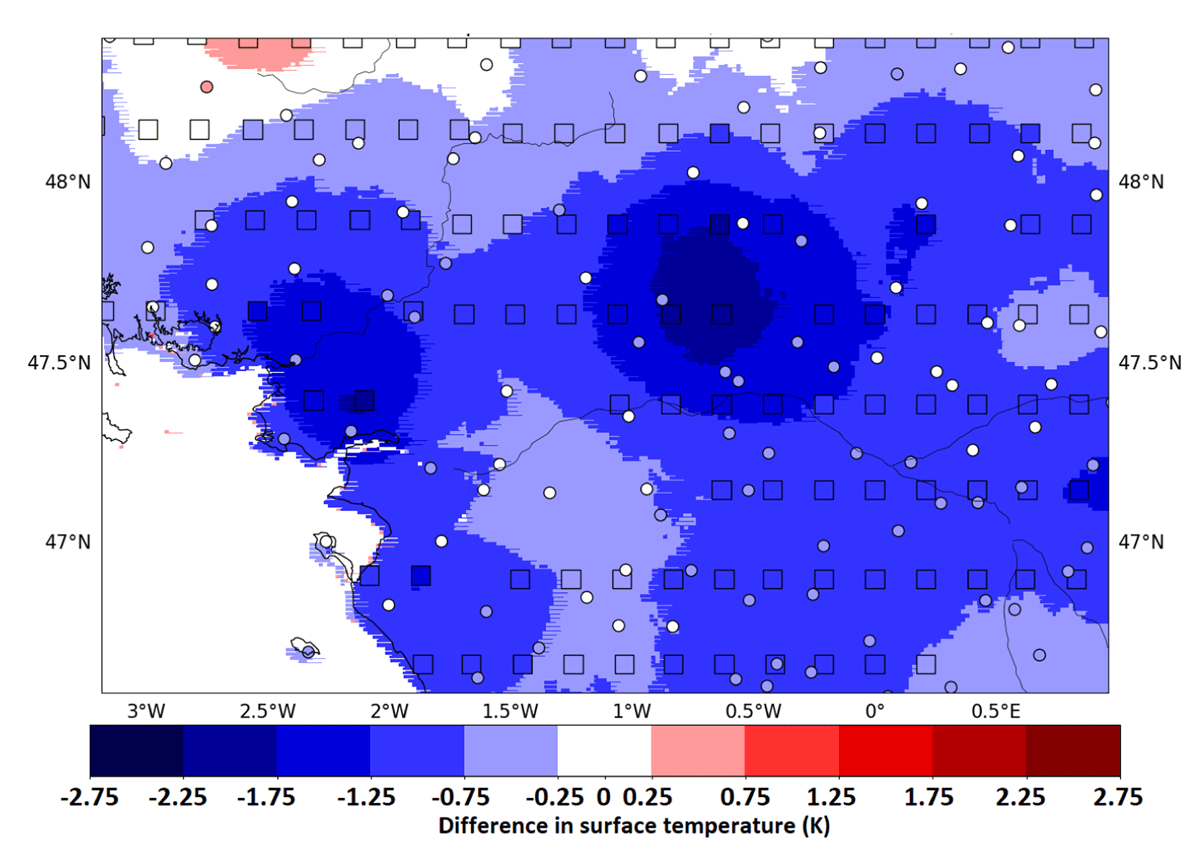
Figure 7
Differences in surface temperature (K) between guess and analysis (colored areas) and increments of analysis at SEVIRI pixel locations (K, squares) and at T2m observation locations (K, circles) for the July 4th 2019 at 03 UTC on the “La Loire” basin sub-domain.
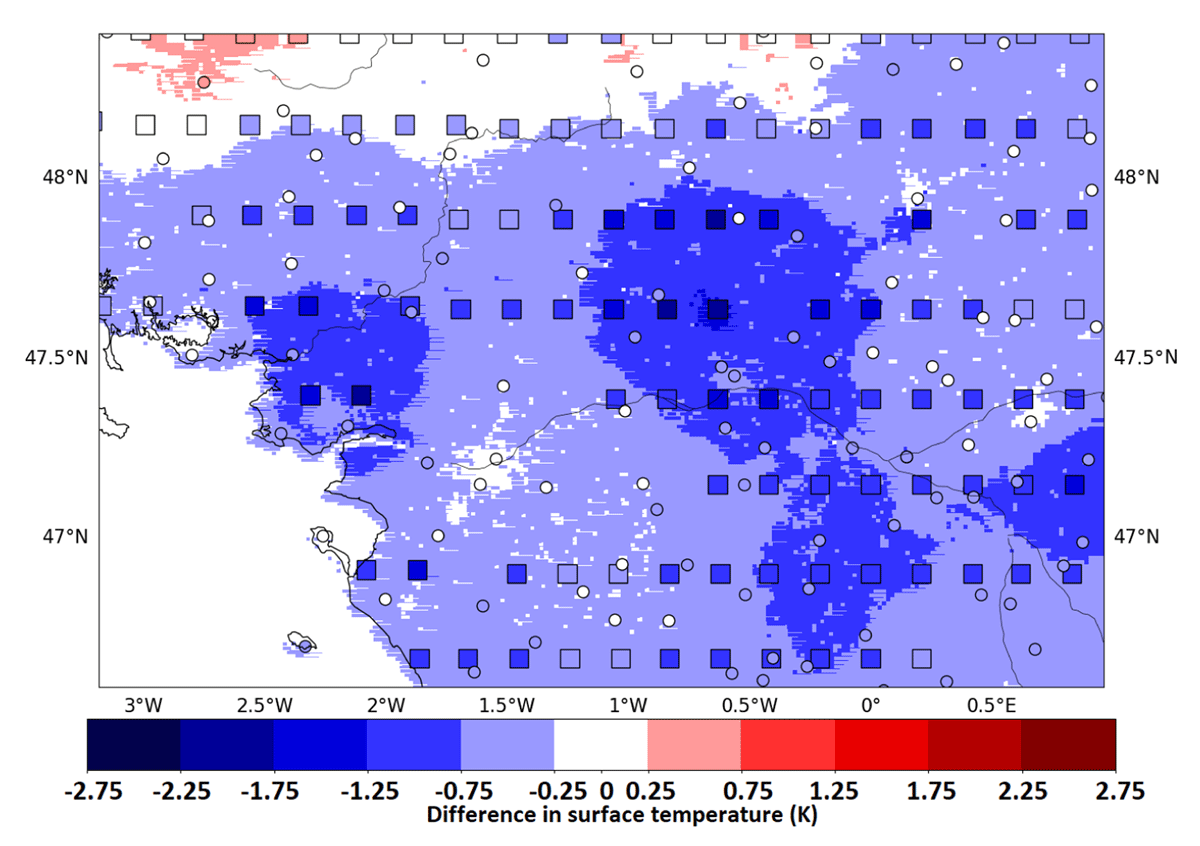
Figure 8
Analysis increments (difference between observations – analysis) of the first soil layer temperature (K) after the surface analysis using the SEVIRI LST and the T2m observation (colors) and increments of analysis on SEVIRI pixels (K, squares) and on T2m observation locations (K, circles) for the July 4th 2019 at 03 UTC over the Loire river basin sub-domain.
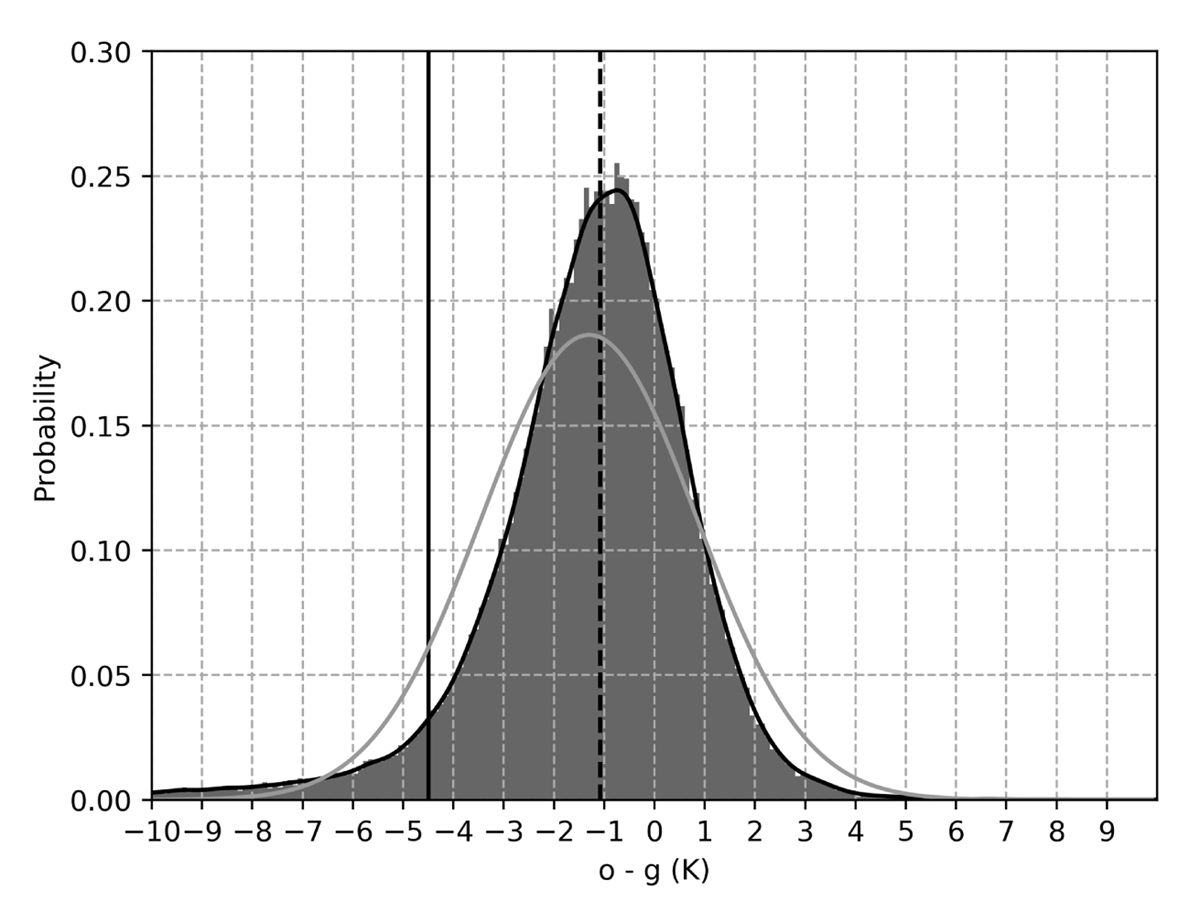
Figure 9
Background departures (obs – guess) distribution for all the 03 UTC analysis time of July and August 2019 with the best fit distribution in black line and normal distribution in gray line. The vertical dashed line indicates the median whereas the continuous line indicates the -4.5 K threshold.
Table 1
Setups of the reference and the SEVIRI LST assimilation experiments.
| REFERENCE1 | EXPERIMENT | |
|---|---|---|
| REF-ARO | EXP-ARO | |
| Assimilation of T2m | Yes (00, 3, 6, 9, 12, 15, 18, 21) | Yes (00, 3, 6, 9, 12, 15, 18, 21) |
| Assimilation of LST | No | Yes (00 and 03 UTC) |
| Experiment period | from 05/07/2019 to 04/09/2019 | from 05/07/2019 to 04/09/2019 |
| Horizontal correlation length (T2m) | 100 km | 100 km |
| Standard deviation of observation error (T2m) | 1.4 K | 1.4 K |
| Standard deviation of background error (T2m) | 1.6 K | 1.6 K |
| Horizontal correlation length (LST) | – | 30 km |
| Standard deviation of observation error (LST) | – | 3.0 K |
| Standard deviation of background error (LST) | – | 1.8 K |
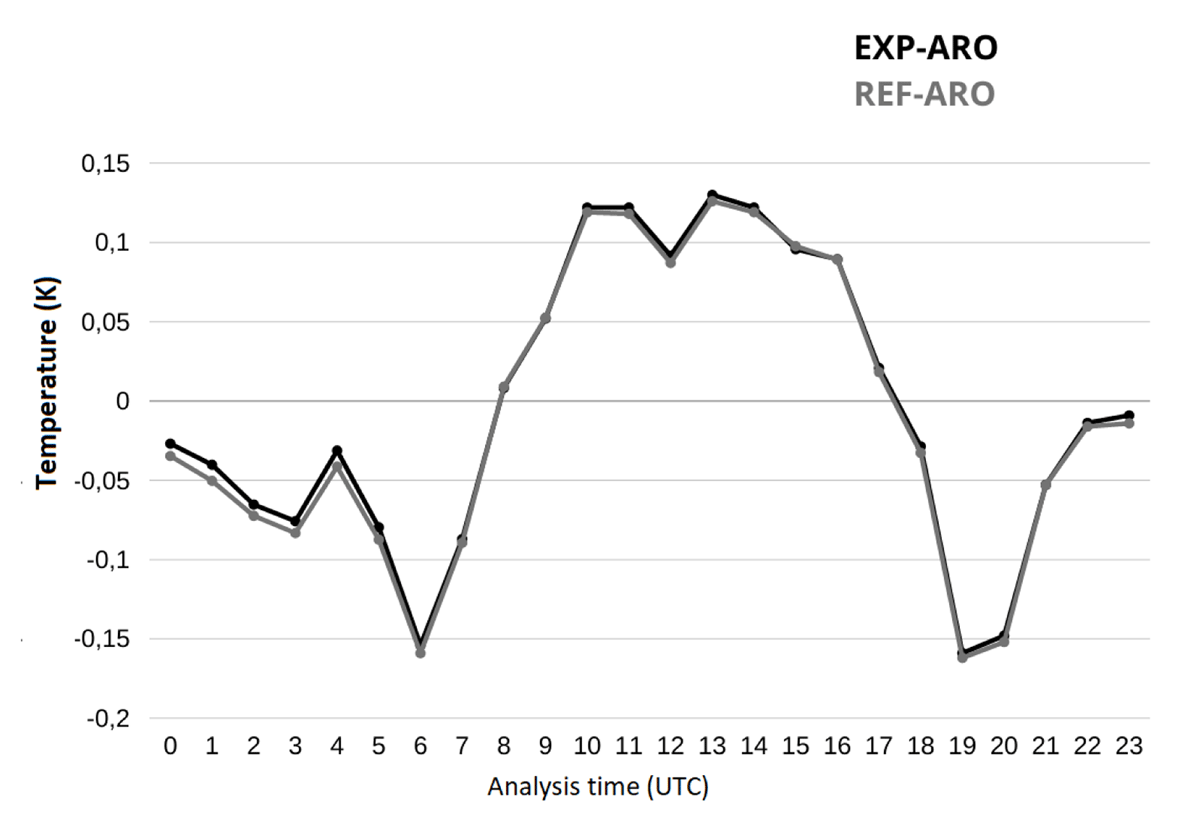
Figure 10
Mean differences over July and August 2019 between 2~m temperature (K) observations and background for EXP-ARO (black line) and REF-ARO (grey line) experiments for each analysis time.
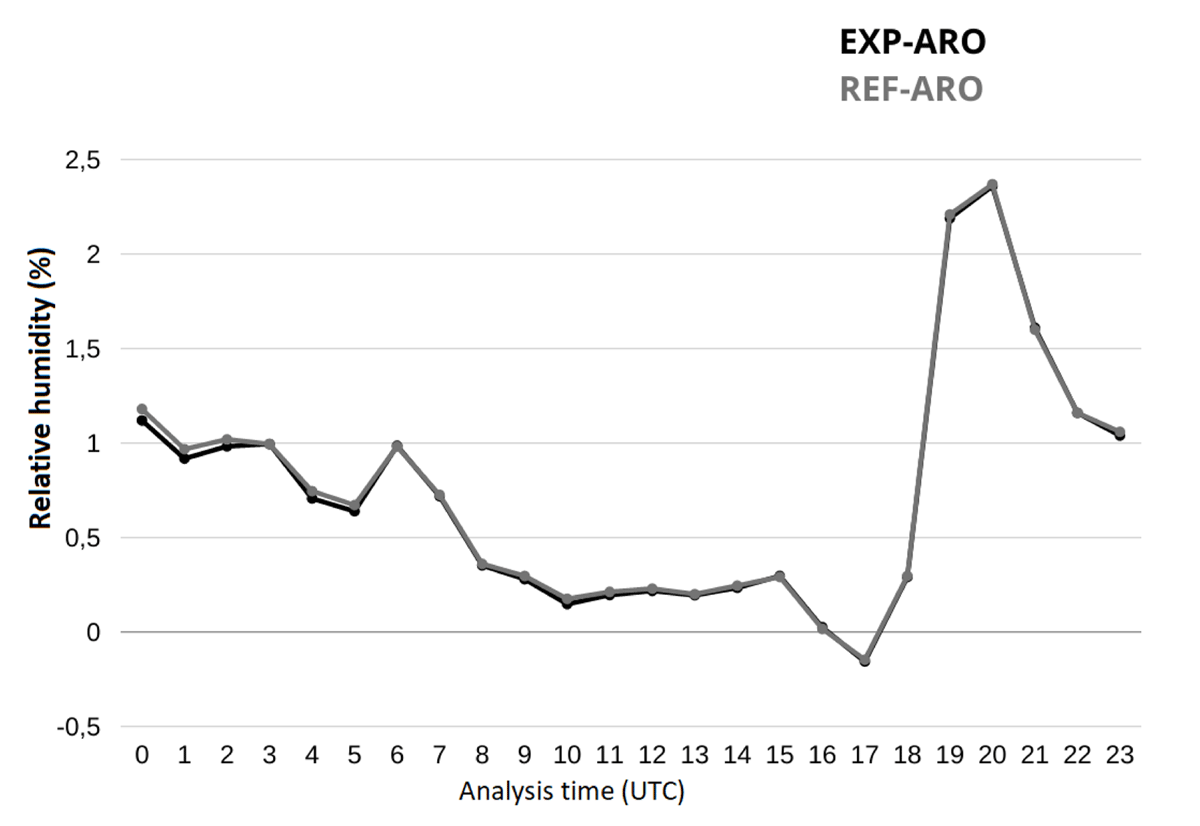
Figure 11
Mean differences over July and August 2019 between 2~m relative humidity (%) observations and background for EXP-ARO and REF-ARO for each analysis time.
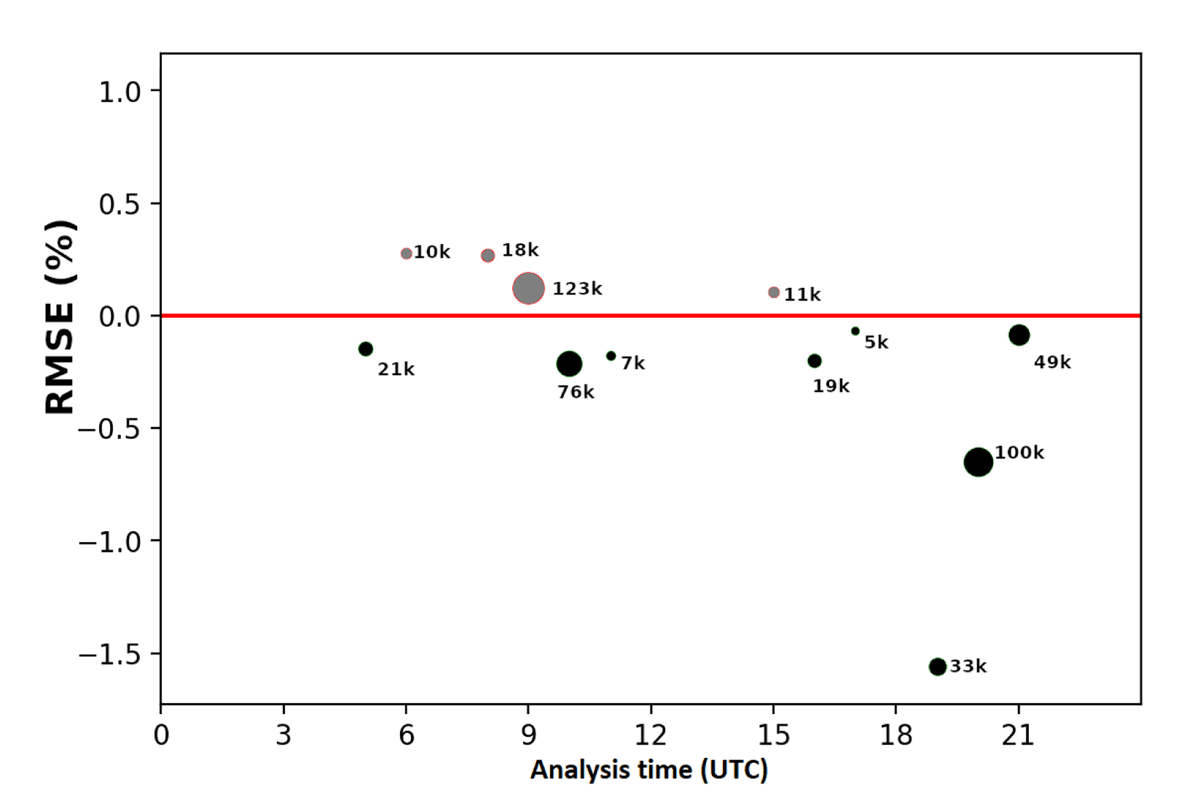
Figure 12
Relative difference between MHS channel 5 observed and 1 h forecast radiances for July and August 2019. The negative values correspond to an improvement of the channel 5 simulation with EXP-ARO compared to REF-ARO. The size of the symbols indicate the number of assimilated observations.
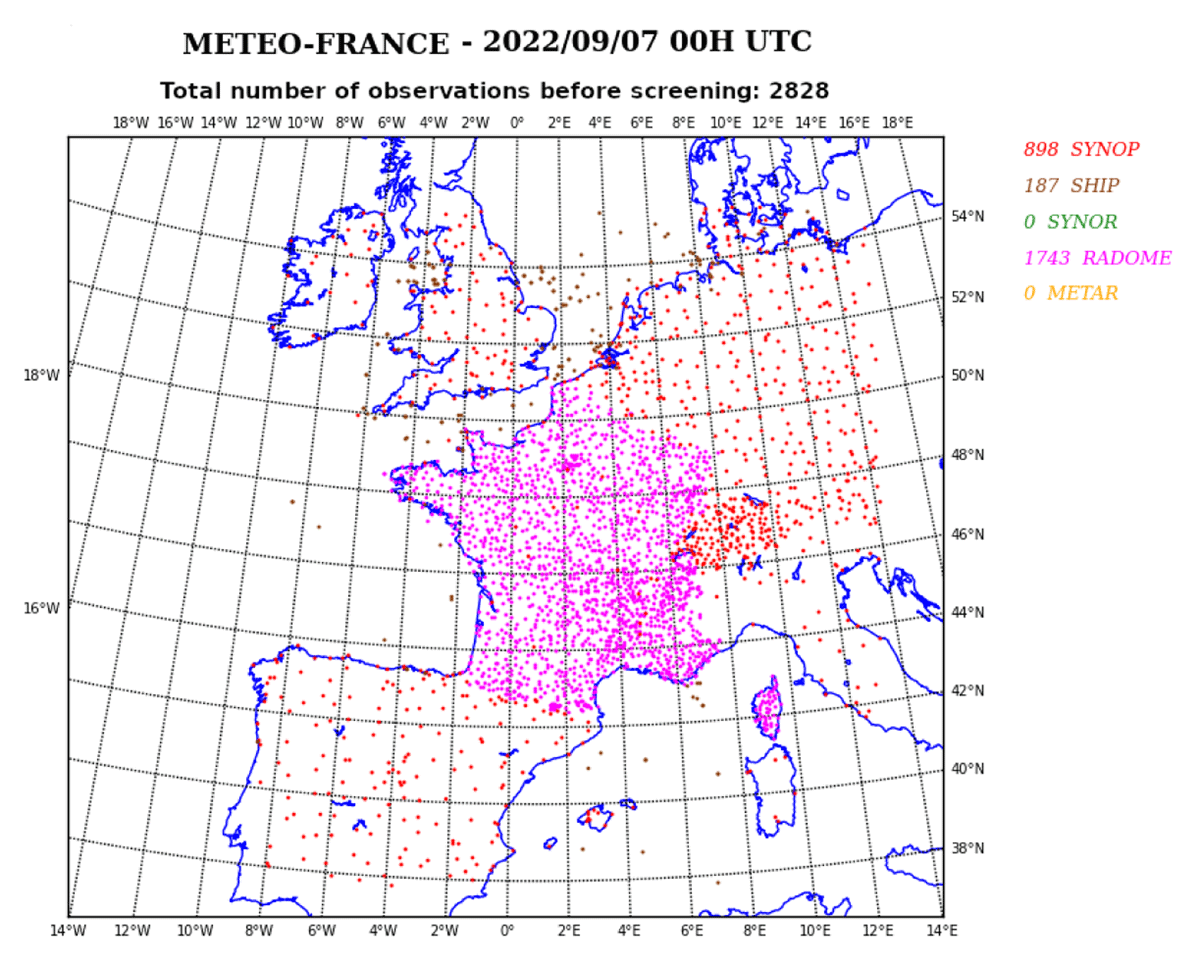
Figure 13
Map of coverage of surface observations available on September 7th 2022 and used in AROME-France model.
Table 2
Differences in RMSE of 2 m temperature (K) and 2 m relative humidity (%) forecast (ranges between 0 to 48 h) between REF-ARO and EXP-ARO compared to surface stations observations for July and August 2019. Positive values correspond to an improvement with EXP-ARO. Bold values represent the significant impacts according to Bootstrap test with a minimum of 95% confidence level.
| 0 H | 6 H | 12 H | 18 H | 24 H | 30 H | 36 H | 42 H | 48 H | |
|---|---|---|---|---|---|---|---|---|---|
| 2 m Temperature (K) | –0.01 | 0 | 0 | 0 | 0.01 | 0.01 | 0 | 0.01 | 0.01 |
| 2 m Humidity (%) | –0.02 | 0.01 | 0.04 | 0.08 | 0.06 | 0.06 | –0.02 | 0.01 | 0.07 |
Table 3
Difference in RMSE of temperature (K) and relative humidity (%) forecasts (ranges up to 48 h) between REF-ARO and EXP-ARO compared to radiosonde observations at 1000, 850, 700, 500 and 400 hPa. Positive values correspond to an improvement with EXP-ARO with respect to REF-ARO. Bold values represent significant impacts according to Bootstrap test with a 95% confidence level.
| 0 H | 12 H | 24 H | 36 H | 48 H | ||||||
|---|---|---|---|---|---|---|---|---|---|---|
| T (K) | RH (%) | T (K) | RH (%) | T (K) | RH (%) | T (K) | RH (%) | T (K) | RH (%) | |
| 400 hPa | 0.01 | 0.02 | 0.01 | 0.7 | –0.01 | 0.07 | 0 | 0.01 | 0 | 0.07 |
| 500 hPa | –0.01 | 0.18 | 0 | –0.19 | 0.01 | –0.02 | 0 | 0.24 | 0 | –0.21 |
| 700 hPa | 0.01 | 0.4 | –0.01 | –0.71 | –0.02 | 0.03 | –0.01 | –0.31 | 0 | –0.04 |
| 850 hPa | 0 | 0.07 | 0 | 0.22 | 0 | –0.15 | 0 | 0.04 | 0.02 | 0.05 |
| 1000 hPa | 0.03 | 0.02 | 0.03 | –0.01 | 0.02 | –0.04 | –0.03 | –0.17 | –0.03 | 0.06 |
| LST | Land Surface Temperature |
| OI | Optimal Interpolation |
| SURFEX | SURFace EXternalisée |
| T2m | 2 meters temperature |
| RH2m | 2 meters relative humidity |
| NWP | Numerical Weather Prediction |
| UTC | Universal Time Coordinated |
| MSG | Meteosat Second Generation |
| IASI | Infrared Atmospheric Sounding Interferometer |
| SEVIRI | Spinning Enhanced Visible and Infrared Imager |
| AROME | Applications de la Recherche à l’Opérationnel à Méso-Echelle |
| CNRM | Centre National de Recherches Météorologiques |
| MW | Microwave |
| IR | Infrared |
| RTTOV | Radiative Transfer for TOVS |
| TOVS | TIROS Operational Vertical Sounder |