
Table 1
Overview of Arctic storylines (A–D) and CMIP6 candidate models. The storylines are listed in column 1 and the two predictors the storylines are based on, the strength (+/–) of the Arctic amplification (ArcAmp+/–) relative to the multi-model mean, and the strength (+/–) of the Barents-Kara Sea warming (BKWarm+/–) relative to the multi-model mean, are listed in columns 2 and 3. The CMIP6 candidate models are listed in column 4, their abbreviations (abbr.) in column 5, the realization that is closest to the storyline point in the predictor-phase diagram (Figure 1) in column 6, and the Euclidean distance (ED) between the model/realization and the storyline point in the predictor-phase diagram in column 7. We omit FIO-ESM-2-1 (r1i1p1f1; ED = 0.73) from storyline A due to technical issues and EC-Earth3 (r112i1p1f1; ED = 0.69) from storyline B as ps was not available. Note that the models are ranked by the Euclidean distance for each storyline.
| STORYLINE | PREDICTOR 1 | PREDICTOR 2 | CANDIDATE MODEL | ABBR. | REALIZATION | ED |
|---|---|---|---|---|---|---|
| A | ArcAmp– | BKWarm+ | CNRM-CM6-1 | A1 | r1i1p1f2 | 0.38 |
| CIESM | A2 | r1i1p1f1 | 0.44 | |||
| MPI-ESM1-2-LR | A3 | r17i1p1f1 | 0.48 | |||
| CNRM-ESM2-1 | A4 | r1i1p1f2 | 0.62 | |||
| B | ArcAmp+ | BKWarm+ | MIROC-ES2L | B1 | r8i1p1f2 | 0.12 |
| MIROC6 | B2 | r23i1p1f1 | 0.17 | |||
| HadGEM3-GC31-LL | B3 | r3i1p1f3 | 0.73 | |||
| UKESM1-0-LL | B4 | r8i1p1f2 | 0.74 | |||
| C | ArcAmp– | BKWarm– | CESM2-WACCM | C1 | r1i1p1f1 | 0.09 |
| GISS-E2-1-H | C2 | r5i1p1f2 | 0.11 | |||
| CAMS-CSM1-0 | C3 | r1i1p1f1 | 0.14 | |||
| GISS-E2-1-G | C4 | r3i1p5f1 | 0.26 | |||
| MCM-UA-1-0 | C5 | r1i1p1f2 | 0.38 | |||
| CAS-ESM2-0 | C6 | r3i1p1f1 | 0.55 | |||
| D | ArcAmp+ | BKWarm– | NorESM2-MM | D1 | r1i1p1f1 | 0.16 |
| KACE-1-0-G | D2 | r1i1p1f1 | 0.66 |
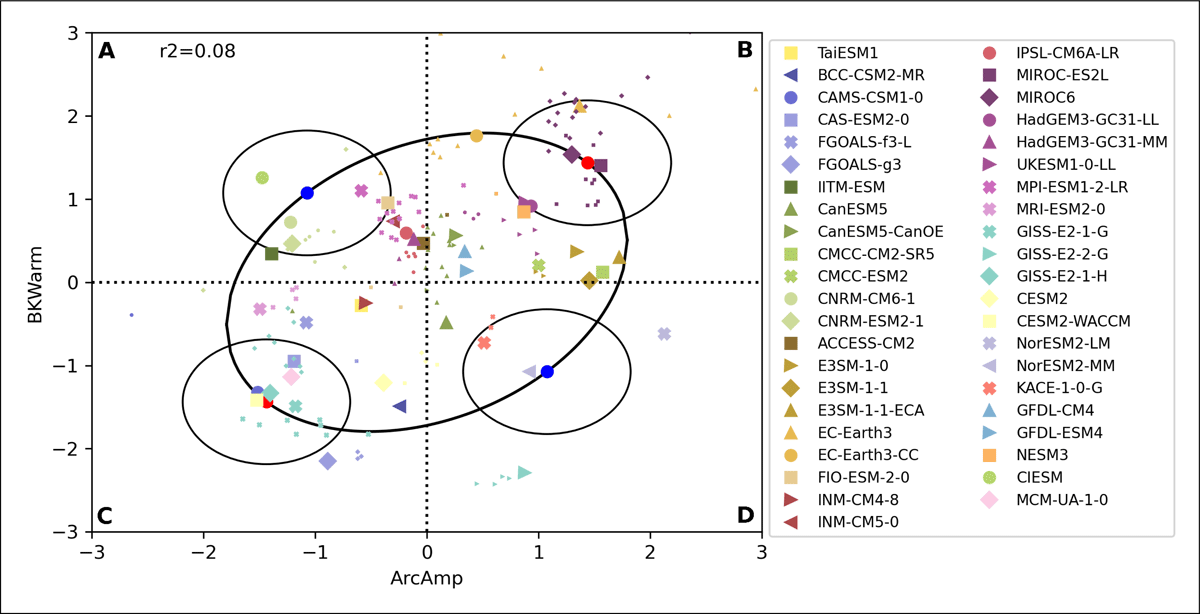
Figure 1
Predictor diagram for Arctic storylines showing the area-mean future change in Arctic ta850 (ArcAmp; x-axis) and Barents-Kara-Sea sea surface temperature (BKWarm; y-axis) for MJJASO for the models (legend) used in Levine et al. (2024). The future changes are computed as the difference between SSP5-8.5 (2070–2099) and the CMIP6 historical (1985–2014) normalized by the global-mean annual-mean change in tas. ArcAmp and BKWarm are relative to the multi-model mean and normalized by each model’s standard deviation; hence, a predictor value of 1 means that it deviates from the multi-model mean by 1 standard deviation. The ellipse shows the 80% confidence region for the predictors and the blue and red dots on the ellipse shows the four storylines (A–D) as in Levine et al. (2024). The circles denote where the Euclidean distance from the storyline point is 0.75. For models with multiple realizations, markers with two different sizes are shown: the large marker shows the realization that is closest to the relevant storyline point; other realizations that were also considered by Levine et al. (2024) are shown as substantially smaller markers, but with the same color and marker shape.
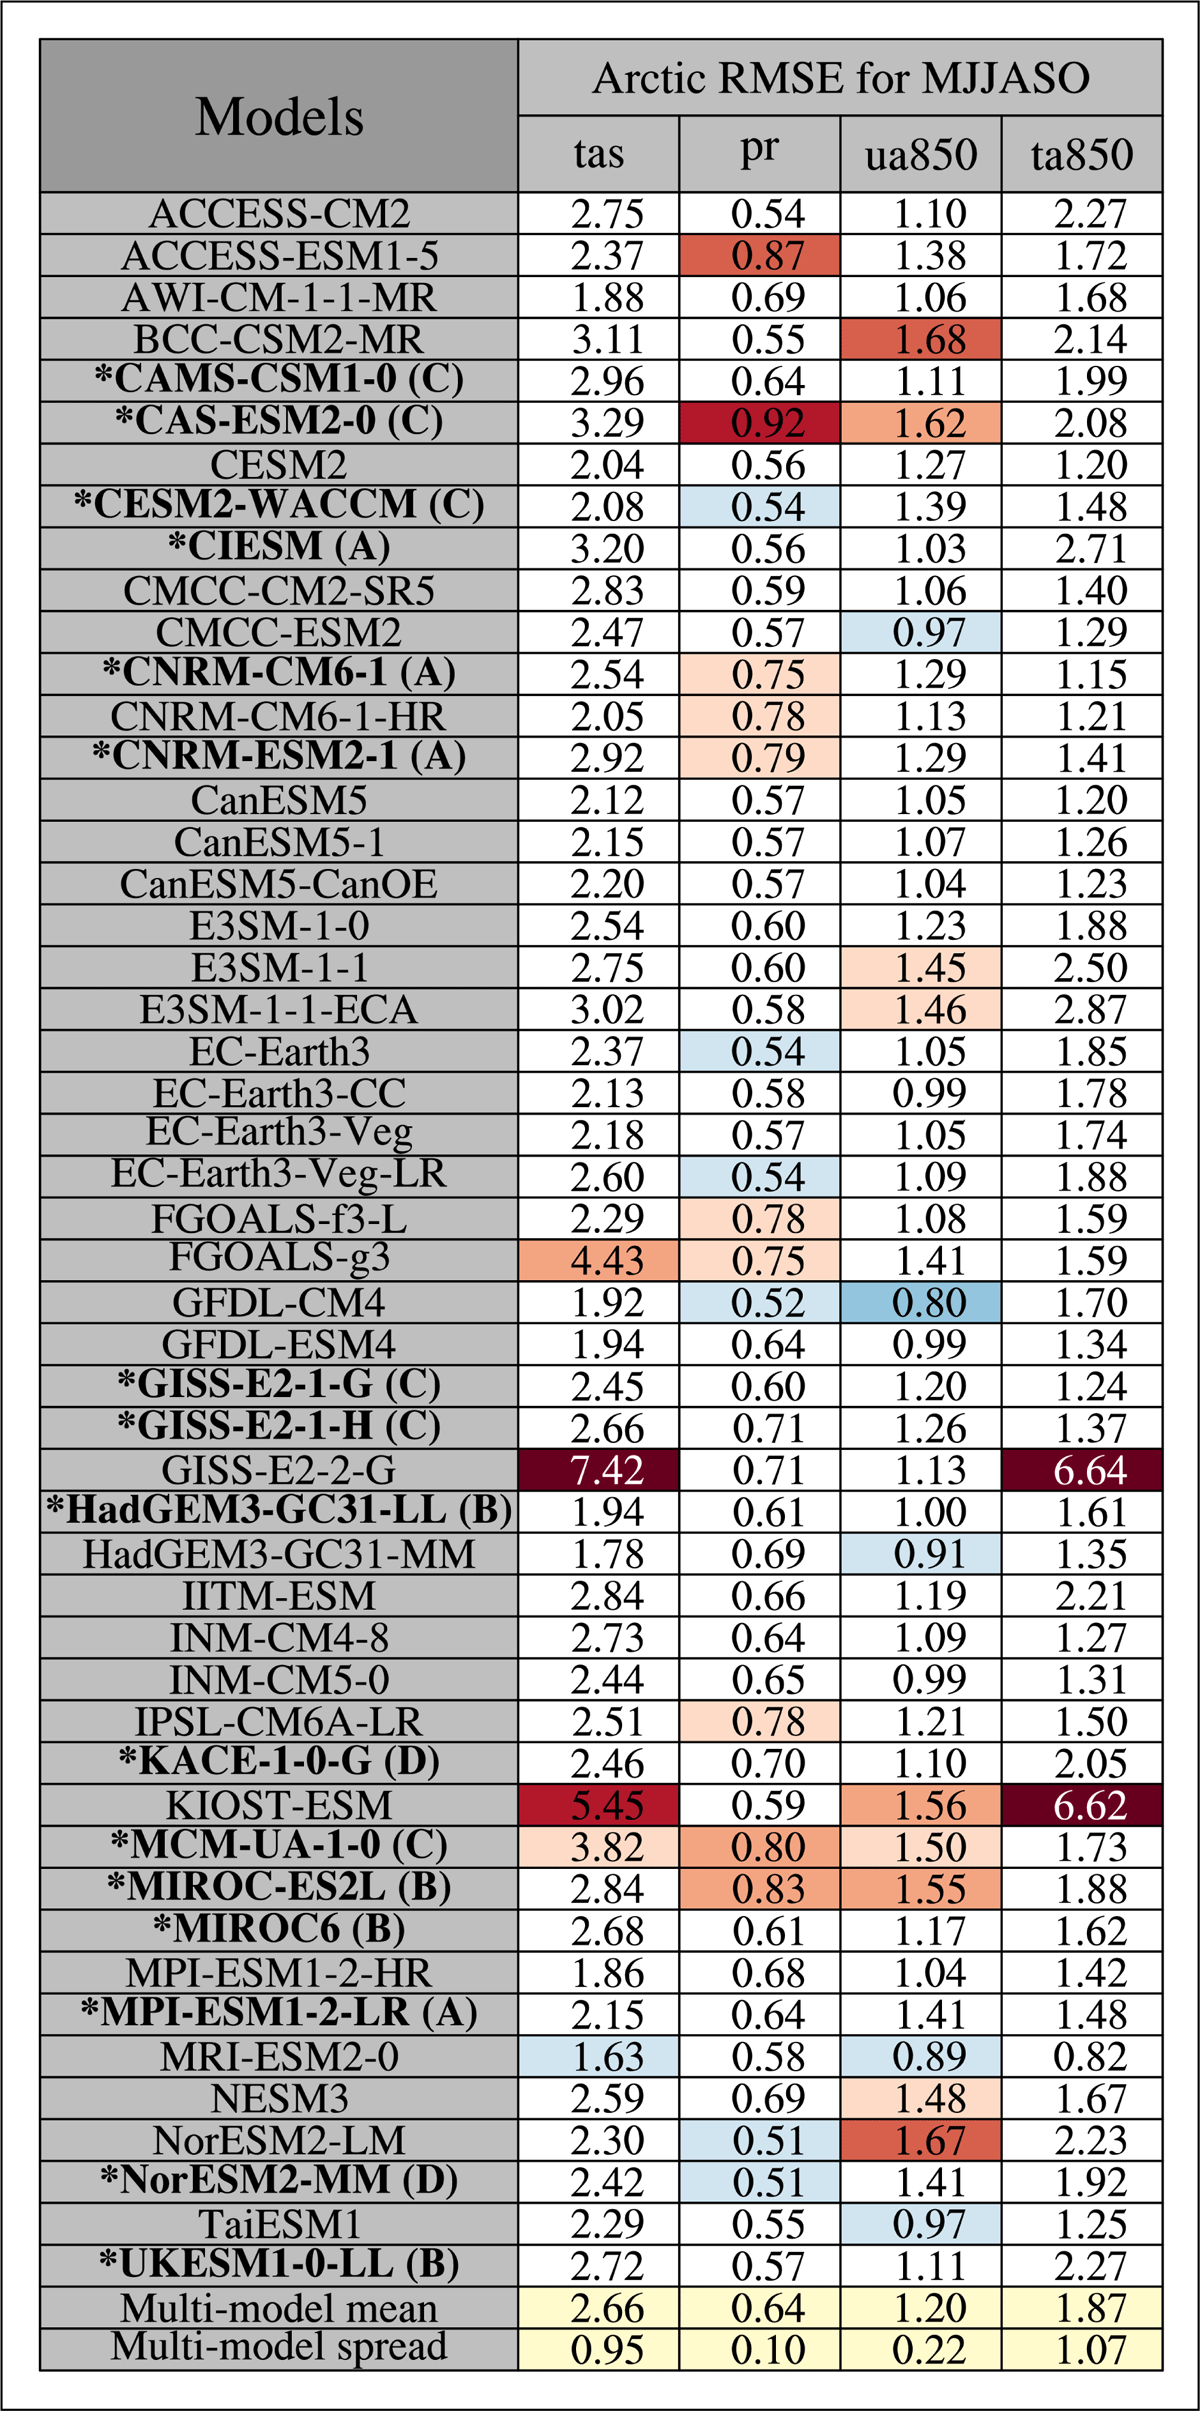
Figure 2
Overview of models (sorted alphabetically; column 1) and Arctic MJJASO RMSE values for tas (K; column 2), pr (mm day-1; column 3), ua850 (m s-1; column 4), and ta850 (K; column 5). Cells with blue/red shading indicate that the RMSE values are lower/larger than the multi-model mean by one standard deviation or more, and the darker the shading the more the value deviates. The multi-model mean RMSE and spread (one standard deviation) is given in the two bottom rows (yellow shading). Candidate models for Arctic storylines are shown in bold with a preceding asterisk and with the storyline (A/B/C/D) given in a parenthesis following the model name.
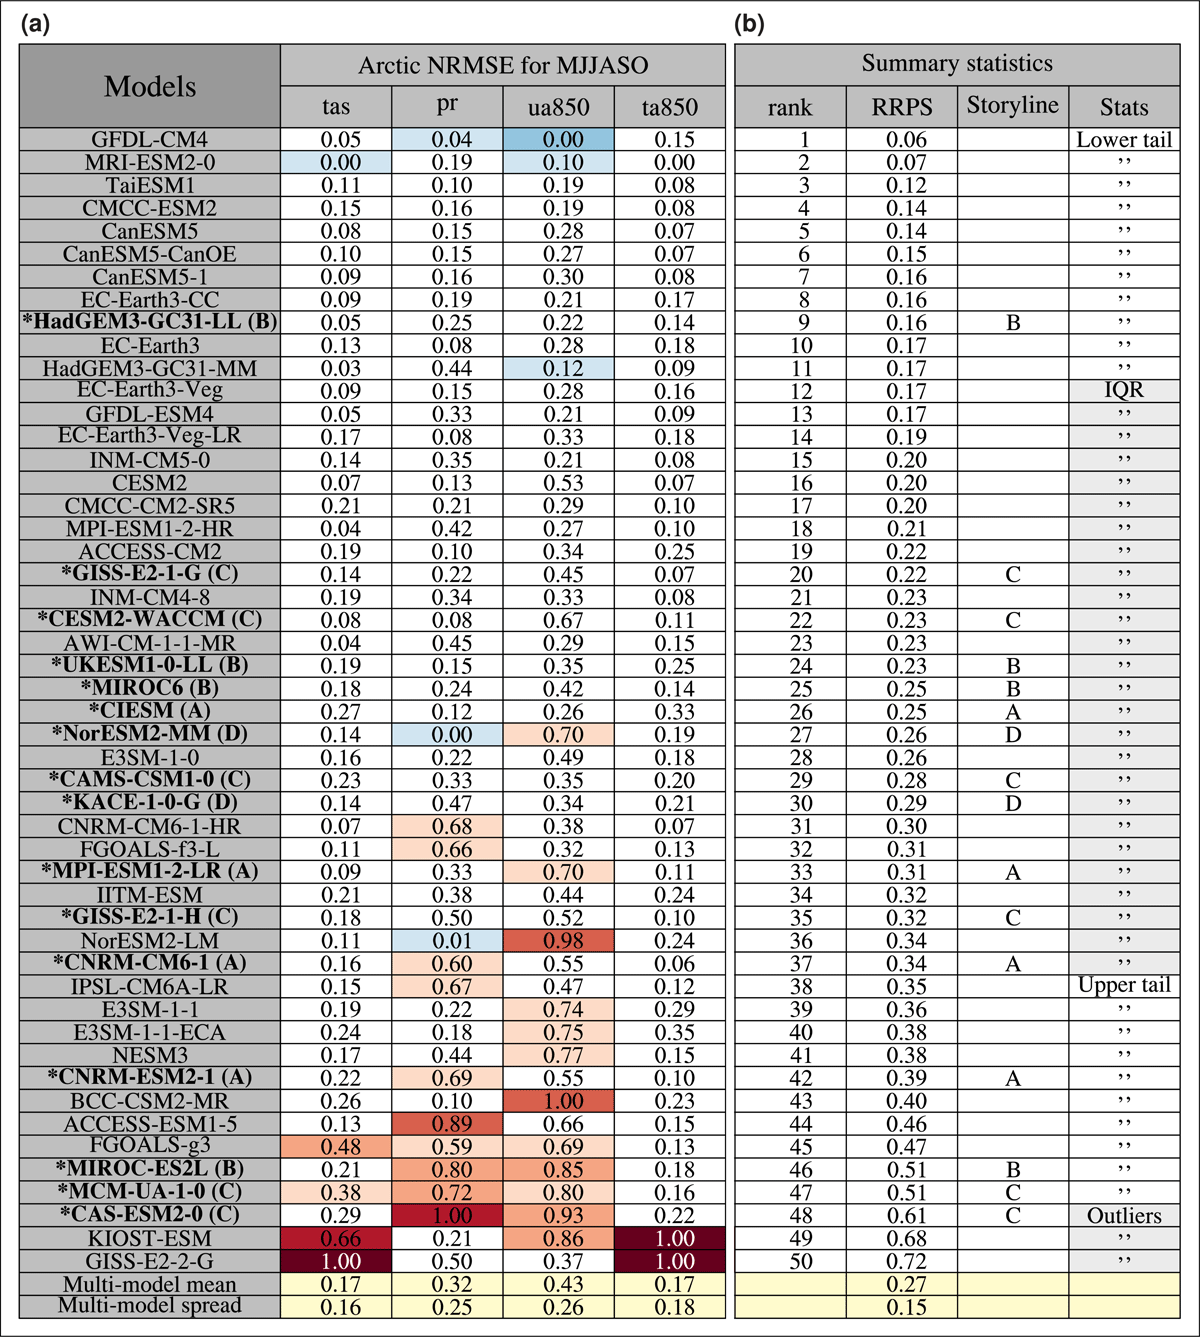
Figure 3
Overview of Arctic MJJASO NRMSE values, ranks, scores (RRPS), storylines, and quartile bins. Panel a is the same as Figure 2, but for the normalized RMSE (NRMSE) values. Panel b shows the ranks (column 1), scores (defined in section 3; column 2), the storylines for which the model is a candidate for (if any; column 3), and quartile bins (stats; column 4), indicating whether the model belongs to the lower tail, the IQR, the upper tail, or is an outlier. The IQR and outliers are highlighted in gray for readability. The models are sorted by the score, with the best model (lowest score) at the top.
Table 2
Overview of MJJASO scores (RRPS) and overall fit for the whole (total) Arctic, Arctic land, and Arctic sea for the storyline candidate models. We use the model abbreviations defined in Table 1, repeated here for convenience: A1 (CNRM-CM6-1), A2 (CIESM), A3 (MPI-ESM1-2-LR), A4 (CNRM-ESM2-1), B1 (MIROC-ES2L), B2 (MIROC6), B3 (HadGEM3-GC31-LL), B4 (UKESM1-0-LL), C1 (CESM2-WACCM), C2 (GISS-E2-1-H), C3 (CAMS-CSM1-0), C4 (GISS-E2-1-G), C5 (MCM-UA-1-0), C6 (CAS-ESM2-0), D1 (NorESM2-MM), and D2 (KACE-1-0-G). For each storyline (column 1), the candidate-model abbreviations and their scores and overall fit for the whole Arctic, Arctic land, and Arctic sea are given in columns 2–4 and 5–7; the models are sorted by the score (columns 2–4) and overall fit (columns 5–7) with the best values on top.
| STORYLINE | ARCTIC MJJASO RRPS | ARCTIC MJJASO OVERALL FIT | ||||
|---|---|---|---|---|---|---|
| TOTAL | LAND | SEA | TOTAL | LAND | SEA | |
| A | A2 (0.25) | A2 (0.24) | A3 (0.23) | A2 (0.11) | A1 (0.10) | A2 (0.10) |
| A3 (0.31) | A1 (0.27) | A2 (0.24) | A1 (0.13) | A2 (0.10) | A3 (0.11) | |
| A1 (0.34) | A3 (0.32) | A1 (0.35) | A3 (0.15) | A3 (0.15) | A1 (0.13) | |
| A4 (0.39) | A4 (0.33) | A4 (0.38) | A4 (0.24) | A4 (0.20) | A4 (0.23) | |
| B | B3 (0.16) | B3 (0.15) | B2 (0.16) | B2 (0.04) | B2 (0.05) | B2 (0.03) |
| B4 (0.23) | B4 (0.21) | B3 (0.17) | B1 (0.06) | B1 (0.07) | B1 (0.04) | |
| B2 (0.25) | B2 (0.29) | B4 (0.24) | B3 (0.12) | B3 (0.11) | B3 (0.12) | |
| B1 (0.51) | B1 (0.55) | B1 (0.36) | B4 (0.17) | B4 (0.16) | B4 (0.18) | |
| C | C4 (0.22) | C4 (0.21) | C1 (0.20) | C1 (0.02) | C1 (0.02) | C1 (0.02) |
| C1 (0.23) | C1 (0.22) | C4 (0.23) | C2 (0.04) | C2 (0.03) | C2 (0.04) | |
| C3 (0.28) | C3 (0.25) | C3 (0.28) | C3 (0.04) | C3 (0.04) | C3 (0.04) | |
| C2 (0.32) | C2 (0.30) | C2 (0.33) | C4 (0.06) | C4 (0.05) | C4 (0.06) | |
| C5 (0.51) | C6 (0.52) | C5 (0.40) | C5 (0.19) | C5 (0.21) | C5 (0.15) | |
| C6 (0.61) | C5 (0.54) | C6 (0.62) | C6 (0.33) | C6 (0.29) | C6 (0.34) | |
| D | D1 (0.26) | D1 (0.21) | D1 (0.27) | D1 (0.04) | D1 (0.03) | D1 (0.04) |
| D2 (0.29) | D2 (0.26) | D2 (0.31) | D2 (0.19) | D2 (0.17) | D2 (0.20) | |
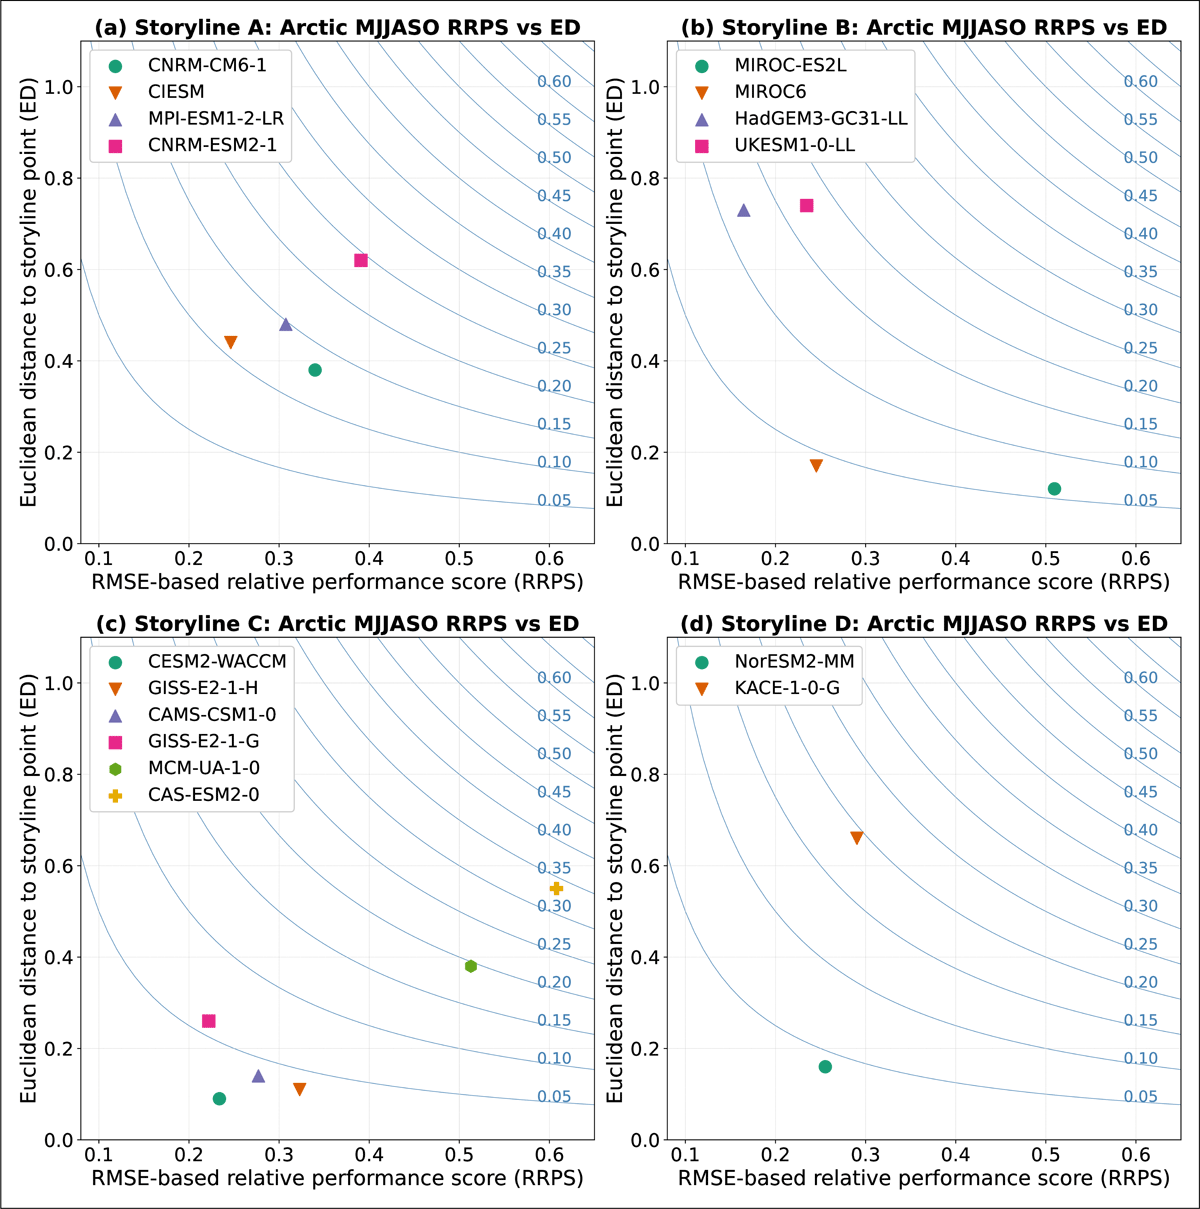
Figure 4
The Arctic MJJASO scores (RRPS) shown against the Euclidean distance (ED; Table 1) for candidate models (legends) for storyline A (panel a), B (panel b), C (panel c), and D (panel d). Also shown are isolines for the overall fit (blue curves with blue numbers), defined as the product of the score and the Euclidean distance (equation 5).
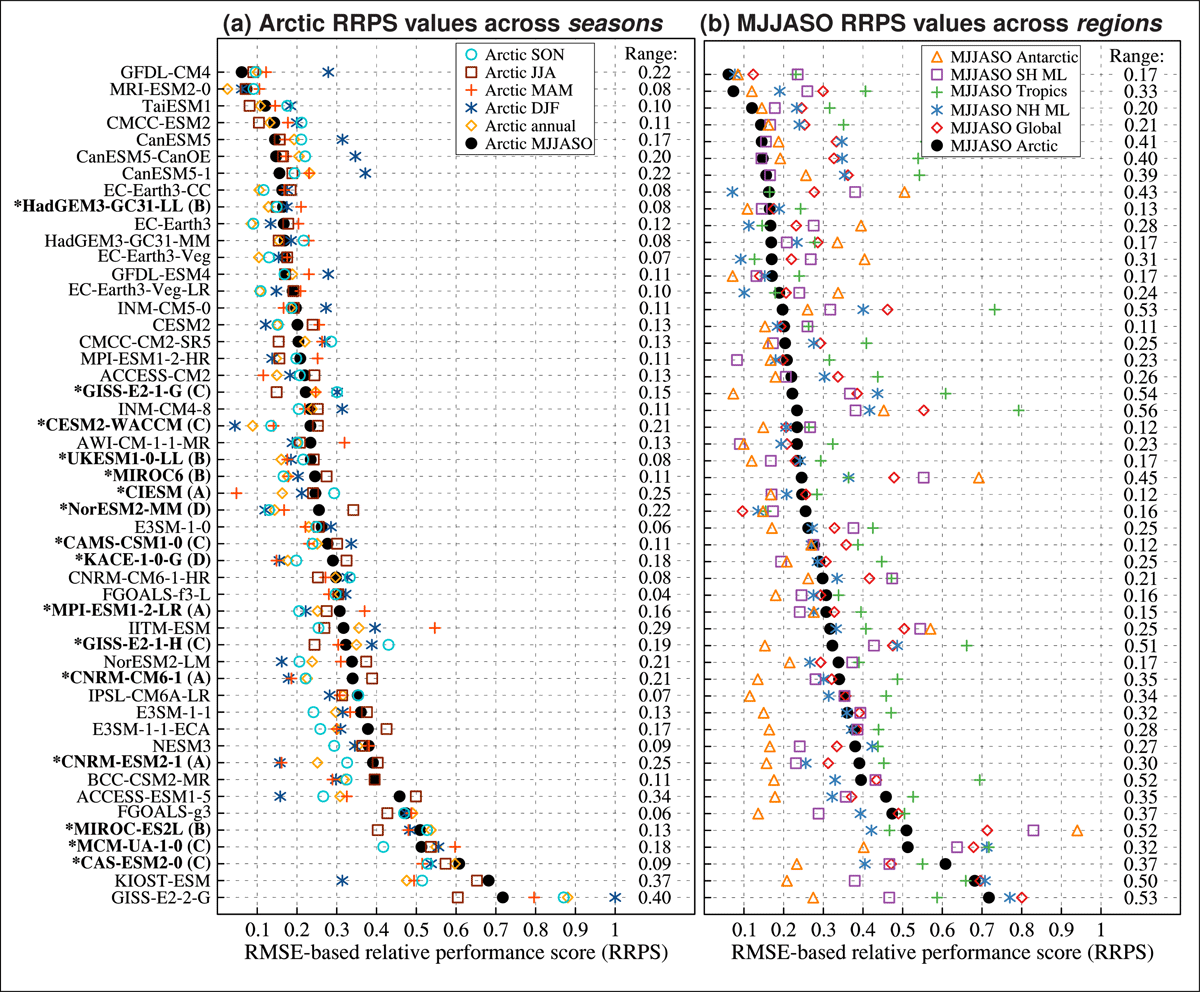
Figure 5
Arctic scores (RRPS) for different seasons (a) and MJJASO scores for different regions (b). In (a), Arctic scores are shown for MJJASO (black dots), annual (orange diamonds), DJF (dark blue asterisks), MAM (light red plus signs), JJA (dark red squares), and SON (cyan open circles). In (b), MJJASO scores are shown for the Arctic (black dots), globe (red diamonds), NH mid-latitudes (NH ML; blue asterisk), tropics (green plus signs), SH mid-latitudes (SH ML; purple squares), and Antarctic (orange triangles). In both panels, the range between the smallest and largest scores for each model is given on the right side, and the models are sorted by the Arctic MJJASO scores (black dots). Models that are candidates for Arctic storylines are denoted as in Figure 2.
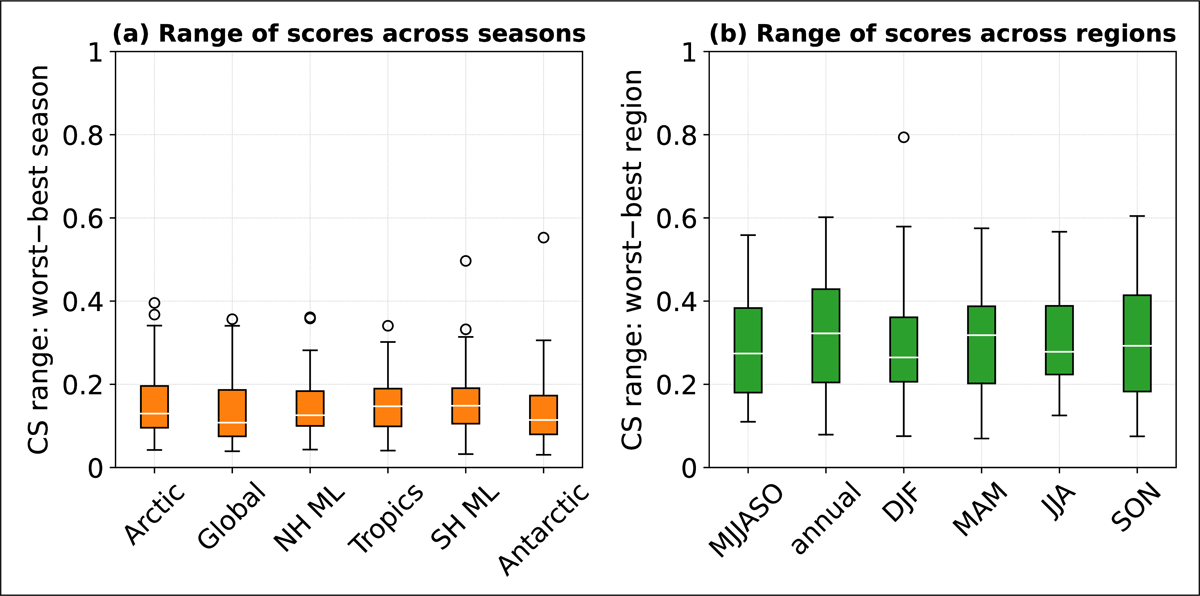
Figure 6
Distributions of the range of scores (RRPS) across seasons (a) and regions (b). In (a), the ranges are defined as the difference between the season with the largest and smallest score for each model (as in Figure 5a), with the distributions based on the values from the 50 models shown separately for each region (orange boxes). In (b), the ranges are defined as the difference between the region with the largest and smallest score for each model (as in Figure 5b), with the distributions shown separately for each season (green boxes). The box and whiskers show the distribution for the 50 models with the boxes extending from the first to the third quartiles, the median shown as a white horizontal line, and the whiskers extending to the farthest data point or maximum 1.5 times the inter-quartile range. Scores that are more than 1.5 times the inter-quartile range from the box edge are defined as outliers and drawn as open circles.
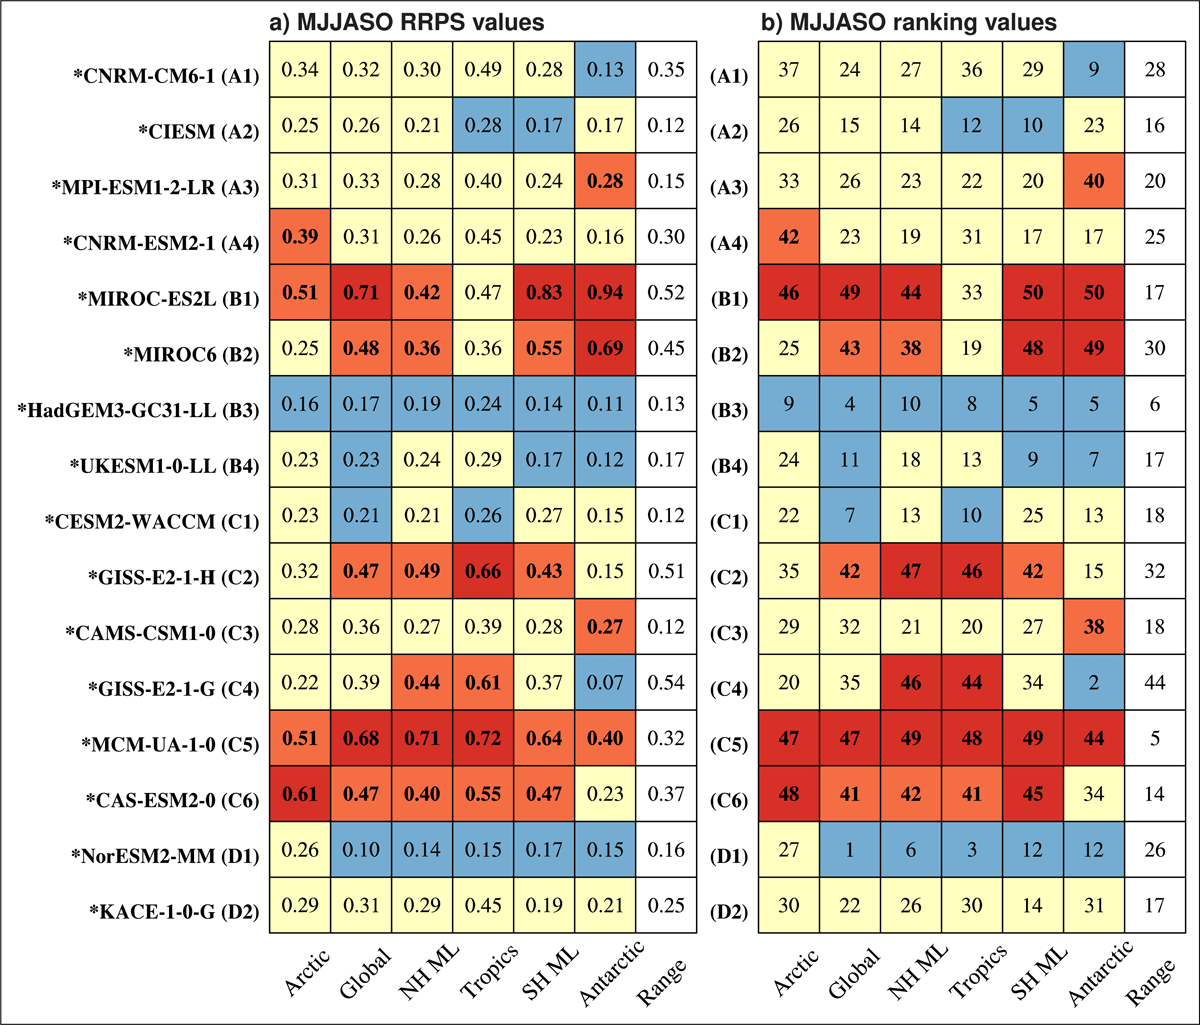
Figure 7
MJJASO scores (RRPS; a) and ranks (b) for the storyline candidate models for the Arctic (column 1), globe (column 2), NH mid-latitudes (NH ML; column 3), tropics (column 4), SH mid-latitudes (SH ML; column 5), and the Antarctic (column 6). Also shown is the range of values for each model (column 7), computed as the difference between the largest and smallest scores (a) and ranks (b) for each model. The colors indicate whether the values are within the lower tail (blue cells), within the IQR (yellow cells), within the upper tail (light red cells), or outlier values (dark red cells) based on percentiles computed separately for each region, using values from the full set of models. Bold values indicate that the scores (a) or ranks (b) exceed the 75th percentile. The model names follow the convention from Figure 2 and the sorting is as in Table 1. Note that the scores and ranks are relative to the full set of models.
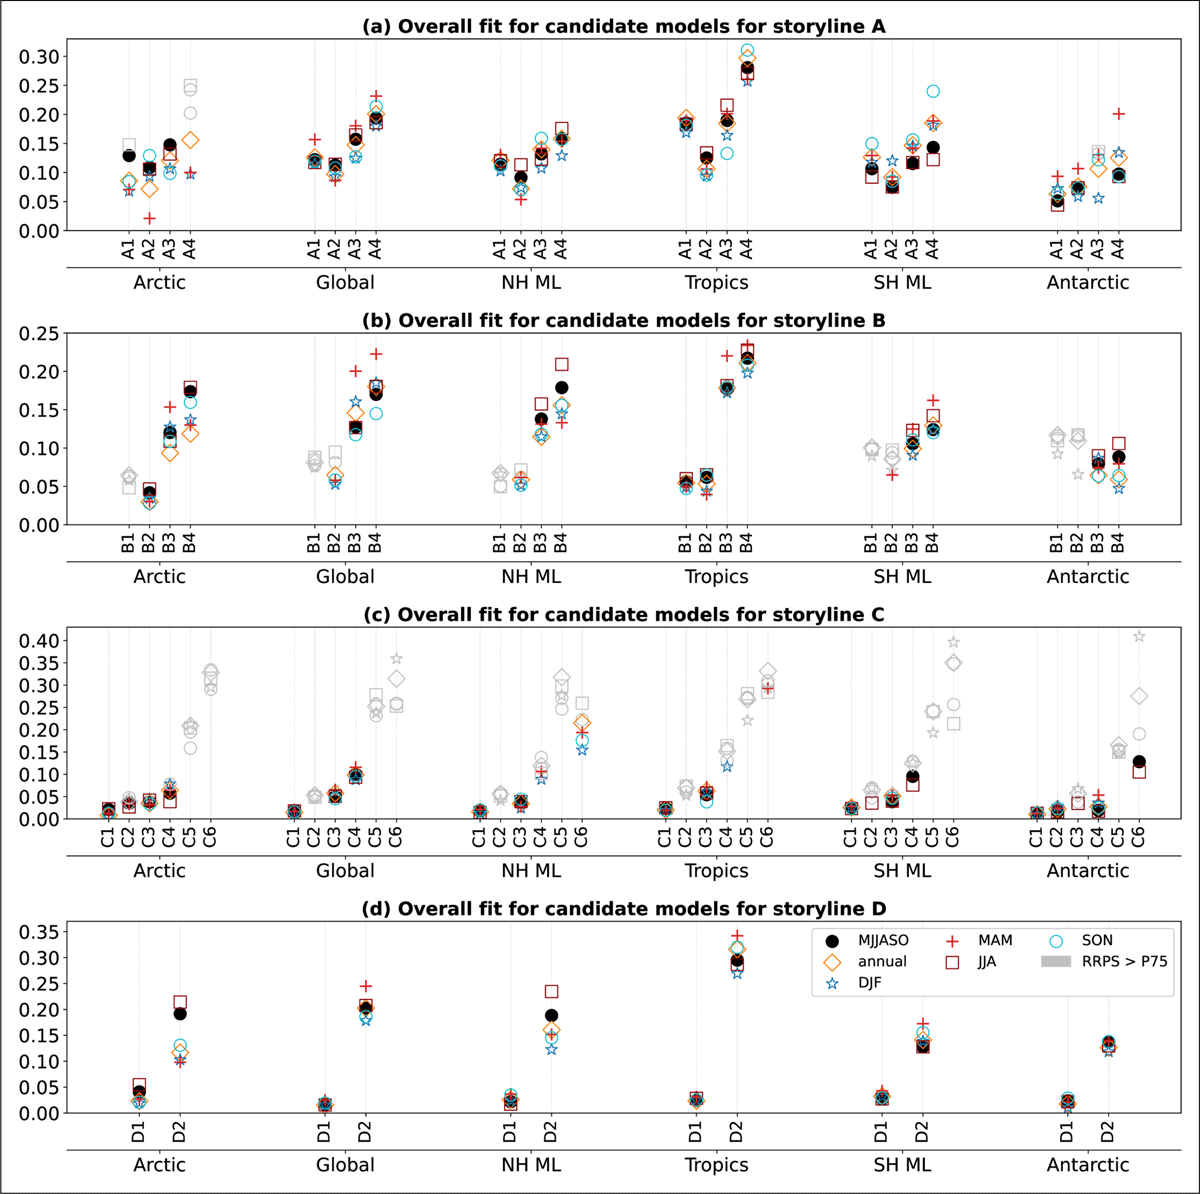
Figure 8
Overview of the overall fit (equation 5) for the candidate models for storylines A (panel a), B (panel b), C (panel c), and D (panel d) for all regions (Arctic, global, NH mid-latitudes (ML), tropics, SH ML, and Antarctic) and seasons (MJJASO, annual, DJF, MAM, JJA, and SON). We use the model abbreviations defined in Table 1, repeated here for convenience: A1 (CNRM-CM6-1), A2 (CIESM), A3 (MPI-ESM1-2-LR), A4 (CNRM-ESM2-1), B1 (MIROC-ES2L), B1 (MIROC6), B3 (HadGEM3-GC31-LL), B4 (UKESM1-0-LL), C1 (CESM2-WACCM), C2 (GISS-E2-1-H), C3 (CAMS-CSM1-0), C4 (GISS-E2-1-G), C5 (MCM-UA-1-0), C6 (CAS-ESM2-0), D1 (NorESM2-MM), and D2 (KACE-1-0-G). For each storyline, region, and candidate model, the overall fit for the whole year and the different seasons (legend in d) are shown in separate vertical stacks. To highlight the overall fit for models with relatively low scores, markers are shown in gray when the associated scores exceed the 75th percentile for the relevant region and season. Note that the y-axis varies between panels.