
Figure 1
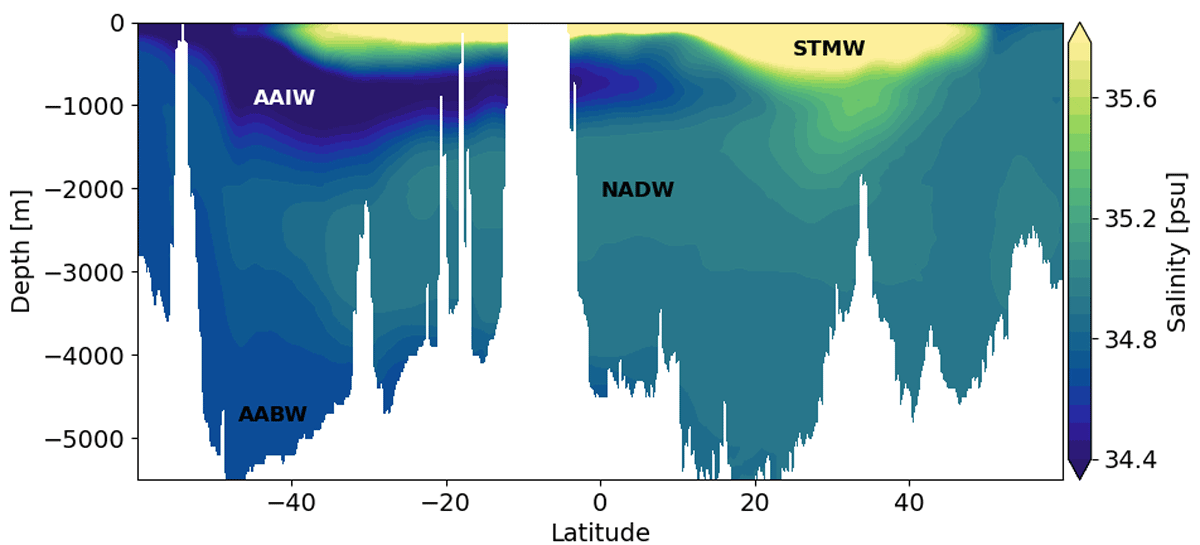
Realistic water mass structure. Salinities from the World Ocean Atlas 2018 along a meridional section at 37°W in the Atlantic basin. The main water masses are labelled as Antarctic Intermediate Water (AAIW), SubTropical Mode Water (STMW), North Atlantic Deep Water (NADW), and Antarctic Bottom Water (AABW).
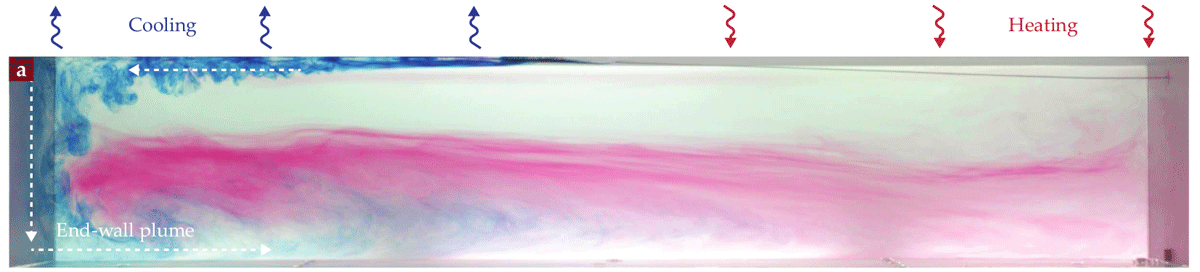
Figure 2
Horizontal convection. Horizontal convection is illustrated by the flow field from a laboratory experiment in a 3D rectangular box domain. The dye visualization shows the flow path from the heated region to the cooled region (right to left) along the upper boundary and broader bottom flow in the opposite direction. A full-depth end-wall plume is observed against the wall at the cooled end of the domain. Adapted from Gayen and Klocker (2024).
Table 1
Model experiments. “Basins” refers to either one narrow basin or two basins with a narrow basin representative of the Atlantic and a wide basin representative of the Pacific. “Salinity narrow basin” is the salinity that is being restored to at the northern boundary of either the single basin or the narrow basin in two-basin simulations. “Sea ice” refers to whether or not salinity at the surface is enhanced to psu adjacent to the southern boundary to simulate brine rejection. “Rotation” refers to either normal planetary rotation of Earth or zero rotation. Experiments with a depth shallower than 5000 m are spun up from the end of experiment singlebasin, requiring a much shorter spinup.
| MODEL EXPERIMENTS | ||||||
|---|---|---|---|---|---|---|
| SIMULATION NAME | BASINS | SALINITY NARROW BASIN | SEA ICE | ROTATION | SPIN UP | DEPTH |
| singlebasin | 1 basin | SN = 36psu | no | Earth | 4000 years | 5000 meters |
| singlebasin_ice | 1 basin | SN = 36psu | yes | Earth | 4000 years | 5000 meters |
| singlebasin_sym | 1 basin | SN = 34psu | no | Earth | 4000 years | 5000 meters |
| singlebasin_ice_norot | 1 basin | SN = 36psu | yes | none | 2000 years | 5000 meters |
| singlebasin_1000m | 1 basin | SN = 36psu | no | Earth | 300 years | 1000 meters |
| singlebasin_2000m | 1 basin | SN = 36psu | no | Earth | 300 years | 2000 meters |
| singlebasin_3000m | 1 basin | SN = 36psu | no | Earth | 300 years | 3000 meters |
| singlebasin_4000m | 1 basin | SN = 36psu | no | Earth | 300 years | 4000 meters |
| twobasin | 2 basins | SN = 36psu | no | Earth | 5000 years | 5000 meters |
| twobasin_ice | 2 basins | SN = 36psu | yes | Earth | 5000 years | 5000 meters |
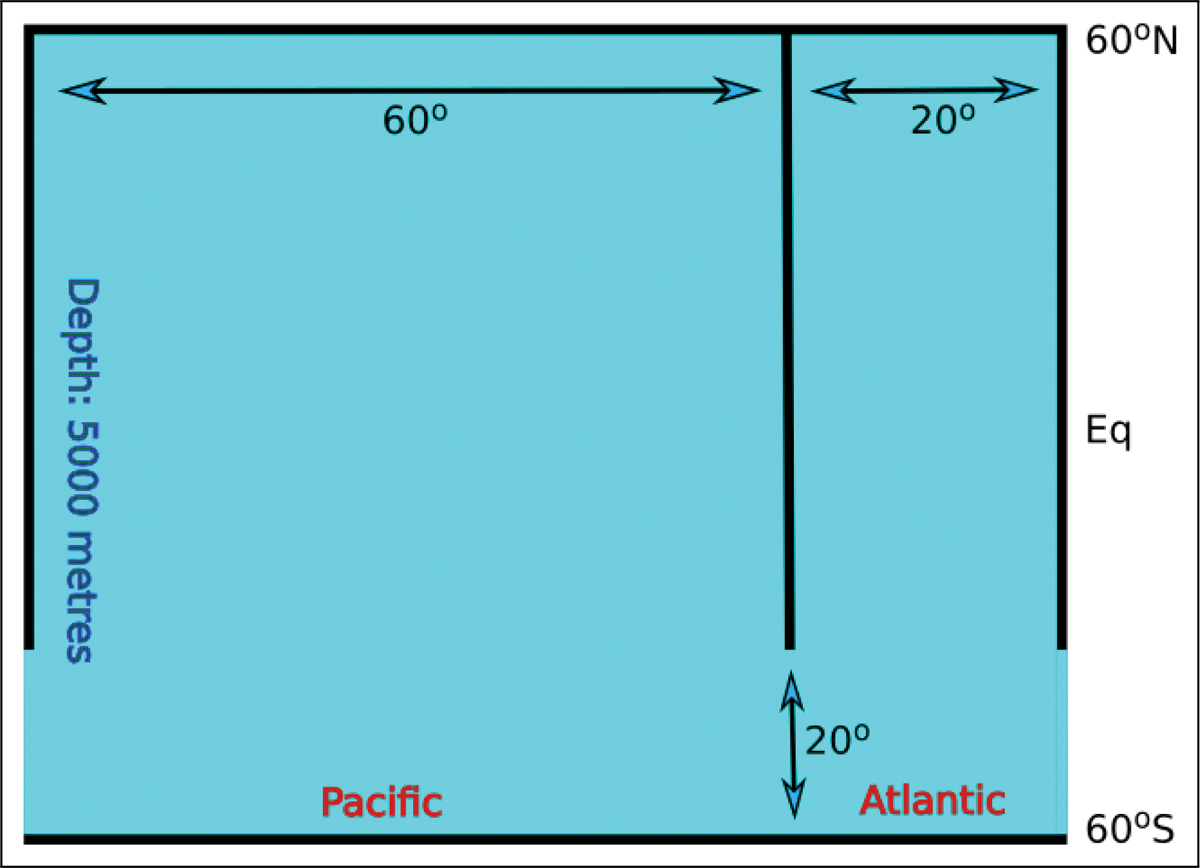
Figure 3
Model domain. Schematic of the two-basin domain with both a large “Pacific” and a small “Atlantic” basin. Single-basin domains are the same as the small basin. Depth is 5000 metres everywhere.
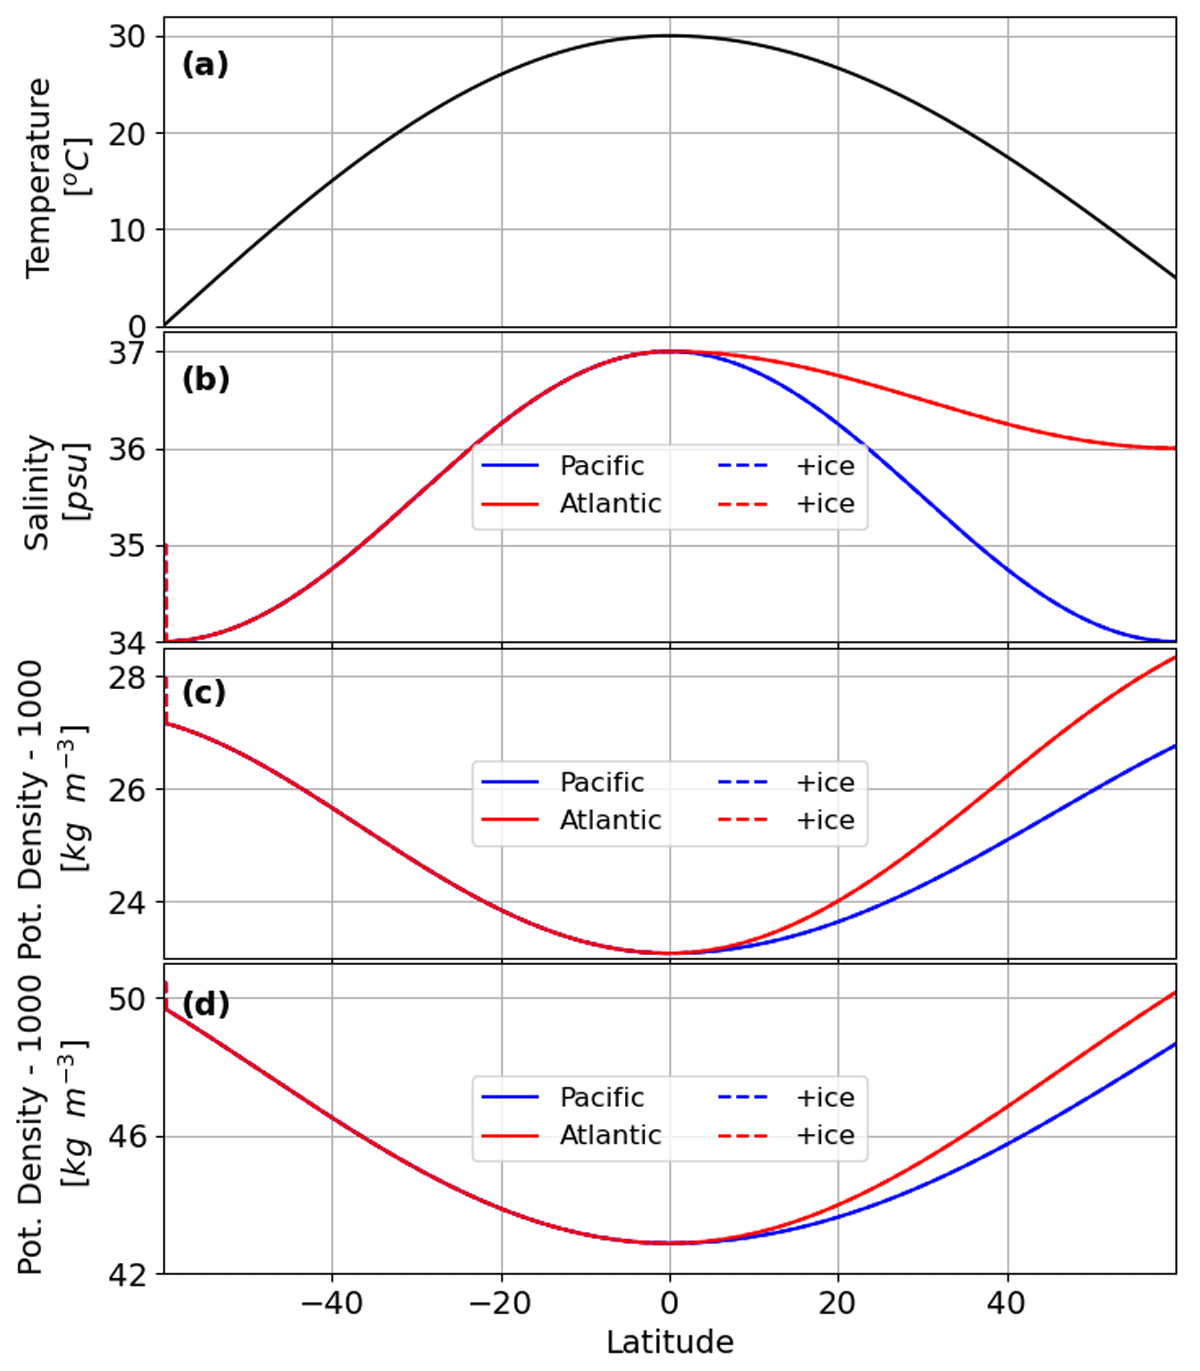
Figure 4
Forcing. (a) Temperature forcing used in all experiments. (b) Salinity forcing for the various experiments and ocean basins. (c) Density calculated from (a) and (b), referenced to the ocean surface. (d) Density calculated from (a) and (b), referenced to the ocean bottom. Differences between (a) and (b) are due to the thermobaric effect. In all single basin experiments, apart from experiment singlebasin_sym, salinity forcing is shown by the red line, and for singlebasin_sym the salinity forcing is shown by the blue line. All two-basin experiments use the salinity forcing shown by the red line for the Atlantic basin and that shown by the blue line for the Pacific basin. If brine rejection by sea ice is simulated in the experiments, salinity at the southern boundary is modified as shown by the red dashed line.
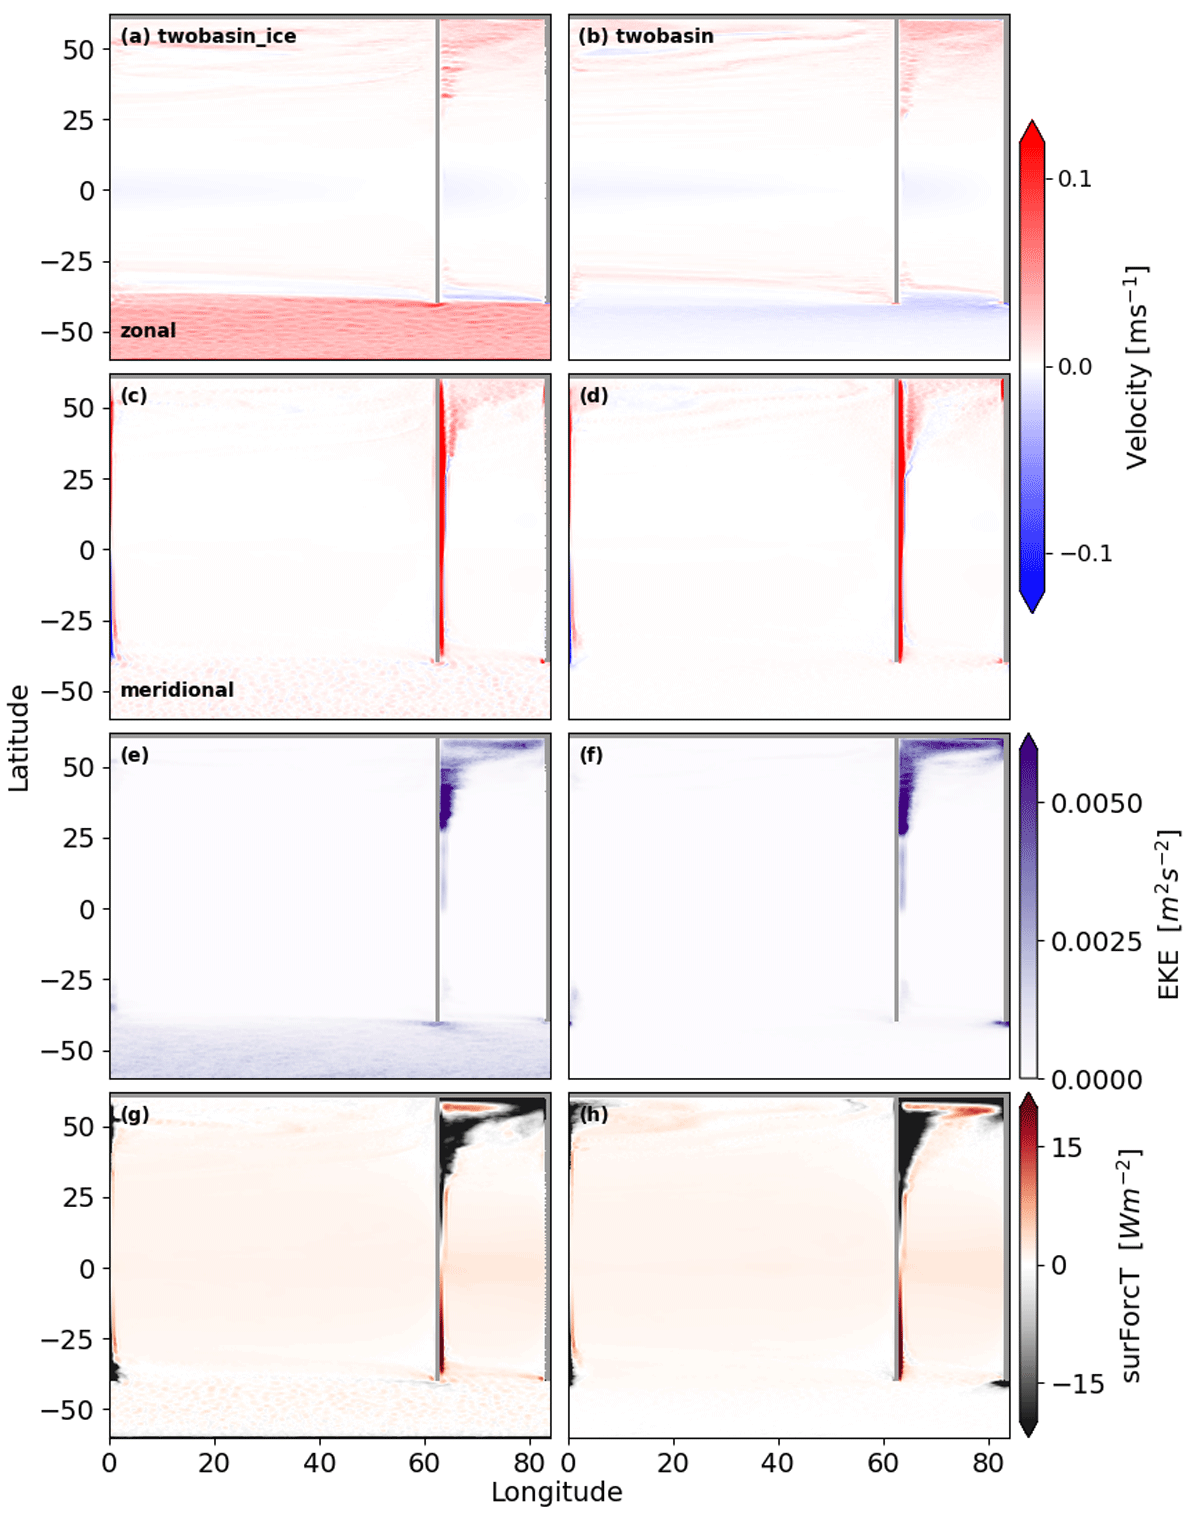
Figure 5
Surface horizontal circulation - two basin. Mean (a,b) zonal velocities , (c,d) meridional velocities , (e,f) eddy kinetic energy , and (g,h) temperature fluxes (positive values show heat uptake into the ocean) at the ocean surface for all two-basin experiments. (a,c,e,g) is for experiment twobasin_ice, and (b,d,f,h) is for experiment twobasin.
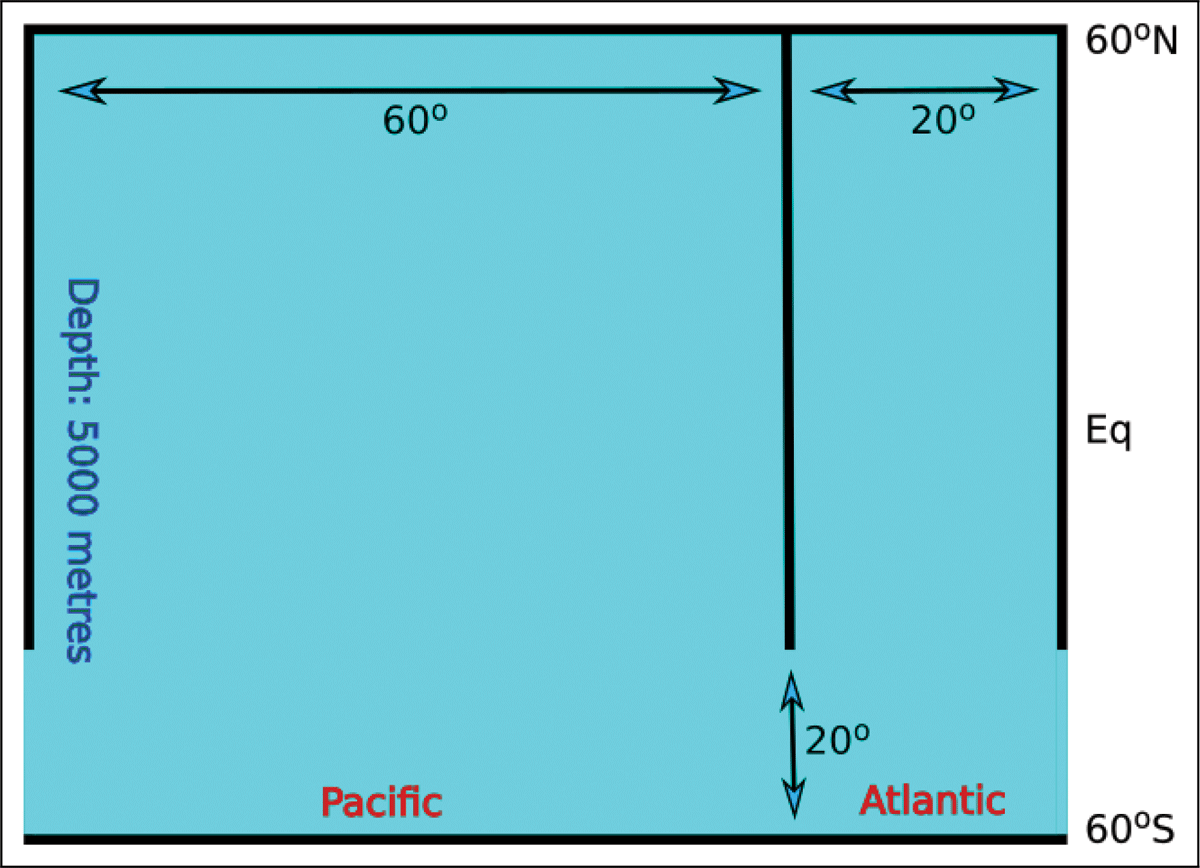
Figure 6
Salinity and overturning circulation in two-basin experiments. Salinity sections and overturning circulation are shown for experiment twobasin_ice in the left row and for experiment twobasin in the right row. Salinity sections are shown along the (a,b) western boundary and (c,d) eastern boundary of the narrow “Atlantic” basin. The overturning circulation is shown integrated across the (e,f) total width of the domain and integrated only across (g,h) the narrow “Atlantic” basin and (i,j) the wide “Pacific” basin, respectively. Green lines show contours of mean potential density referenced to 2000 m, averaged over the respective basins.
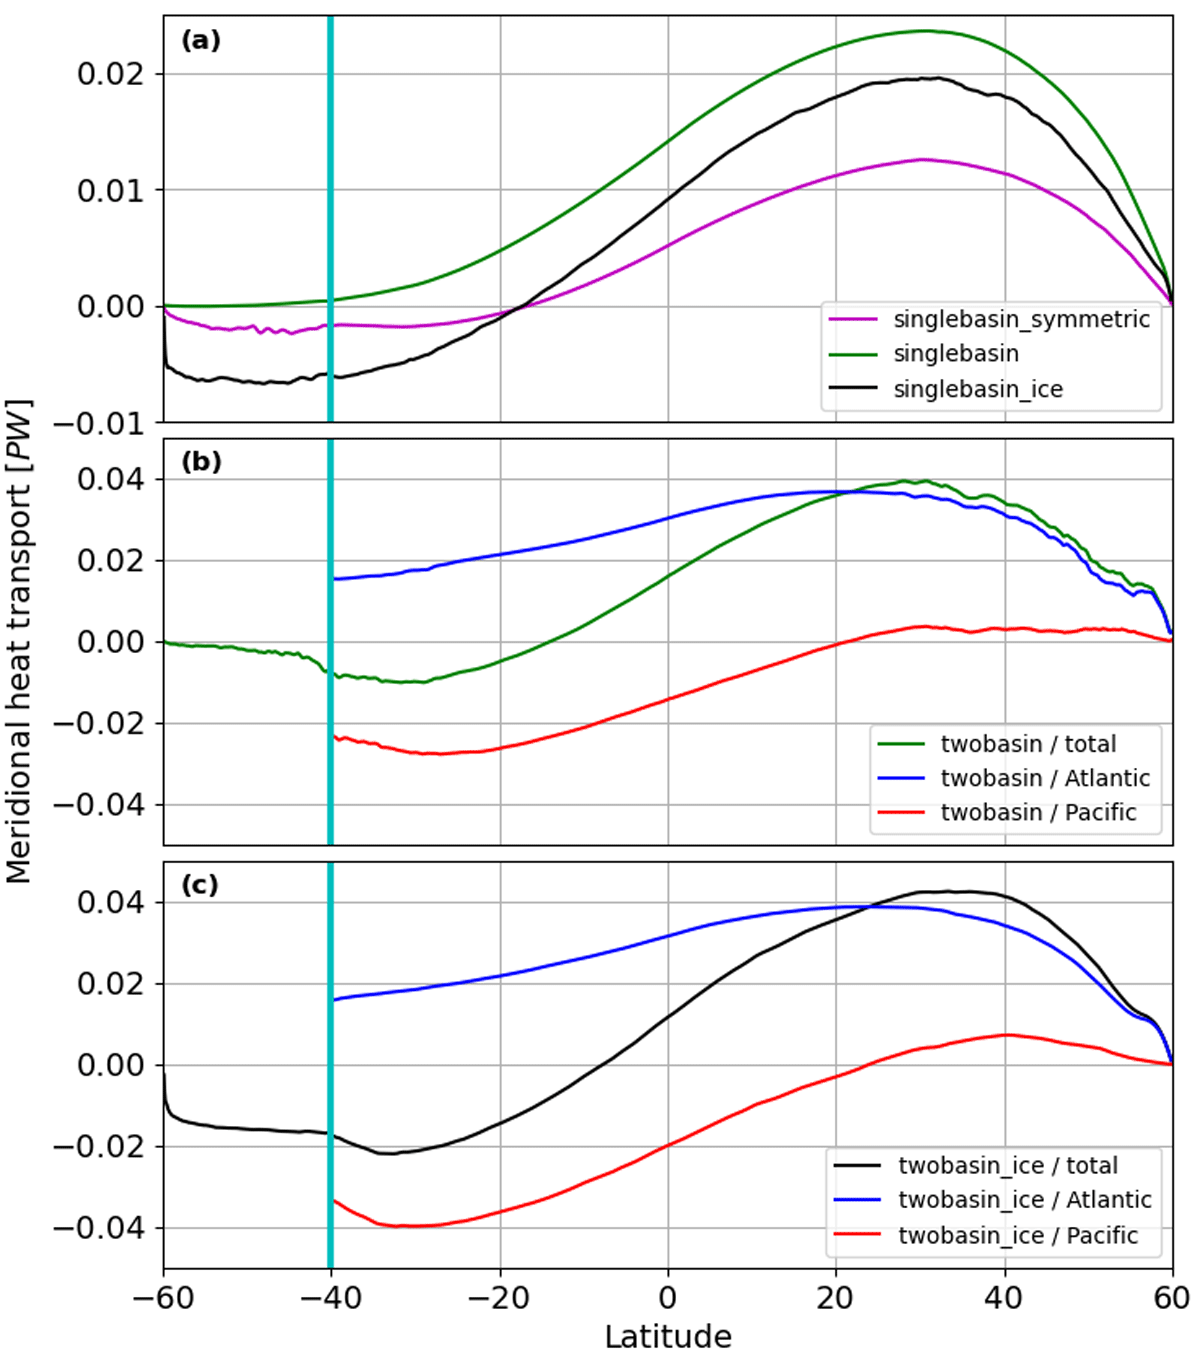
Figure 7
Heat transport. Heat transport for the (a) single basin experiments, (b) experiment twobasin, and (c) experiment twobasin_ice. In (b,c) the two-basin experiments are split into total, Atlantic basin, and Pacific basin. The basin-specific values for the heat transport are masked. The cyan vertical lines show the northern edge of the re-entrant chanel.
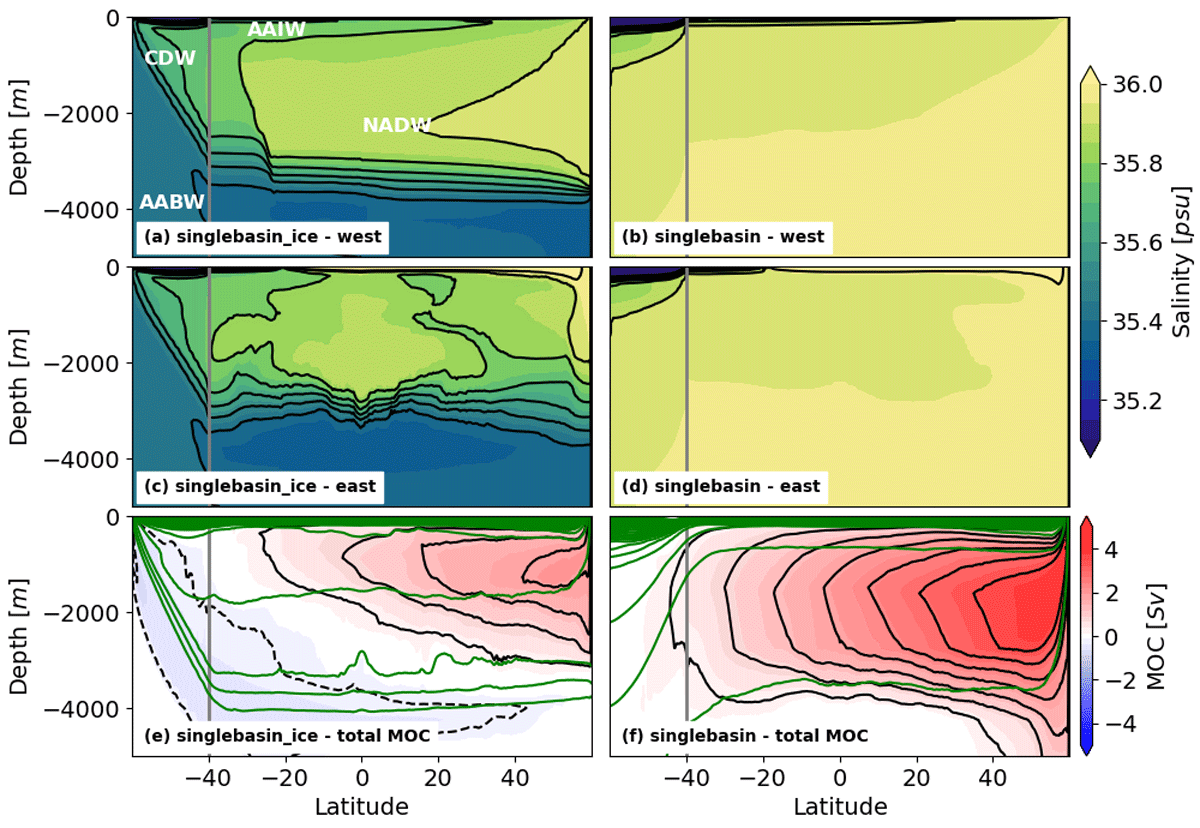
Figure 8
Salinity and overturning circulation in single-basin experiments. Salinity sections and overturning circulation are shown for experiment singlebasin_ice in the left row and for experiment singlebasin in the right row. Salinity sections are shown along the (a,b) western boundary and (c,d) eastern boundary of the domain. (e,f) The overturning circulation is shown integrated across the total width of the domain. Green lines show contours of mean potential density referenced to 2000 m, averaged over the respective basins.
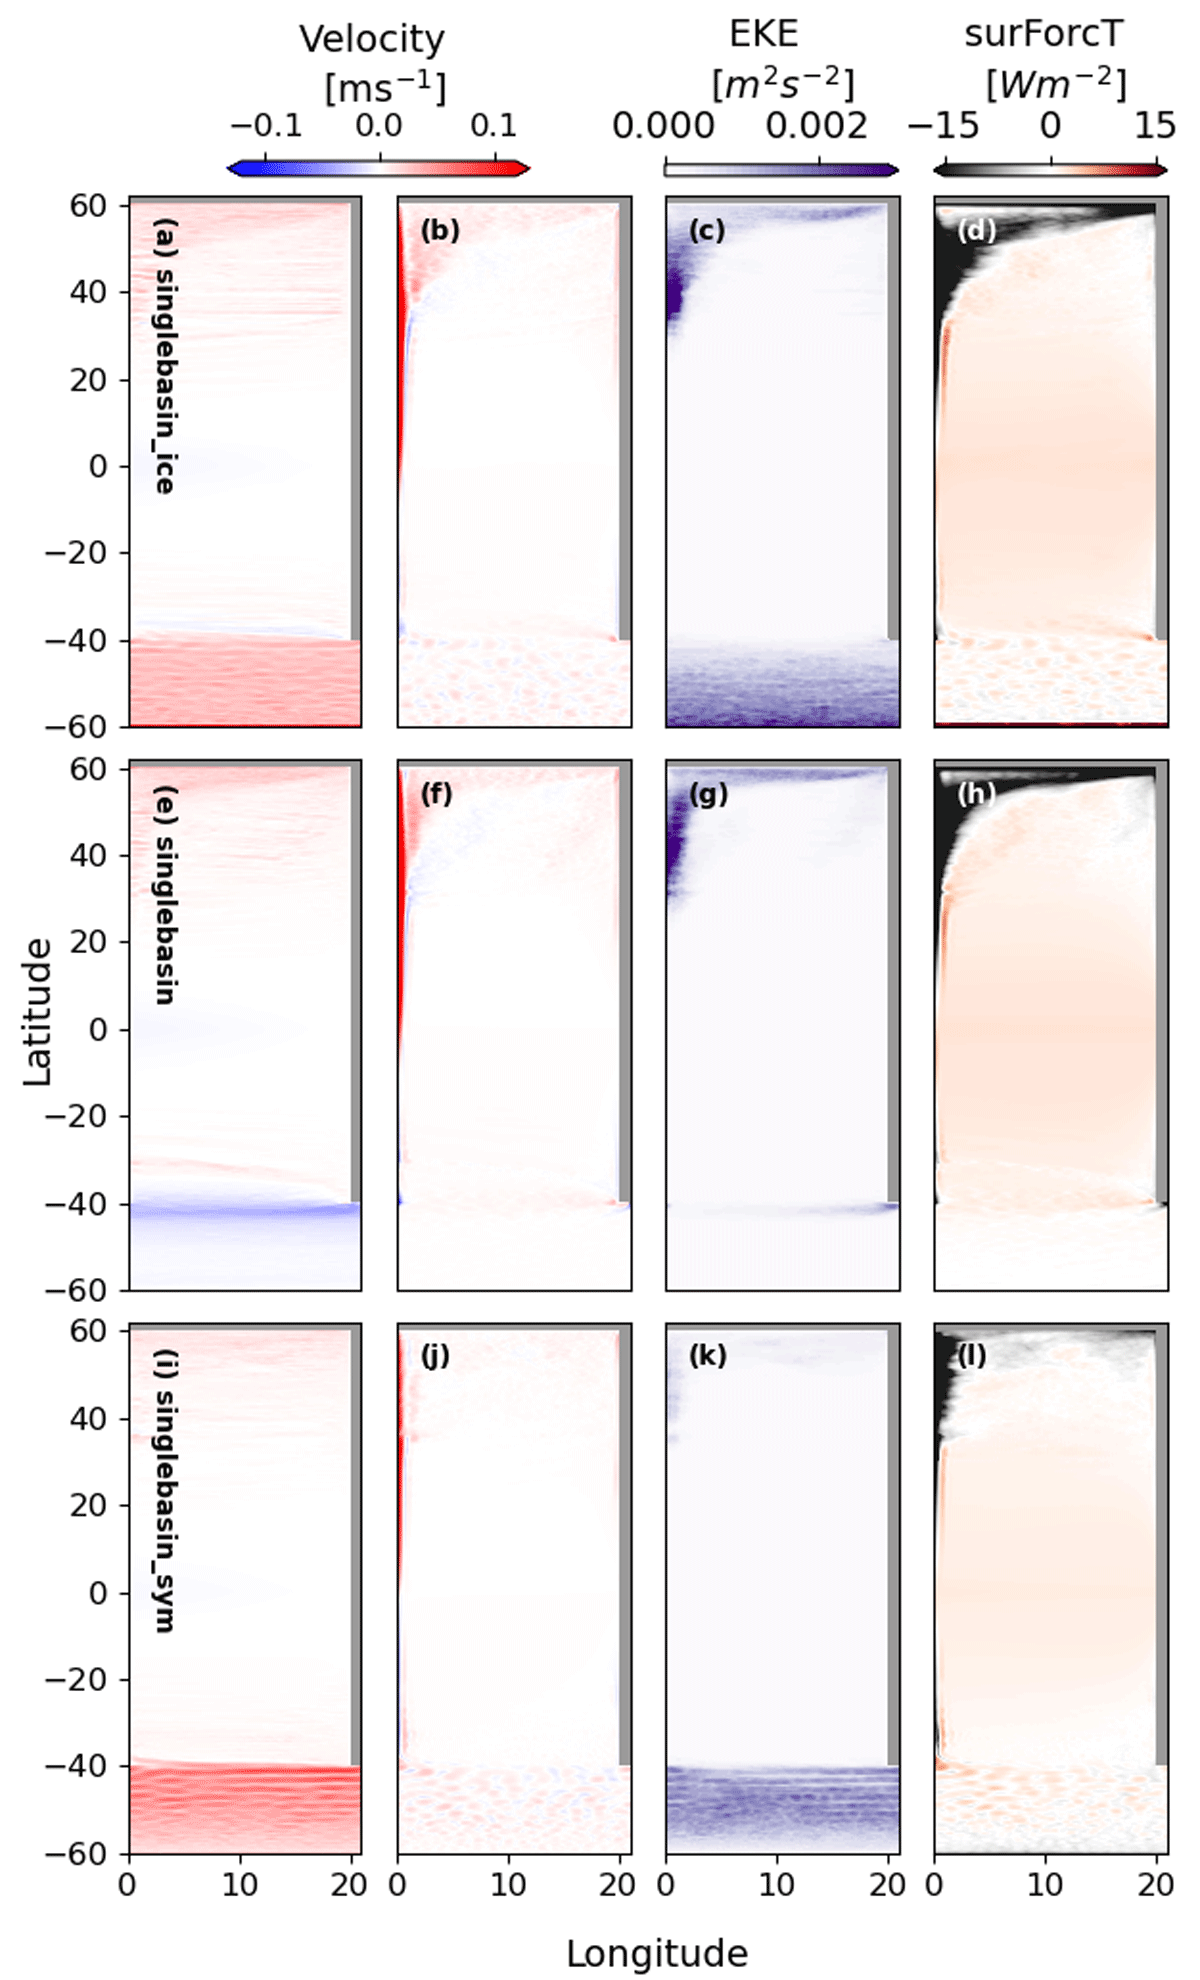
Figure 9
Surface horizontal circulation - single basin. Mean (a,e,i) zonal velocities , (b,f,j) meridional velocities , (c,g,k) eddy kinetic energy , and (d,h,l) temperature fluxes at the ocean surface (positive values show heat uptake into the ocean) for all single basin experiments. (a-d) is for experiment singlebasin_ice, (e-h) is for experiment singlebasin, and (i-l) is for experiment singlebasin_sym.
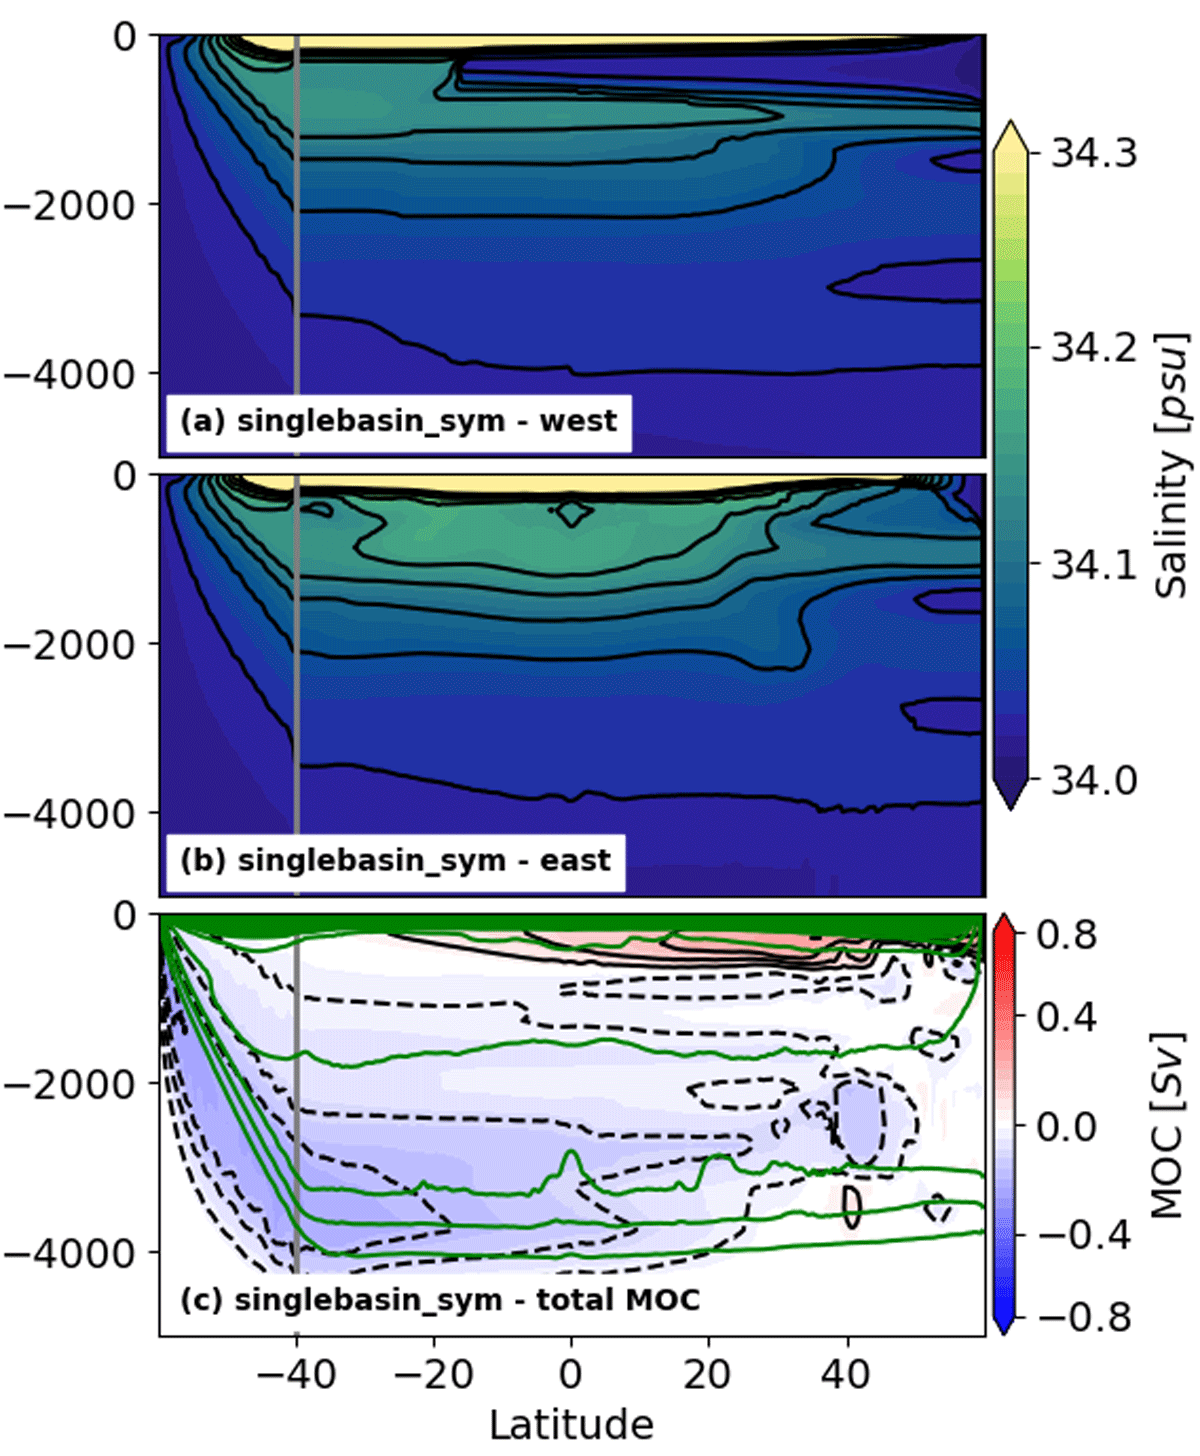
Figure 10
Salinity and overturning circulation for symmetrical salinity forcing. Salinity sections and overturning circulation are shown for experiment singlebasin_sym. Salinity sections are shown along the (a) western boundary and (b) eastern boundary of the basin. (c) The overturning circulation is shown integrated across the total width of the domain. Green lines show contours of potential density referenced to 2000 m.
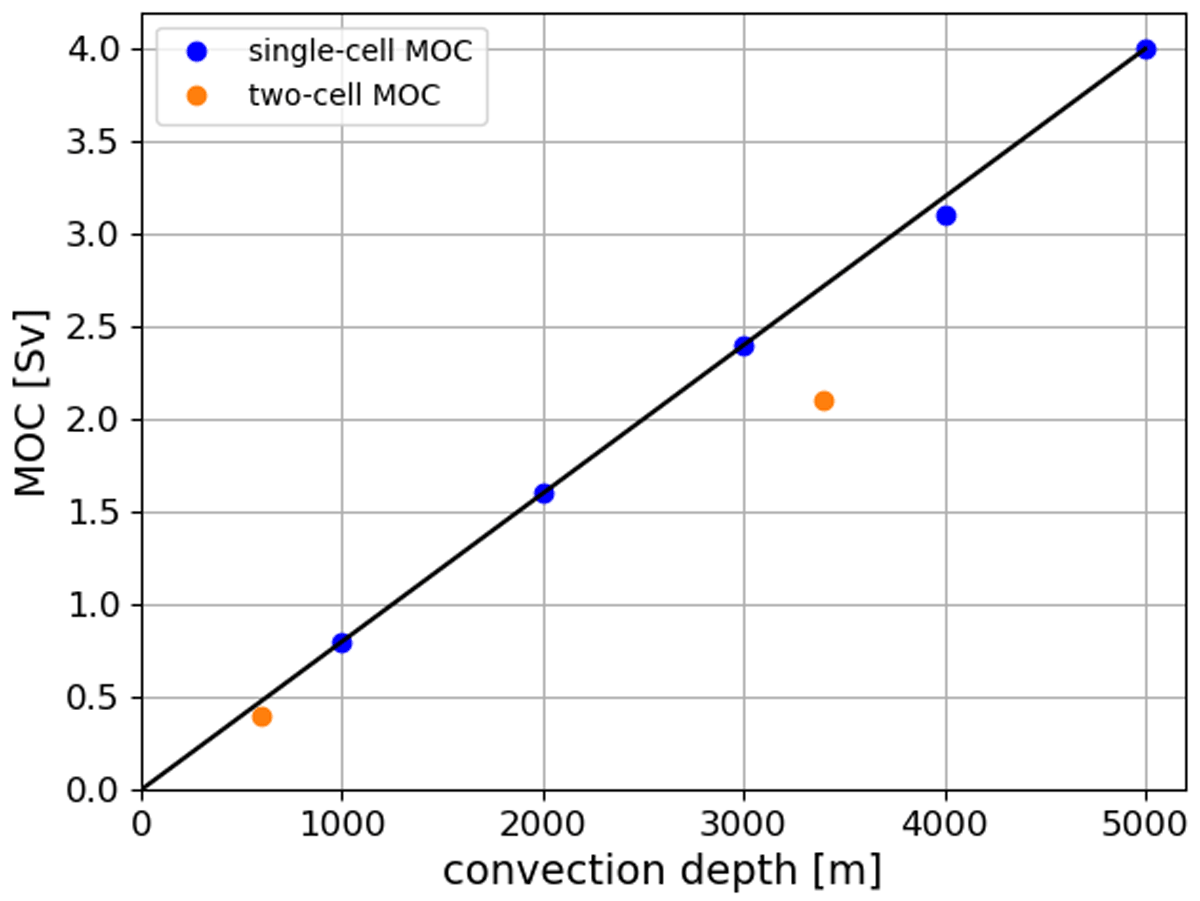
Figure 11
Convection depth vs. overturning strength. Strength of the overturning relative to convection depth is shown for all single-basin experiments. Blue dots show experiments that produce a single overturning cell, and orange dots show experiments that produce two overturning cells.
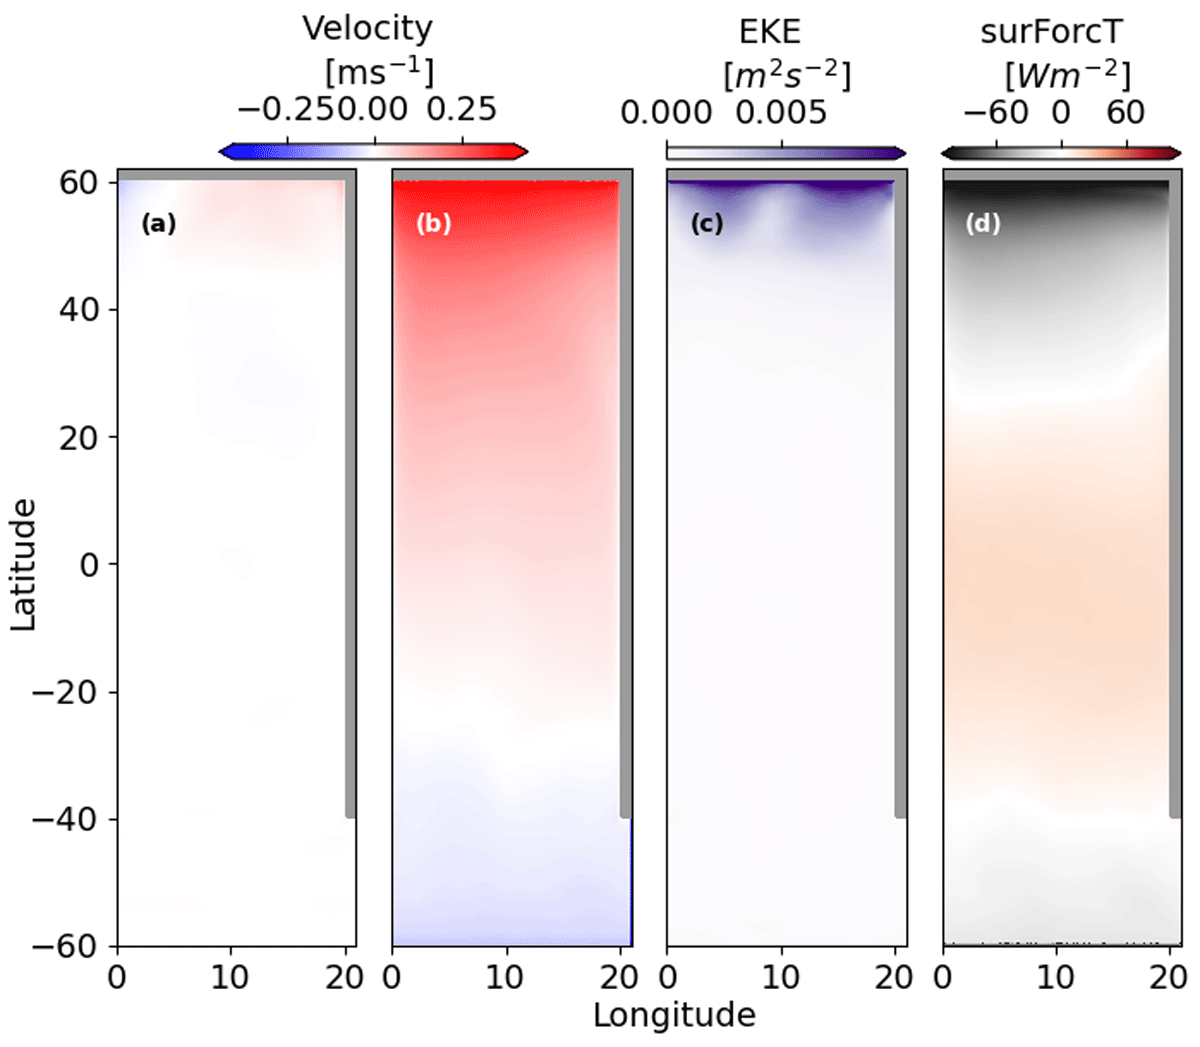
Figure 12
Surface horizontal circulation - singlebasin norot. Mean (a) zonal velocities , (b) meridional velocities , (c) eddy kinetic energy , and (d) temperature fluxes at the ocean surface (positive values show heat uptake into the ocean) for experiment singlebasin_sym.
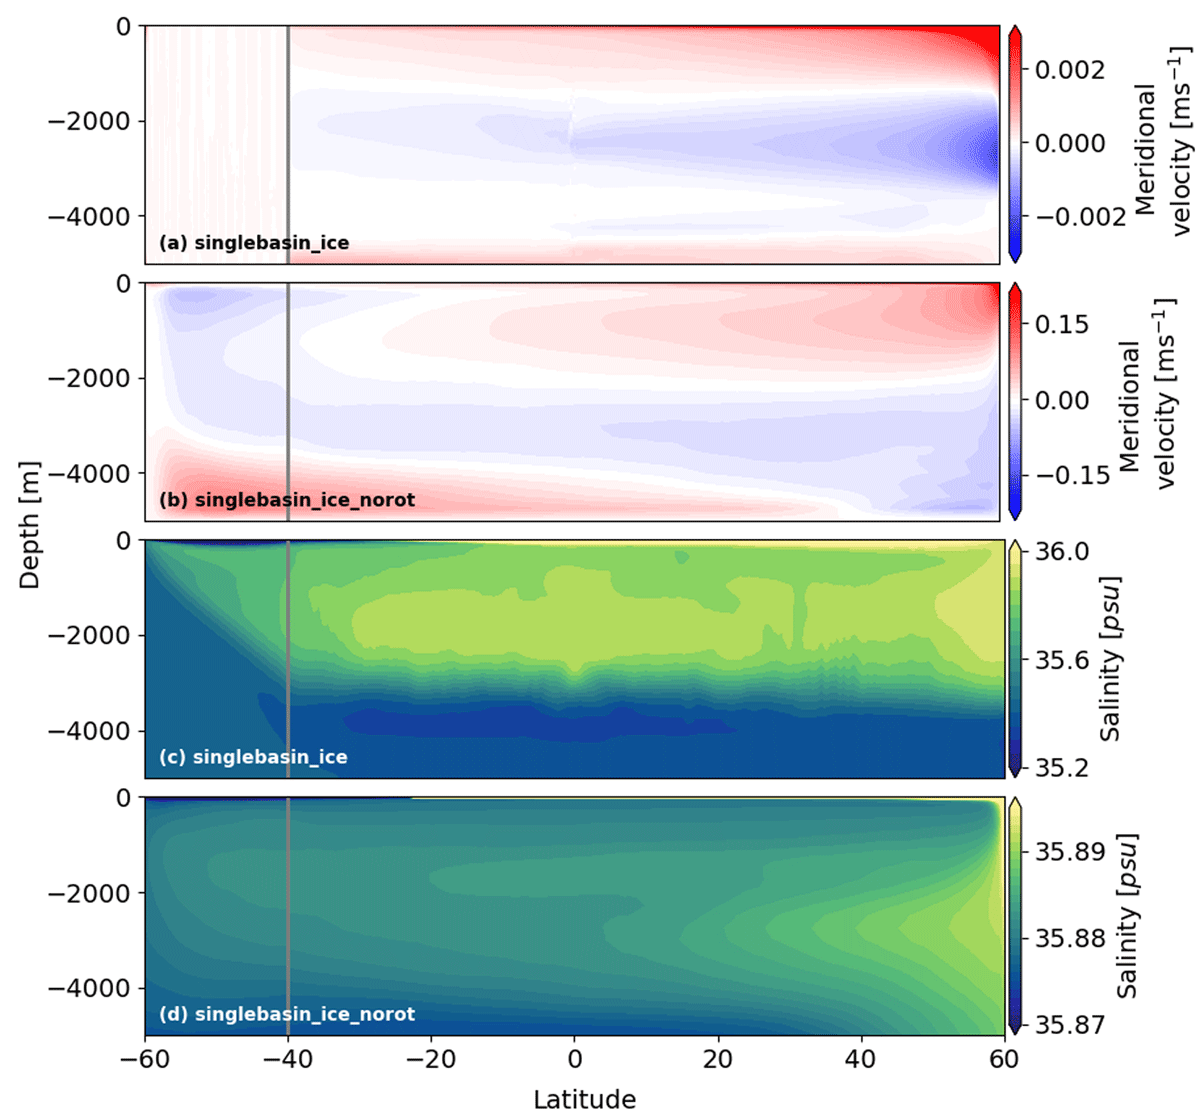
Figure 13
Vertical circulation - effect of planetary rotation. (a,b) Zonal mean meridional velocities, and (c,d) zonal mean salinities for (a,c) experiment singlebasin_ice and (b,d) experiment singlebasin_norot.