
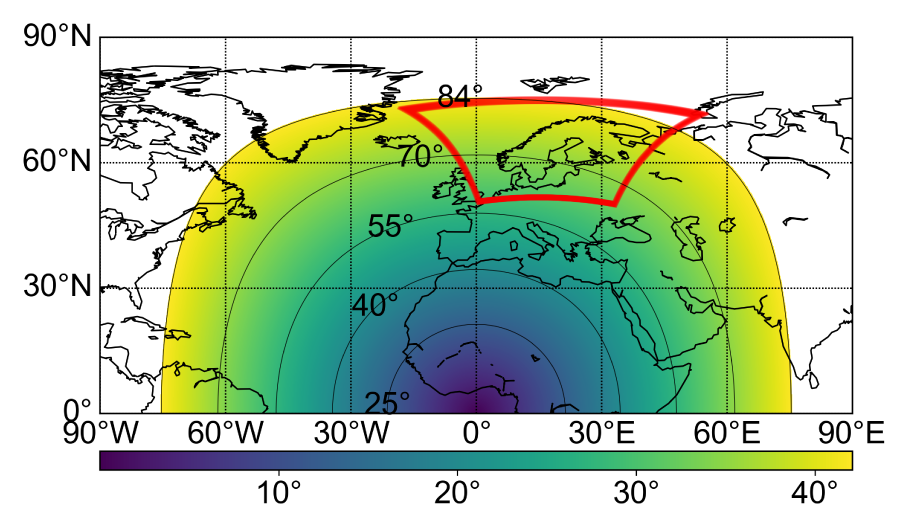
Figure 1
Zenith angles of MSG-4 satellite as viewed from the ground at the time of the study period. The red line shows the MetCoOp operational model domain in March 2024.
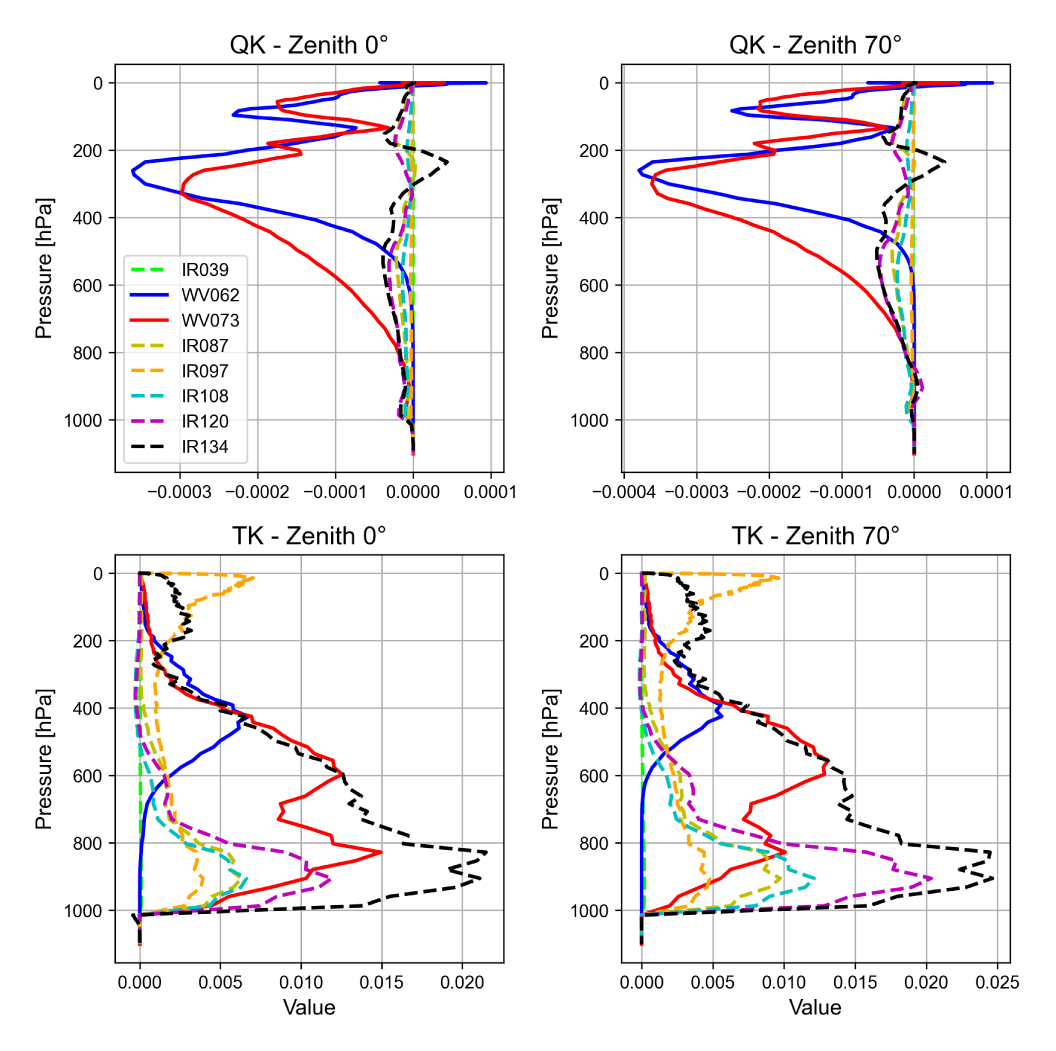
Figure 2
Jacobians of temperature (K/K) and humidity (K/ppmv) in SEVIRI channels at nadir (left) and satellite zenith angle 70° (right). The Jacobians are generated with RTTOV v12.3 assuming a cold and modestly moist vertical profile.
Table 1
Number of observations (n), arithmetic mean and standard deviation (STDV) of OmB and coverage percentage in the SEV_75 and SEV_84 experiments. The OmB statistics are shown separately for the two WV-sounding channels. The bottom row shows the relative change in SEV_84 with respect to SEV_75. Values in bold face are closer to zero and considered better. The coverage percentages are fractions of the MetCoOp operational domain area. The percentages shown in parentheses correspond to omitting the data that is too close to the domain boundaries to be assimilated.
| WV062 | WV073 | ||||||
|---|---|---|---|---|---|---|---|
| n | MEAN (OmB) | STDV (OmB) | n | MEAN (OmB) | STDV (OmB) | COVERAGE (%) | |
| SEV_75 | 61366 | –0.223 K | 1.149 K | 61327 | –0.100 K | 1.084 K | 55.74% (42.58%) |
| SEV_84 | 88028 | –0.165 K | 1.106 K | 87943 | –0.053 K | 1.114 K | 98.24% (75.05%) |
| Relative Change (%) | 43.4 | –26 | –3.7 | 43.4 | –47 | 2.8 | 76.2 (76.2) |
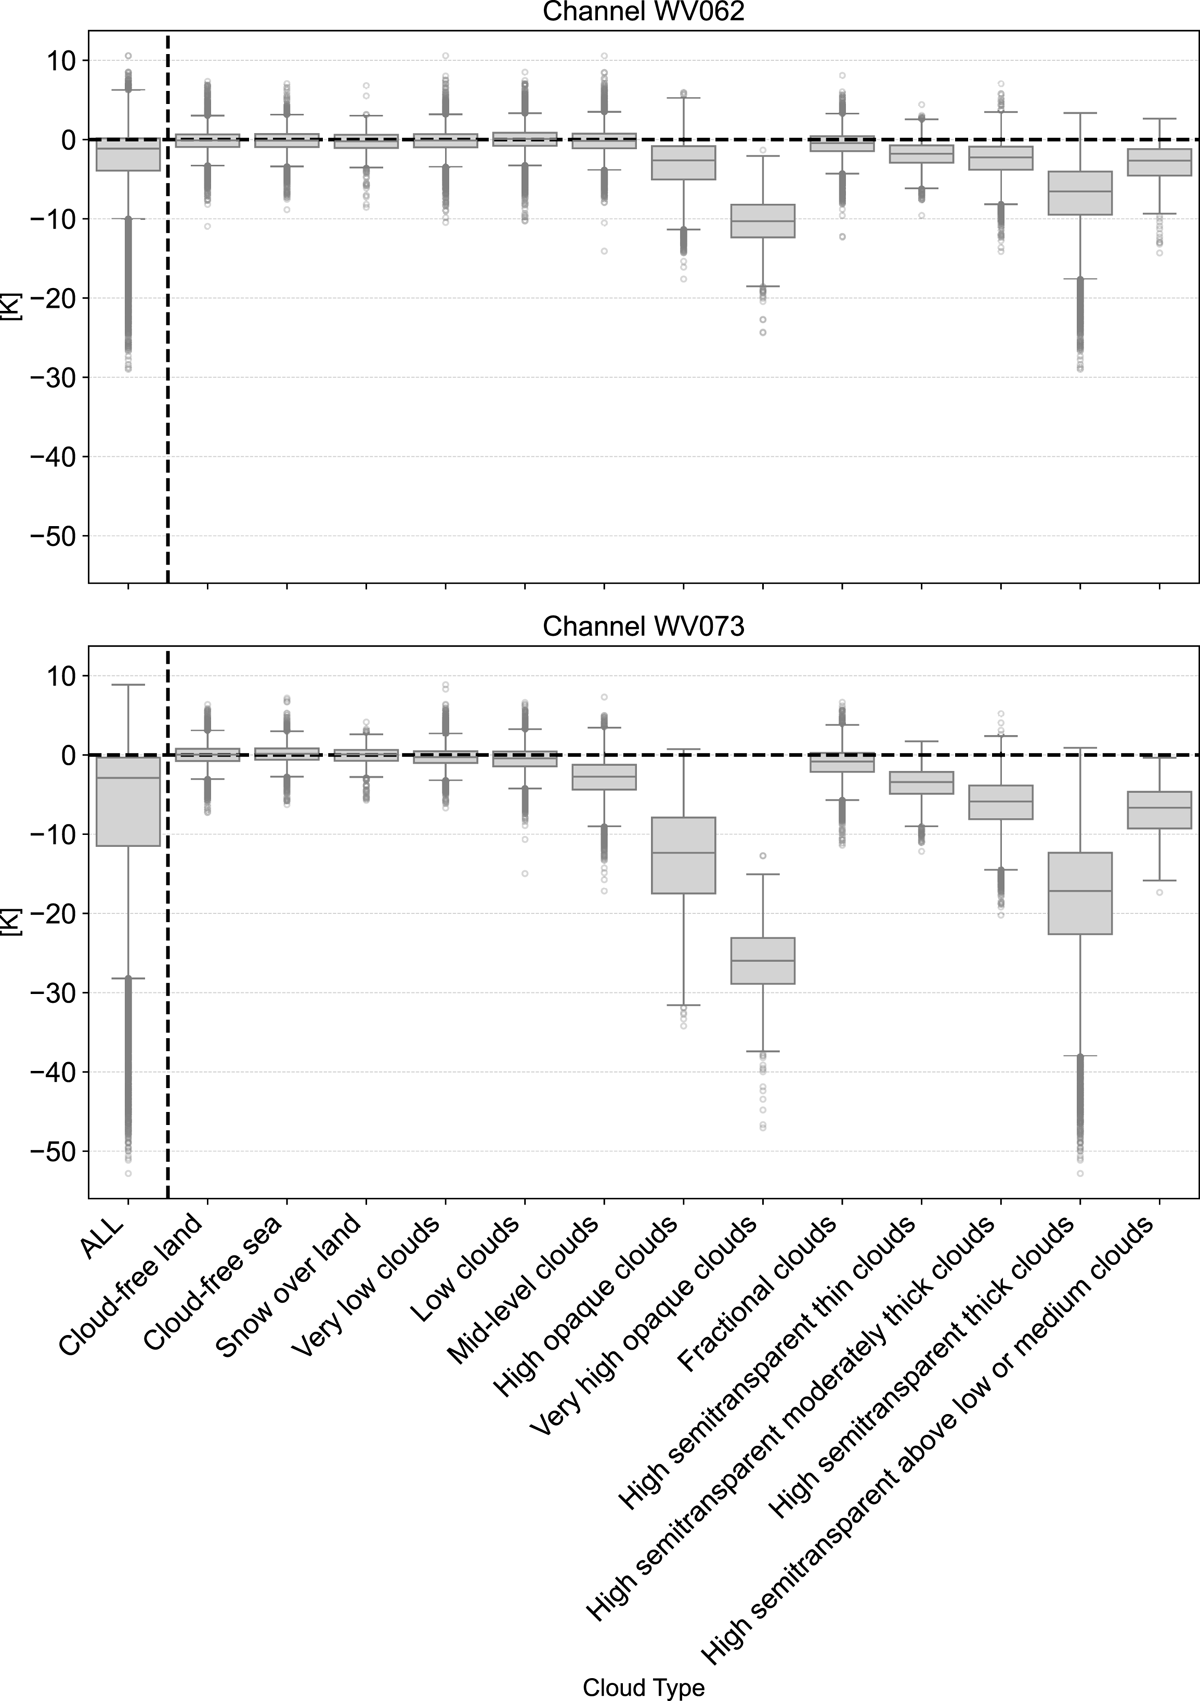
Figure 3
Boxplots of OmB departures in WV062 (top) and WV073 (bottom) for all data (‘ALL’) and by the NWCSAF cloud types. Note the homogenous boxplots at cloud free conditions and the cold tails at certain cloud types indicating that the model equivalents tend to be warmer than cloud-affected observations.
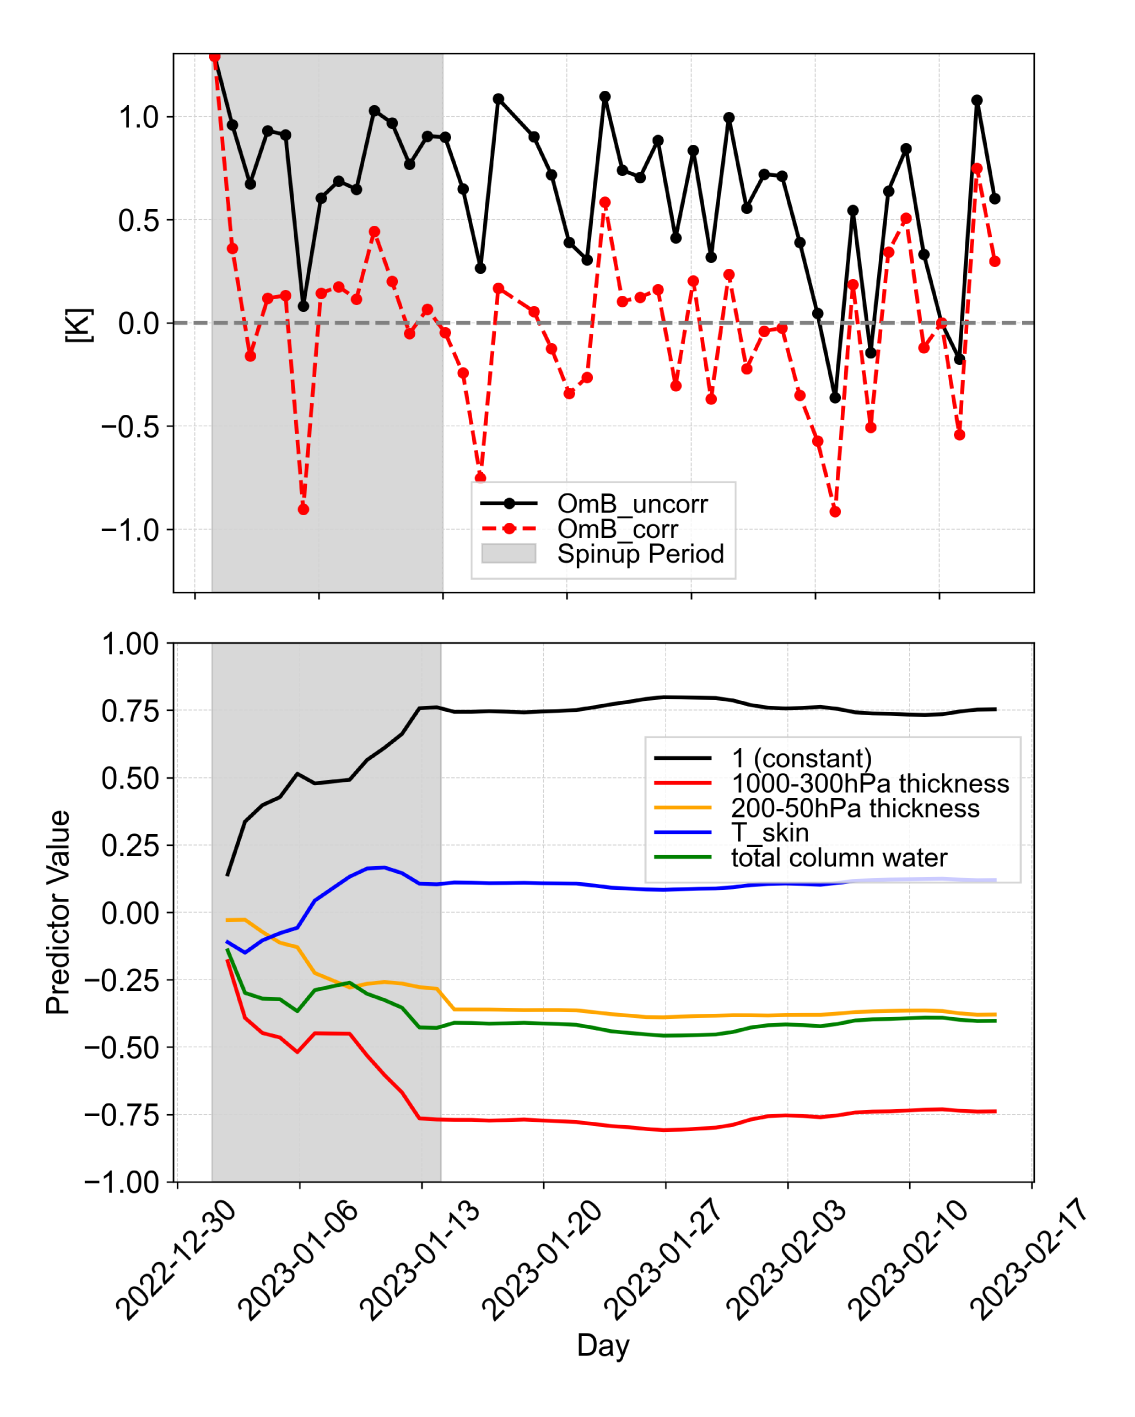
Figure 4
Top: Timeseries of mean OmB by the 03 UTC assimilation cycle in channel WV062. Gray background shows the VarBC spin-up time period. Bottom: the time evolution of each VarBC predictor coefficient in channel WV062.
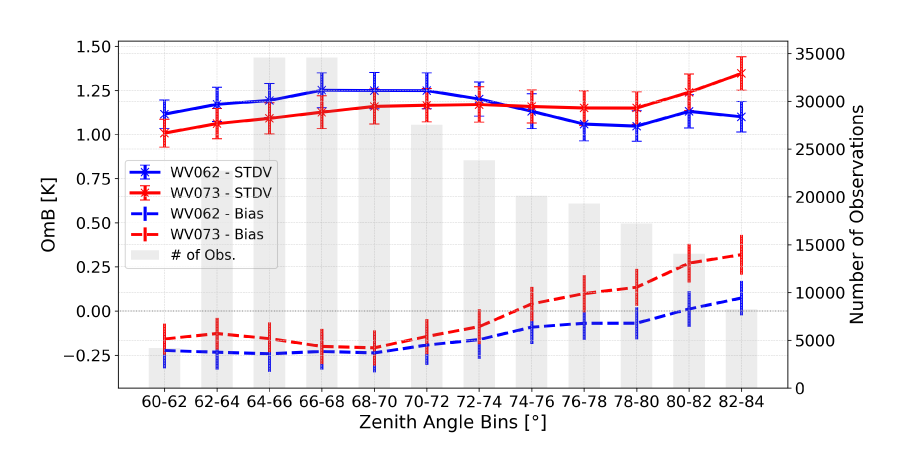
Figure 5
Number of observations, bias and standard deviations of OmB with uncertainty estimation in two-degree bins of Zenith Angles.
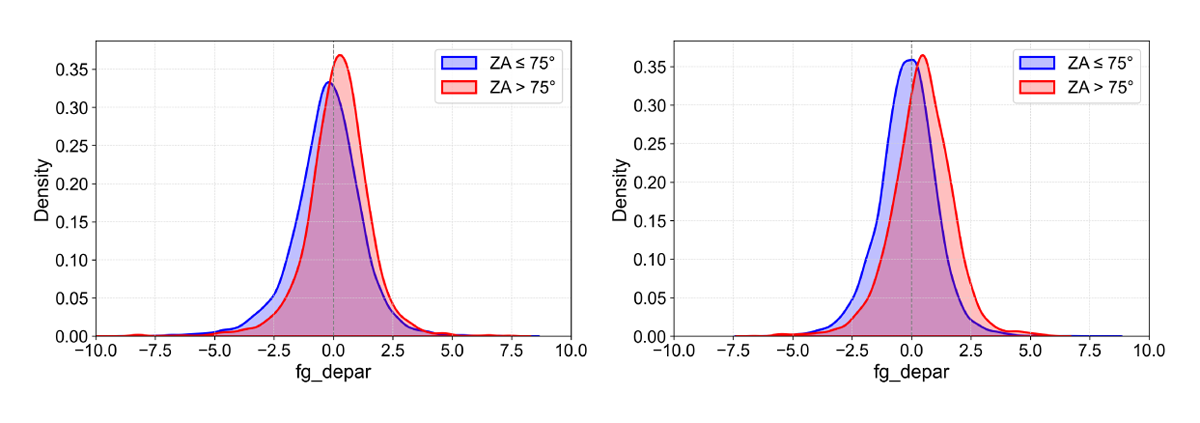
Figure 6
Density plots of OmB departure in the WV channels at zenith angles (ZA) lower (blue) and higher (red) than 75° for channels WV062 (left) and WV073 (right).
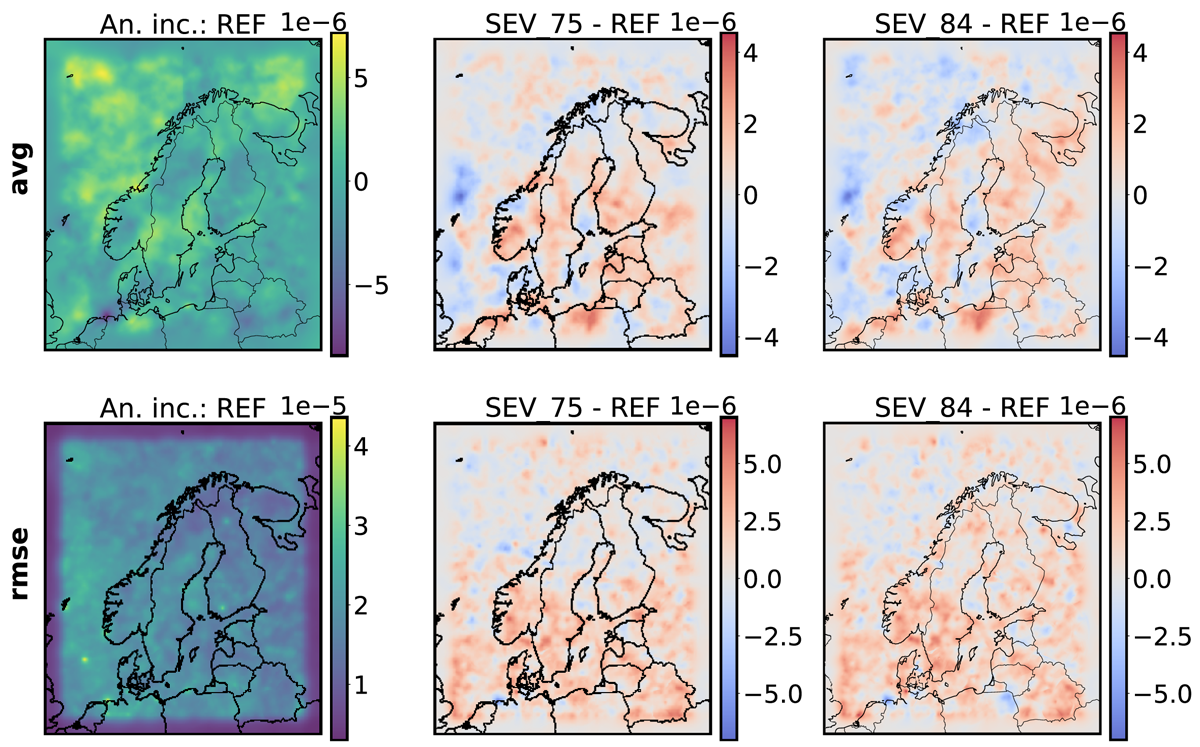
Figure 7
Statistical structure of the analysis increment in specific humidity on level 20 (near 415 hPa). Top: mean increment in REF (left), difference of mean increments in SEV_75 and REF (middle), and difference of mean increments in SEV_84 and REF (right). Bottom: RMS of the increment in REF (left), difference of RMS increments in SEV_75 and REF (middle), and difference of RMS increments in SEV_84 and REF (right). Unit is kg kg–1.
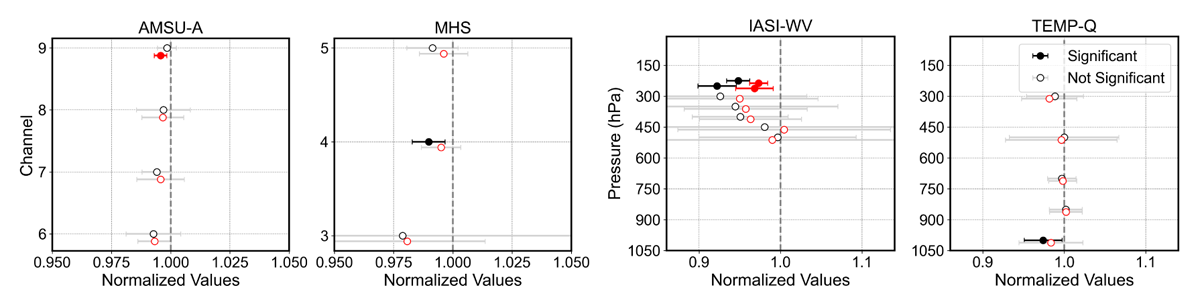
Figure 8
Standard deviation of the OmB departure in SEV_84 (black) and SEV_75 (red), normalized by the standard deviation in REF over the MetCoOp domain from 14 January to 14 February 2023. The statistics are shown for AMSU-A channels 6–9 (leftmost), MHS channels 3–5 (2nd from left), humidity-sounding channels of IASI, aggregated for intervals of the peak pressure of the channels’ weighting function (3rd from left); and specific humidity measurements from radiosondes, at standard pressure levels (far right)
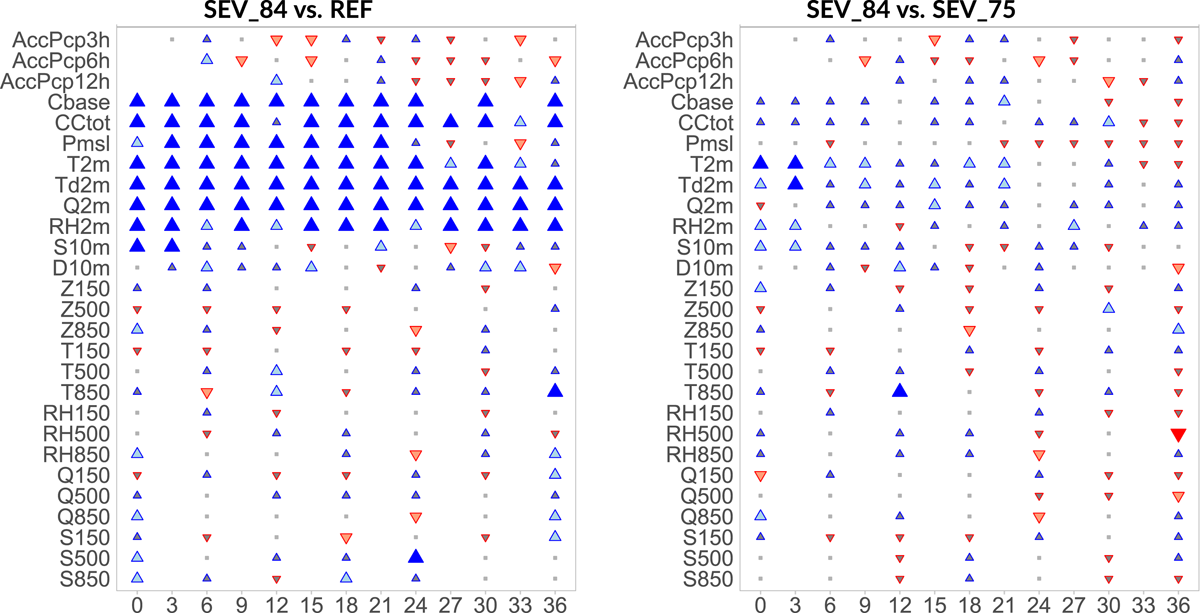
Figure 9
RMSE scorecards over the MetCoOp domain for surface and upper-air variables from 14 January to 14 February 2023, comparing experiments SEV_84 vs. REF (left) and SEV_84 vs. SEV_75 (right). Scorecards show differences in forecasts against in-situ observations, using SYNOP for surface variables and radiosondes for upper-air variables. Three sizes of blue upwards facing triangles show levels of significant improvements of SEV_84 vs. REF/SEV_75. Vice versa for red downwards facing triangles, which show degradations. See Table 2 for a description of the variables.
Table 2
Description of Variables Used in scorecards verification.
| CATEGORY | DESCRIPTION |
|---|---|
| Accumulated Precipitation (AccPcpXh) | 3, 6, 12 hour accumulations |
| Clouds | Cloud base height in meter (Cbase), Total cloud cover in Octa (CCtot) |
| Surface Variables | Air pressure at mean sea level (Pmsl), 2-meter Air temperature (T2m), |
| Dew point temperature (Td2m), Specific humidity (Q2m) and | |
| Relative humidity (RH2m), 10-meter Wind speed (S10m) and | |
| Wind direction (D10m) | |
| Upper-air Variables at 150, 500, 850 hPa | Geopotential (Z), Air temperature (T), Relative humidity (RH), |
| Specific humidity (Q) and Wind speed (S) |
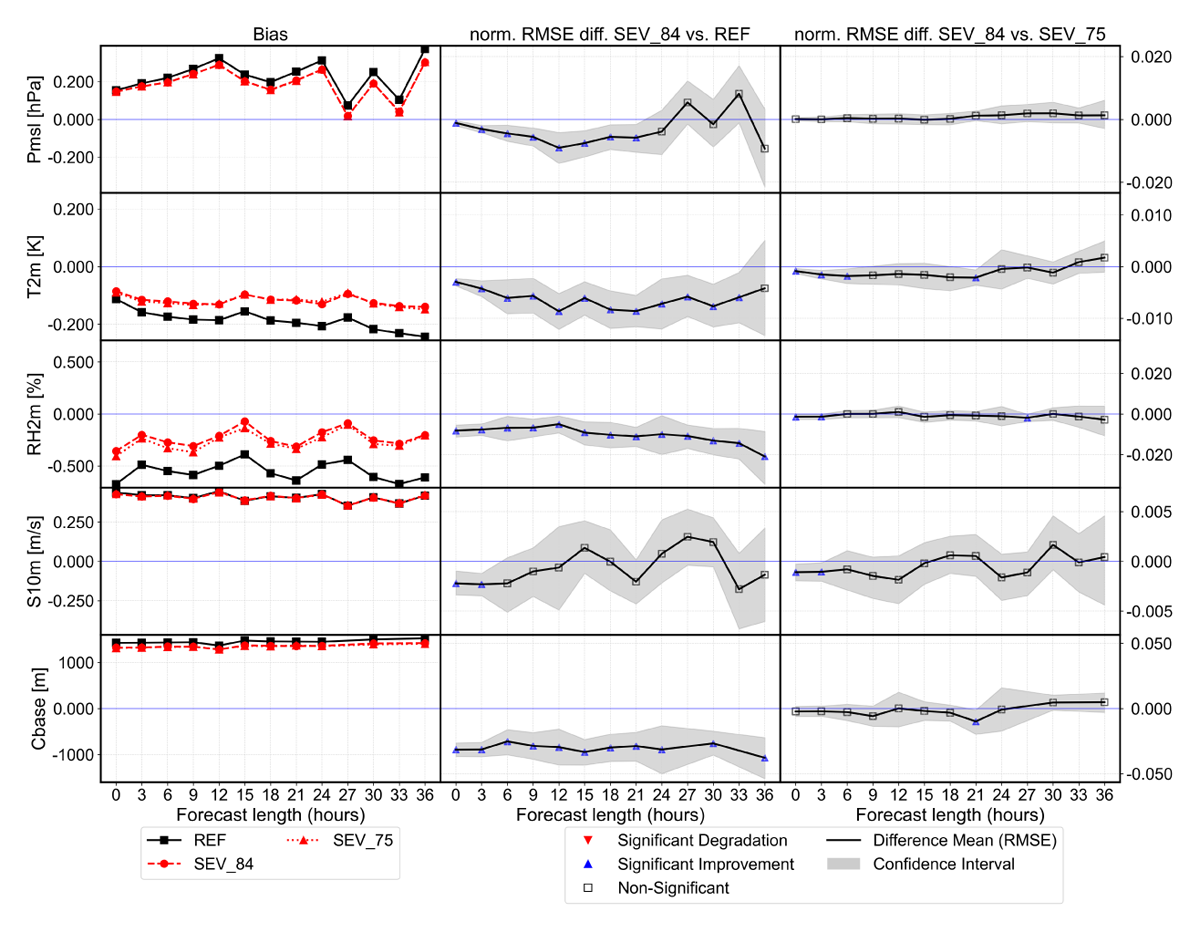
Figure 10
Verification for surface variables Pmsl, T2m, RH2m, S10m and Cbase by forecast length for the MetCoOp domain from 14 January to 14 February 2023. Left column shows bias of REF (black), SEV_75 (red dotted) and SEV_84 (red dashed). Middle and right columns show the differences in normalized RMSE of SEV_84. vs. REF and SEV_84 vs. SEV_75 with uncertainty estimates (shading). Note the improved Bias and RMSE in Pmsl, T2m and RH2m in the first 21 hours, the significantly improved RMSE for Cbase in SEV_84 vs. REF and the diminished effect when compared to SEV_75.
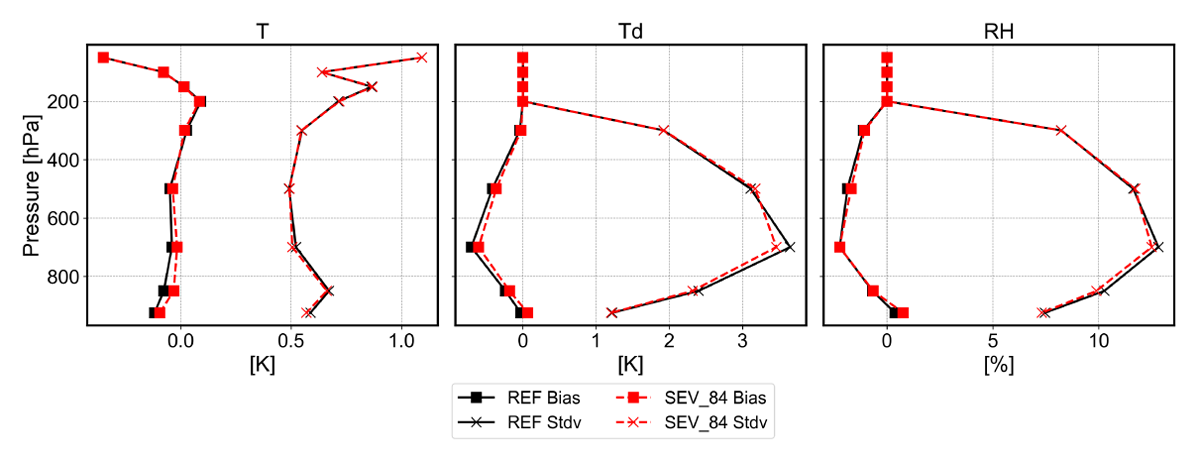
Figure 11
Verification of vertical profiles of temperature (T), dewpoint-temperature (Td) and relative humidity (RH) forecasts against observations from radiosondes over the MetCoOp domain between 14 January and 14 February 2023.