
Publisher’s Note: A correction article relating to this paper has been published and can be found at https://tellusjournal.org/articles/10.16993/tellus.4181.
1 Introduction
Accurate weather forecasting from Numerical Weather Prediction (NWP) models is crucial for society. To enhance the accuracy of these predictions, data assimilation techniques such as 3- and 4-Dimensional Variational Data Assimilation (3D-Var and 4D-Var) are commonly used (e.g., Rabier et al., 2000; Munro et al., 2004; Andersson and Thépaut, 2008). These techniques merge observational and model data to estimate the current state of the atmosphere (Munro et al., 2004). Focusing on improving the use of late-arriving observations through taking advantage of the concept of continuous data assimilation, Lean et al. (2021) describe the current configuration of 4D-Var and its evolution at the European Centre for Medium-Range Weather Forecasts (ECMWF).
A significant area of focus is the assimilation of electro-magnetic waves emitted by the Earth and its atmosphere, so called radiances, which are measured by instruments onboard of Earth-observing satellites. There has been a substantial evolution in the utilization of satellite data (Eyre et al., 1993; Andersson et al., 1994; Derber and Wu, 1998; McNally et al., 2006). Nowadays satellite radiances are the single most important type of observations in global NWP models (McNally, 2012; Bauer et al., 2015; Geer et al., 2018; Eyre et al., 2022). Several different instruments are currently part of satellite missions and are constantly observing the Earth-atmosphere system at visible, infrared and microwave frequencies. The meteorological satellite missions operate in both geostationary and low-Earth orbits.
The Spinning Enhanced Visible and Infrared Imager (SEVIRI) on the Meteosat Second Generation (MSG) satellites have provided measurement data from a geostationary orbit continuously since 2002 and has been declared operational from 2004 onwards (WMO OSCAR, 2025a). The assimilation of SEVIRI radiance data has proven to be beneficial in global NWP (Szyndel et al., 2005; Peubey and McNally, 2009) and also in Limited Area Models (LAM; Stengel et al., 2009; Hutt et al., 2020). Until now, the use of SEVIRI data in European LAM domains has generally been limited to the central and southern parts of the continent. Montmerle et al. (2007) presented implementations of SEVIRI radiances from the first MSG satellite within a European LAM domain. Stengel et al. (2009) investigated the use of SEVIRI (from the second MSG satellite) in a large LAM domain that extended far into the Arctic Ocean and beyond the North Pole. Geometrical considerations restricted their use of SEVIRI data to satellite zenith angles smaller than 70°, effectively limiting the meteorological impact to regions south of the 60° N. The study of Hutt et al. (2020), on the other hand, focused on a relatively small Central European LAM domain.
The purpose of this article is to consider the potential of geostationary radiance assimilation in LAM applications north of latitude 60° N. At such latitudes, the satellite data assimilation relies heavily on polar orbiting satellites. Although modern LAM systems focus on convective-scale modelling at 1–5 km grid spacing and 1–3 hour repeat cycles, the associated demand of frequent observational data cannot be fulfilled by the use of polar orbiters alone. The 15-minute observing time resolution of geostationary instruments such as SEVIRI, in conjunction with kilometric-scale imaging resolution of the instrument, has great potential to serve the LAM applications at high latitudes. However, releasing the latent potential will require solving the particular challenge due to the steep viewing angle. The complicated Scandinavian orography and the reduced amount of sunlight in winter need to be factored in. In practice, one will need to find a balance where the benefit of frequent temporal sampling exceeds the disadvantage of the steep viewing angle in the North.
The SEVIRI data contain radiance measurements taken at 12 distinct frequency bands (channels) spanning from the visible light spectrum at 600 nm to the long-wave infrared CO2 absorption band at 14 μm. Our starting point is to assimilate radiances collected in the two humidity-sensitive channels with central wavelengths at 6.25 μm and 7.35 μm. These channels are strongly affected by the absorption of radiation by water-vapour molecules, so they provide information on atmospheric humidity in mid to upper troposphere and are largely insensitive to emission from underlying land or sea surfaces. Moreover, our present approach is restricted to the use of data in cloud-free conditions. We allow some use of data in situations where cloud is limited to very low levels, but in no case do we attempt to account for the radiative effect of cloud in the data assimilation procedure. There is growing evidence for the benefit of assimilating cloud-affected radiances in global NWP, particularly in the context of instruments operating at microwave frequencies (Geer et al., 2018), but also with infrared sounders (Geer et al., 2019). It is our aim to extend the SEVIRI assimilation to such all-sky assimilation later in the future, provided we can create a solid framework to make use of cloud-free data at high latitudes.
The research reported in this article is conducted in the framework of A Consortium for Convection-scale modelling Research and Development (ACCORD), which consists of 26 countries in Europe and North Africa. In considerable part, ACCORD builds on foundations laid within the long-continued collaboration efforts in the High Resolution Limited Area Model (HIRLAM) and Aire Limitée Adaptation dynamique Développement International (ALADIN) consortia. The Nordic operational NWP productions are flavours of HIRLAM-ALADIN Research on Mesoscale Operational NWP in Euromed—Applications of Research at Mesoscale (HARMONIE-AROME) reference NWP system (Bengtsson et al., 2017). There is strong support for the use of satellite-based radiance measurements via data assimilation algorithms such as 3D-Var.
This paper is structured as follows: Section 2 outlines the HARMONIE-AROME model, its 3D-Var data assimilation, and SEVIRI data from the fourth MSG satellite (MSG-4 and also known as METEOSAT-11), including its integration, cloud screening, bias correction, and the setup and evaluation of three experiments. Section 3 presents the results of assimilating SEVIRI data at high northern latitudes, including the effects of cloud screening and bias correction, with a focus on using SEVIRI beyond the previous 75° satellite zenith angle limit and its impacts on data assimilation and forecast performance. Section 4 discusses the study’s limitations, including those of SEVIRI data, and potential future developments. Finally, Section 5 provides a summary and the main conclusions.
2 Data and Methods
Section 2 describes the 3D-Var data assimilation in the specific framework of the HARMONIE-AROME NWP system, the SEVIRI radiance data from MSG-4 satellite, as well as the handling of SEVIRI in HARMONIE-AROME and the procedures of cloud-screening and bias-correction. Furthermore, we will explain the setup of three experiments, which were conducted over a 31-day period in Winter 2023 (14 January to 14 February). Lastly, the methods of evaluation give a generic outline on methods used to assess the performance of the conducted experiments against each other and what changes are attributed to the assimilation of SEVIRI radiance data.
2.1 HARMONIE-AROME and its 3D-Var
In this study we use the HARMONIE-AROME NWP model, which is a convection-permitting non-hydrostatic system operated in limited-area domains at several European national meteorological offices (Bengtsson et al., 2017). The utilized HARMONIE-AROME reference cycle is cy46h1, which is also running in preoperational mode at several institutes at the time of writing. It is formulated in a terrain-following pressure-based sigma-coordinate system. Physical parametrizations include radiation, clouds and cloud microphysics, turbulence, convection, and surface fluxes, while the surface interactions are handled by the SURFEX scheme (Masson et al., 2013).
As a limited-area model, HARMONIE-AROME needs coupling with a model that has a larger geographical extension in both horizontal and vertical dimensions. This larger model provides boundary conditions (boundaries) which are updated every hour and are internally interpolated linearly to fit each integration timestep of HARMONIE-AROME. Then the boundaries are interpolated horizontally and vertically on the HARMONIE-AROME’s grid and merged with the model’s values in a so-called relaxation zone spanning over nine grid-points at the edge of the domain (Davies, 1976). Sea Surface Temperature (SST) and sea-ice information are interpolated from the boundary files.
The HARMONIE-AROME system also includes a process called “large-scale mixing”, which combines the interpolated boundary conditions with the model’s background fields for temperature and wind components. This process takes place in spectral space and is described in more detail by Müller et al. (2017). This mixing is used in operational systems like MetCoOp (Meterological Cooperation on Operational NWP between national weather services of Estonia, Finland, Latvia, Norway and Sweden), with the goal of leveraging the advanced 4D-Var assimilation system of the IFS (Integrated Forecasting System) global model to improve forecast scores, but it also dampens the impact of HARMONIE-AROME’s own assimilation system. Notably, humidity is excluded from this mixing process because HARMONIE-AROME and IFS use different model physics, and including humidity would introduce a dry bias in HARMONIE-AROME. The disadvantage may arise that temperature and humidity fields become slightly inconsistent (M. Lindskog, personal communications, 2024).
The system consists of three main components: surface data assimilation, upper-air data assimilation, and the forecast model. The upper-air data assimilation uses the 3D-Var method that minimizes the cost function
of the control variables (i.e. vorticity, divergence, temperature, surface pressure and specific humidity errors) (Berre, 2000; Müller et al., 2017). Vector is the prior estimate (background), which in our case is the 3-hour forecast valid at the analysis time, y is the observation vector, and x is the posterior state estimate (the analysis) at the end of minimization of J(x); B and R are the background and the observation error covariance matrices, respectively; and h(x) is the forward operator providing an interpolation of model fields to the observation locations and simulation of the measured variables from the background parameters (Benáček and Mile, 2019). In case of satellite radiances, the fast radiative transfer model RTTOV is employed to obtain the model’s equivalent h(x) (EUMETSAT, 2024; Saunders et al., 2018). To perform unbiased estimation of x, we assume that both y and have only Gaussian, zero-mean errors that are mutually uncorrelated (Benáček and Mile, 2019). The background error covariance (B) is set constant and is calculated from an ensemble of forecast differences in a sample that covers several months over four seasons (Gustafsson et al., 2018). In the case of satellite radiances, the observation errors are static and their corresponding elements in R are scalar values, although they differ from one instrument channel to another.
The HARMONIE-AROME reference system forms the basis for operational use at several NWP centres and groupings within the ACCORD consortium members. The study presented here is conducted using the operational domain of the MetCoOp group (illustrated in Figure 1).
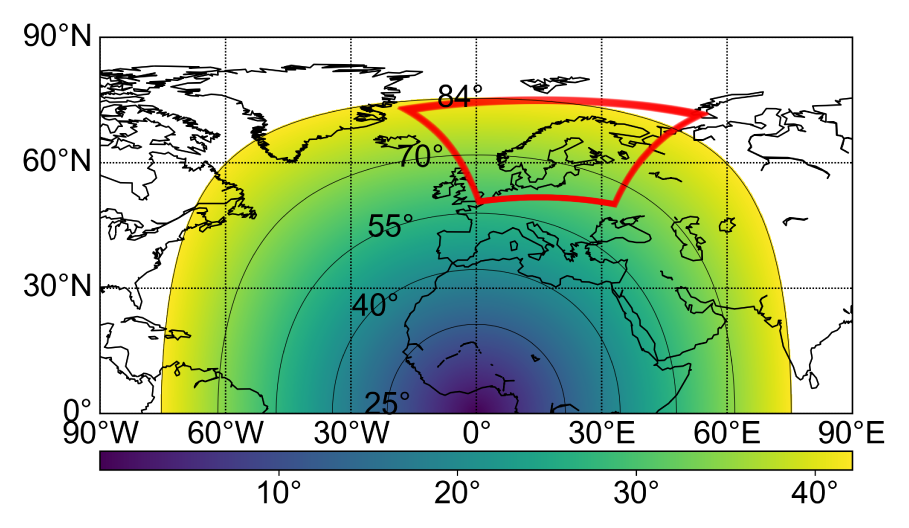
Figure 1
Zenith angles of MSG-4 satellite as viewed from the ground at the time of the study period. The red line shows the MetCoOp operational model domain in March 2024.
One notable feature of HARMONIE-AROME’s cy46h is the option to use slant-path radiative transfer for satellite radiances. This capability was first introduced in IFS cy43r1, as described by Bormann (2017). By accounting for satellite viewing angles, this approach improves the assimilation of radiances, particularly for those with steeper viewing angles, and has a positive impact on forecast quality. However, we decided not to use this feature in our experiment setup, since we lack experience and are unaware of any implementation in limited-area models at the time of our study. Hence, no trigonometric correction was applied to h(x) in our experiments.
2.2 SEVIRI on MSG-4
SEVIRI on board MSG-4 measures the radiance emitted by the atmosphere in 12 channels. The measurement data are gathered in level 1.5 image data format directly by EUMETSAT whereby they describe that the data corresponds to geolocated and radiometrically pre-processed image data and is ready for further processing, such as the extraction of meteorological products (EUMETSATa, 2023).
In the infrared part of the observing spectrum at 3.5–15 micrometers, there are eight channels that are candidates for assimilation in HARMONIE-AROME. Our primary focus is in the water-vapour sounding channels WV062 and WV073 that are sensitive to humidity and temperature in the upper and middle troposphere. These channels are centered at 6.25 and 7.35 micrometers with bandwidths of 1.8 and 2 micrometers, respectively (Schmetz et al., 2002). Figure 1 shows the dependence of the MSG-4 satellite zenith angle as a function of latitude and longitude at ground level. Inside the MetCoOp operational domain, the zenith angle ranges from 60°–84°. The ground resolution of SEVIRI is a function of the satellite zenith angle and varies from 4.6–8.2 km inside the MetCoOp domain. The study presented here uses the data in the original horizontal resolution without attempting to match the effective resolution with that of the NWP system, as prescribed in Hutt et al. (2020), for example.
Temporal resolution of SEVIRI radiances is 15 minutes and is received at ground stations with a delay of about 15 minutes past generation. This timeliness of dissemination is within operational requirements throughout European NWP centres.
2.3 SEVIRI in HARMONIE-AROME
Satellite radiance data assimilation in the HARMONIE-AROME reference system makes use of the RTTOV v12.3 fast radiative transfer software (EUMETSAT, 2024) and the configuration builds upon the initial SEVIRI implementation in AROME-France by Montmerle et al. (2007). Figure 2 shows typical Jacobians of humidity (Q) and temperature (T), as computed using RTTOV, for the SEVIRI channels at satellite zenith angles 0° and 70° and corresponds to a cold and modestly moist atmospheric profile. The humidity Jacobians of the WV062 and WV073 channels indicate the greatest sensitivity at 250–300 hPa. The temperature Jacobians peak somewhat lower in the troposphere. The broad absorption range in WV073 suggests a chance of being affected by high altitude topography. The highest mountain peak in the domain is around 2450 m and the maximum model topography (at the operational 2.5 km horizontal resolution) is around 2020 m. There is no strong water vapour absorption in the infrared channels IR039, IR087, IR097, IR108, IR120 and IR134, and consequently their sensitivity to humidity is weak and the temperature Jacobians peak in the lower troposphere. The information content of these channels is primarily in the surface temperature and secondarily in the lower troposphere temperature. IR097 shows an additional peak in temperature in the stratosphere due to the sensitivity to ozone absorption.
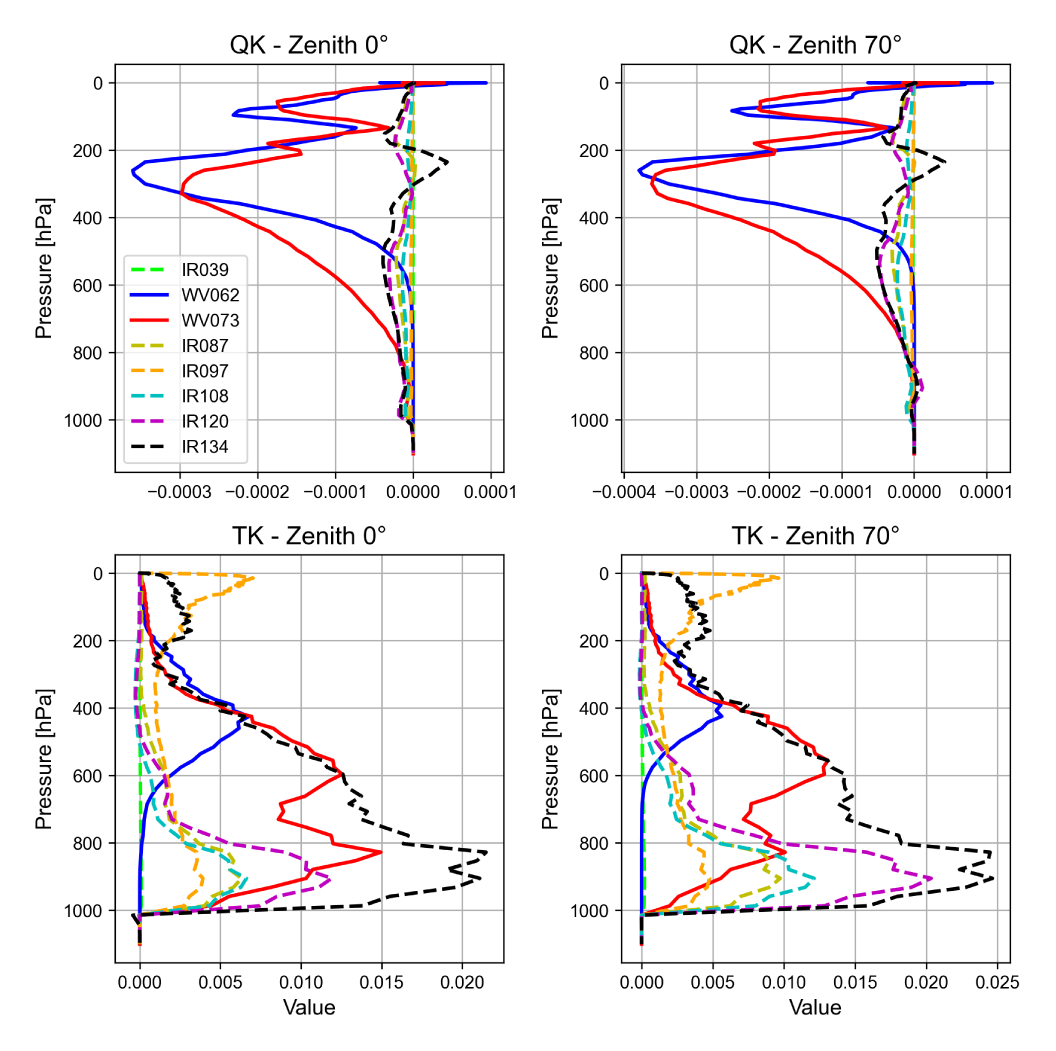
Figure 2
Jacobians of temperature (K/K) and humidity (K/ppmv) in SEVIRI channels at nadir (left) and satellite zenith angle 70° (right). The Jacobians are generated with RTTOV v12.3 assuming a cold and modestly moist vertical profile.
The HARMONIE-AROME reference system assigns the default observation error standard deviation of 1.53 K to the SEVIRI channels WV062 and WV073. These are based on previously unpublished studies.
Before assimilation, satellite radiances go through a screening process which applies observation quality control and cloud screening. Quality control consists of a check for excessive observation minus background (OmB) departures. In the two water-vapour sounding channels of SEVIRI, the rejection threshold is set to ±5.15 K. Furthermore, the screening process includes horizontal thinning to avoid assimilation of data with mutually correlated errors (Bormann and Bauer, 2010; Bauer et al., 2011). The thinning distance applied to SEVIRI is 35.6 km.
RTTOV v12 offers three sets of coefficients for SEVIRI: v7, v8, and v9. These coefficients are pre-calculated parameters, specific to each SEVIRI channel, that enable the fast simulation of top-of-atmosphere radiances. They represent a computationally efficient parameterization of the complex relationship between atmospheric state variables (for example, temperature and humidity profiles) and the resulting radiances. The coefficients are provided by EUMETSAT (2024) and are derived offline by regression using a diverse training dataset of atmospheric profiles and their corresponding radiances calculated with a more accurate but slower line-by-line radiative transfer model (Matricardi, 2008). The v7 coefficients were, previously, the default but only allow a maximum satellite zenith angle of 75°, which limits the geographical coverage in the studied domain. The v9 coefficients were trained on atmospheric profiles from a wider range of latitudes and support assimilation at zenith angles beyond 75°, which increases the potential coverage significantly (see Table 1).
Table 1
Number of observations (n), arithmetic mean and standard deviation (STDV) of OmB and coverage percentage in the SEV_75 and SEV_84 experiments. The OmB statistics are shown separately for the two WV-sounding channels. The bottom row shows the relative change in SEV_84 with respect to SEV_75. Values in bold face are closer to zero and considered better. The coverage percentages are fractions of the MetCoOp operational domain area. The percentages shown in parentheses correspond to omitting the data that is too close to the domain boundaries to be assimilated.
| WV062 | WV073 | ||||||
|---|---|---|---|---|---|---|---|
| n | MEAN (OmB) | STDV (OmB) | n | MEAN (OmB) | STDV (OmB) | COVERAGE (%) | |
| SEV_75 | 61366 | –0.223 K | 1.149 K | 61327 | –0.100 K | 1.084 K | 55.74% (42.58%) |
| SEV_84 | 88028 | –0.165 K | 1.106 K | 87943 | –0.053 K | 1.114 K | 98.24% (75.05%) |
| Relative Change (%) | 43.4 | –26 | –3.7 | 43.4 | –47 | 2.8 | 76.2 (76.2) |
2.3.1 Cloud screening
As mentioned earlier, we follow the approach of assimilating SEVIRI WV channels solely in clear-sky cases. Here, ‘clear-sky’ does not strictly mean ‘cloud-free,’ but rather refers to conditions that are cloud-free and include very low cloud cases. For that purpose we use the cloudtype and cloudtype-quality fields, provided by the NWCSAF version 2018 software, to filter out cloud-affected radiances that are poorly suited for assimilation. The NWCSAF software itself uses SEVIRI radiances as input, as well as NWP data. Therefore, the cloud fields have the same temporal and horizontal resolution as the raw radiances (see NWCSAF, 2019, for details).
The NWCSAF v2018 cloud products show significant difficulties in our domain at high latitudes, especially over snow and ice surfaces, which are frequent in our studied winter period. Low sun angles, cold surface temperatures, and the reflective similarity between snow and clouds reduce the algorithm’s ability to detect clouds accurately (Dybbroe et al., 2018). Especially cases of low clouds over snow and ice are challenging due to their thermal and reflective properties closely matching the surface. The absence of visible data during polar night or twilight, and the reliance on infrared channels further diminish detection accuracy, as thermal contrast is minimal (Dybbroe et al., 2018). Additionally, high satellite viewing angles at high latitudes reduce spatial resolution and cause pixel distortion, complicating cloud detection further (Schmetz et al., 2002; Werner and Deneke, 2020).
The five available cloudtype-quality flags include ‘nodata,’ ‘good,’ ‘bad,’ ‘questionable,’ and ‘interpolated.’ We have chosen to only allow for ‘good’ pixels to be considered in the subsequent filtering by cloudtype. In this context, ‘good’ pixels do not simply indicate ‘no cloud’ but rather refer to any pixels that have been classified with high confidence, as outlined in the NWC SAF Cloud Mask Algorithm Theoretical Basis Document (Dybbroe et al., 2018). Fortunately, this does not affect the number of observations by much since ‘good’ pixels dominate. The NWCSAF software provides 11 cloudtypes ranging from very low clouds to high semitransparent clouds and also four cloud-free surface types. The cloudtype filtering process and details to be considered at high latitudes are discussed below in Section 3.1.
A geographical limitation exists at a satellite zenith angle of 84°. Beyond this angle, no cloud products are provided, and hence, SEVIRI data beyond 84° are excluded from our analysis. This serves as the absolute maximum satellite zenith angle used in this study.
2.3.2 Bias correction
In general, the assimilation of satellite radiance data must account for systematic observation errors, or biases (Auligné et al., 2007; Benáček and Mile, 2019). Such biases are typically present in satellite data and they originate from a combination of from instrument design, imperfect radiative transfer modelling, and incapability to remove all poor-quality data during the screening process. Since the 3D-Var algorithm assumes unbiased observations, a bias correction algorithm is a practical necessity. In the HARMONIE-AROME reference system, the default option is the Variational Bias Correction (VarBC) that modifies Equation (1) into
That is, the cost function is a function of not only the state vector x but also of the bias correction coefficients (Benáček and Mile, 2019). These require their own background values () and background error covariance (). In comparison with Equation (1), Equation (2) highlights the influence of the bias correction in the evaluation of the observation constraint (the last term on the right-hand-side). There is also an additional term that constrains the evolution of during the assimilation.
The VarBC implementation for SEVIRI makes use of five predictor variables including the constant offset, 1000–300 hPa thickness, 200–50 hPa thickness, surface temperature and total column water vapour. The VarBC coefficients are cycled in 24-hour intervals such that computed within a particular analysis becomes the background for the analysis at the same time the following day. Benáček and Mile (2019) provide a more detailed description of the VarBC scheme in use at HARMONIE-AROME systems.
2.4 Experimental setup
The experiments in this study use the MetCoOp operational model domain with 2.5 km grid point resolution and 65 vertical levels. Initial and lateral boundary conditions are obtained from ECMWF’s IFS. At the time of the experiment, the operational IFS was at version cy47r3 at horizontal resolution of approx. 9 km (ECMWF, 2021).
The experiment setup consists of three runs, REF, SEV_75 and SEV_84, each covering 31 days from 2023-01-14 03 UTC to 2023-02-14 21 UTC. We have run eight analysis-forecast cycles a day with 3-hour cycling. Long 36-hour forecasts are run twice a day, at the 0 and 12 UTC cycles, and short 3-hour forecasts in the three cycles in between. The first run (REF) includes assimilation of observations from conventional sources such as synoptic surface stations (SYNOP), radiosondes and aircrafts. It further includes assimilation of wind measurements over the sea from the satellite-based ASCAT instrument (ESA, 2025a), and satellite radiance measurements from microwave sounders AMSU-A (NASA, 2025), ATMS (NOAA/NESDIS, 2025), MHS (ESA, 2025b), and MWHS-2 (WMO OSCAR, 2025b), and the infrared sounder IASI (ESA, 2025c). The second run (SEV_75) additionally assimilates the WV062 and WV073 channels from SEVIRI at zenith angles less than 75°. The third run (SEV_84) assimilates the two SEVIRI channels up to the 84° zenith angle, which is just below the RTTOV theoretical limit of 85° for v9 predictors (EUMETSAT NWP SAF, 2019) and stems, as mentioned earlier, from the 84° limitation of the cloud-products. In principle, each channel—including the two assimilated water vapor channels—undergoes its own independent cloud-screening procedure. That is, the screening criteria defined in Section 3.1 are applied separately to each channel. Consequently, the VarBC coefficients are also updated independently for each channel based on their individual cloud-screened observations.
2.5 Methods of Evaluation
A general overview to evaluate the experimental setup is as follows.
The evaluation begins with cloud screening, focusing on NWCSAF cloud quality flags and types to filter cloud-affected data and ensure the ingestion of clear-sky radiances. Bias correction is then assessed by analyzing the performance of the Variational Bias Correction (VarBC) on OmB statistics for individual SEVIRI channels to remove constant or slowly varying biases. The study further examines the impact on data assimilation by analyzing the analysis increments and OmB statistics from other observations. Forecast accuracy is evaluated through pointwise verification of forecasts, comparing model outputs against observations from SYNOP stations and radiosondes using statistical metrics of Bias and RMSE. The forecasts are interpolated to observation locations using bilinear horizontal and linear vertical methods, with verification performed through the HIRLAM-ALADIN R Package (HARP). Statistical tests, including the student-t and bootstrapping, are applied to assess the reliability of the results. The Student-t test compares two sets of data (e.g., means of observations) to determine if their differences are meaningful or due to random chance (Moore et al., 2014). Bootstrapping, on the other hand, is a method that repeatedly resamples the data to estimate how consistent or stable the results are, even with limited sample sizes (Efron and Tibshirani, 1993).
3 Results
This section presents the results regarding the accuracy of the cloud screening and the functionalities of bias correction. The emphasis is put on the performance at large satellite zenith angles. Furthermore, it shows the OmB statistics in other conventional and remote-sensing observations. Lastly, we show the forecast verification scores computed against observations taken at synoptic surface and radiosonde stations.
3.1 Cloud screening and bias correction
We explore the performance of cloud screening and bias correction in raw radiance data. Statistics of OmB departures by NWCSAF cloud type classification are shown in Figure 3 separately for channels WV062 and WV073. The ‘All’ column, which includes radiances from all cloud types, shows a noticeable cold tail in both channels; the same conclusion holds for most of the other cloud types as well. This is because radiances affected by clouds tend to be colder than the model equivalents computed assuming clear-sky conditions. We aim at homogeneous box-and-whisker plots centered around OmB = 0 and observe this behavior in the NWCSAF cloud types ‘Cloud-free land,’ ‘Cloud-free sea,’ ‘Snow over land,’ and ‘Very low clouds.’ Radiances with these cloud-type pixels are subsequently allowed to enter the bias correction and data assimilation. This approach suits the current study, but future investigations could explore additional scenarios, such as using only the WV062 channel over low and mid-level clouds, where the box-and-whisker spreads appear similar to those of cloud-free scenes.
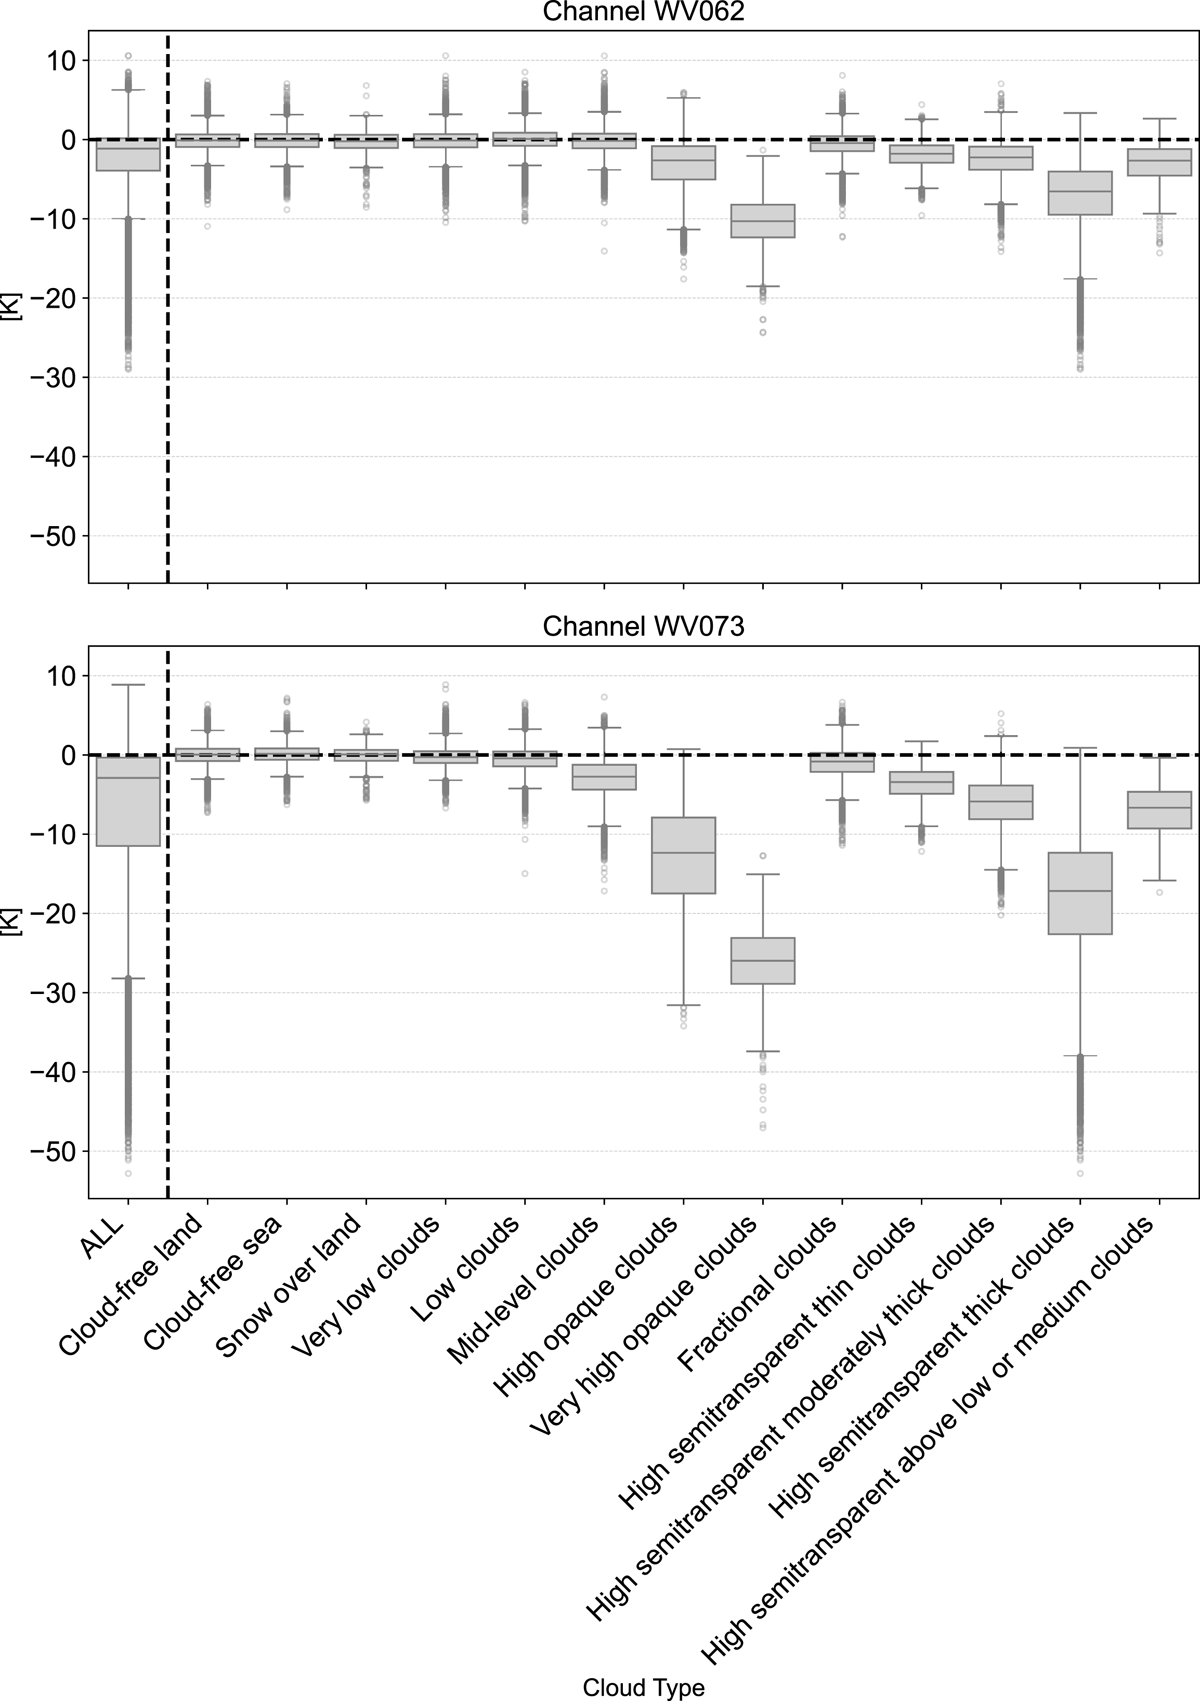
Figure 3
Boxplots of OmB departures in WV062 (top) and WV073 (bottom) for all data (‘ALL’) and by the NWCSAF cloud types. Note the homogenous boxplots at cloud free conditions and the cold tails at certain cloud types indicating that the model equivalents tend to be warmer than cloud-affected observations.
On average, the raw radiances at WV062 and WV073 show small but statistically significant biases, accounting for mean OmBs of 0.65 K and –0.53 K, respectively. Figure 4 illustrates the effect of applying VarBC on channel WV062 for the 03 UTC cycle. In the upper panel, the uncorrected OmB is plotted as a black solid line, and the bias-corrected OmB as a red dashed line. The lower panel shows the evolution of the VarBC coefficients, each corresponding to one of the predictor variables. Predictors do not start from exactly zero because the external method retrieves them after the first Analysis, where they have already been populated. We can confirm however that they were zero prior to this initial Analysis. To allow the VarBC coefficients to adjust toward realistic values, we employ a 14-day spin-up period at the start of 2023 just before the study period (indicated by the gray background in Figure 4). Initially, the predictor values are set to zero, so the uncorrected and corrected OmB values are the same. After some days of cycling, using increasingly more training data, the two lines diverge. The bias correction coefficients stabilize within the 14-day spin-up period, so that changes during the study period are considered negligible. As a result of applying the bias correction, the mean OmBs computed over the study period in channels WV062 and WV073 are reduced to –0.11 K and –0.08 K, respectively. During this spin-up period, SEVIRI observations are assimilated passively, meaning they do not affect the analysis or the forecasts.
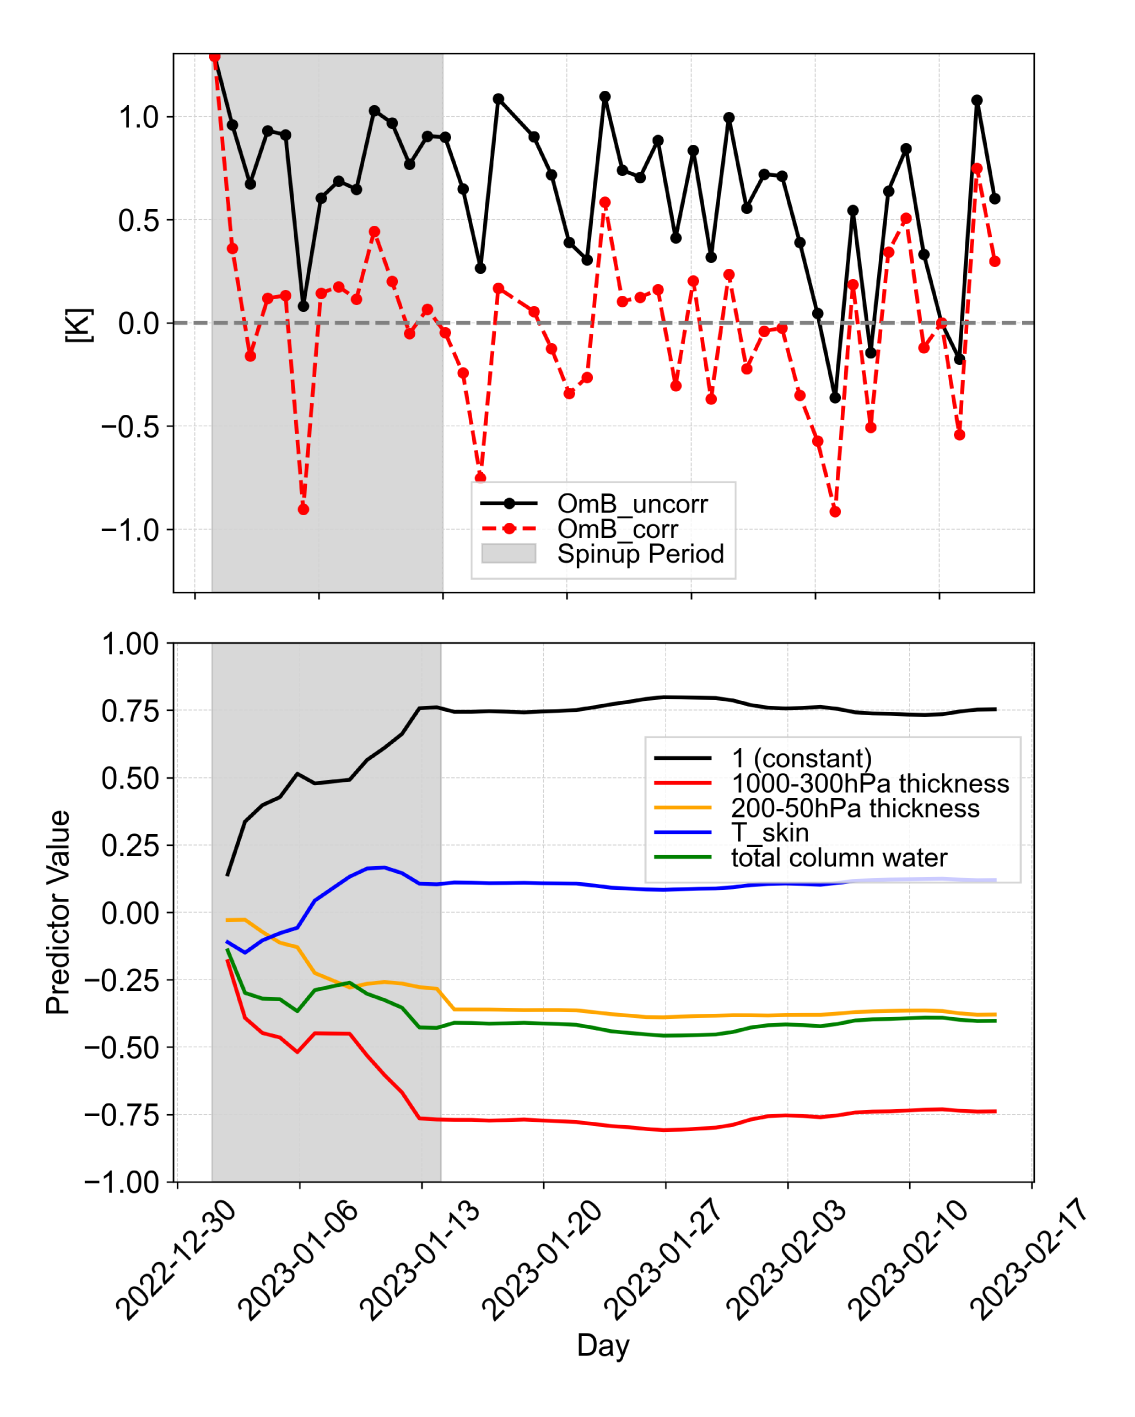
Figure 4
Top: Timeseries of mean OmB by the 03 UTC assimilation cycle in channel WV062. Gray background shows the VarBC spin-up time period. Bottom: the time evolution of each VarBC predictor coefficient in channel WV062.
Table 1 shows a statistical comparison between experiments SEV_75 and SEV_84 in the studied domain of MetCoOp. Comparing SEV_84 with SEV_75, the areal coverage increases by 76.2%, exceeding the 43.4% increase in the number of assimilated data points in the two channels, due to the extension of the pixel footprint at larger SEVIRI zenith angles. The standard deviations (STDV) of OmB decrease in WV062 and increase in WV073, but overall, there are no significant differences between the OmB statistics in the two experiments.
3.2 Zenith angle dependency
Figure 5 shows the Number of Observations along with the mean and standard deviations of OmB departures in 2° zenith angle bins with uncertainty estimates, of which were computed using the bootstrapping method. The Number of Observations is initially increasing from 60°–64° due to domain limitations and then decreasing from 64°–84° due to expansion of the pixel footprint (due to steeper viewing angles). The mean OmB for both channels remains constant between zenith angles of 60°–70° and >70° increases with increasing zenith angle. It is observed that the rate of change is greater in the lower-peaking channel WV073 (red dashed) than in WV062 (blue dashed). The standard deviations indicate a significant zenith angle dependency and degradation in quality for the lower-peaking channel WV073 (red). This zenith-angle dependency is not observed in the higher-peaking channel WV062 (blue). This may be due to the smoother horizontal distribution of water vapor features higher in the troposphere, where WV062 is sensitive, compared to lower levels, reducing the impact of zenith-angle variations (Burrows, 2018).
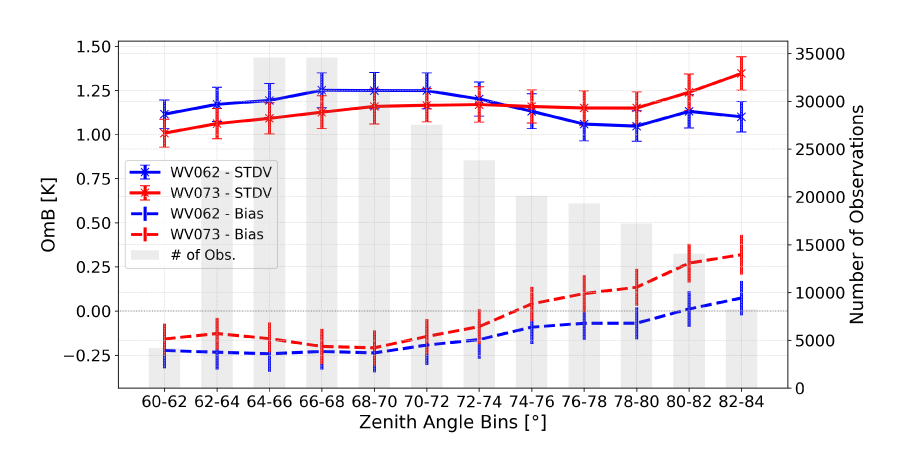
Figure 5
Number of observations, bias and standard deviations of OmB with uncertainty estimation in two-degree bins of Zenith Angles.
Figure 6 shows the frequency distributions of OmB for data collected at zenith angles greater than and less than 75°, separated into two groups. The data characteristics of the two populations differ in terms of both bias and spread. In both WV062 and WV073, OmB values tend to be more positive in data collected at zenith angles >75°. The peaks of the distributions in WV062 are at –0.26 K and 0.18 K for the lower and higher zenith angle populations, respectively. In WV073, these peaks are at –0.18 K and 0.43 K, respectively. In WV062, the spread around the mean is slightly smaller at larger zenith angles, whereas in WV073, the spread remains similar between the two data populations.
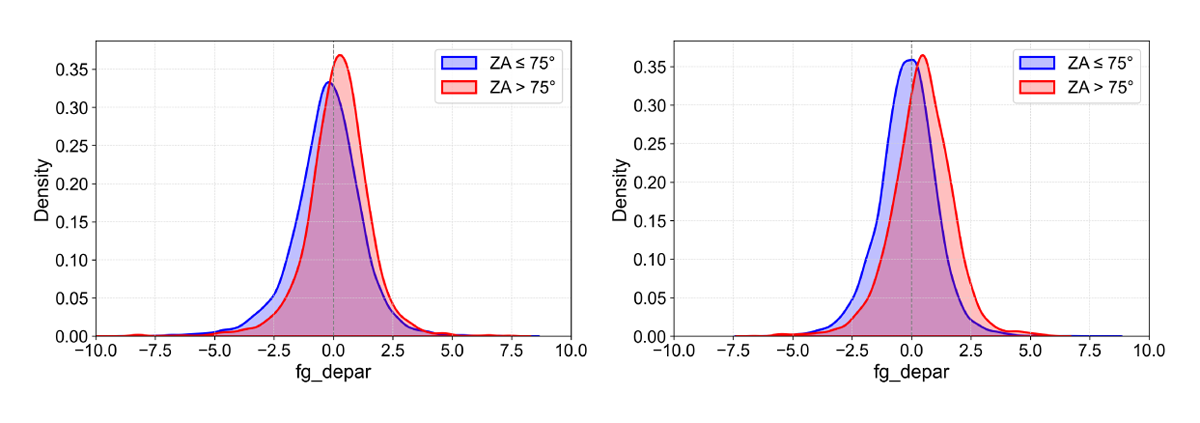
Figure 6
Density plots of OmB departure in the WV channels at zenith angles (ZA) lower (blue) and higher (red) than 75° for channels WV062 (left) and WV073 (right).
3.3 Impact on Data Assimilation
The impact on data assimilation is assessed by comparing analysis increments and OmB departure statistics between the runs. At each cycle, the analysis increments, calculated as the difference between the analysis and the background, are accumulated over the study period. In the REF run, the top-left panel in Figure 7 shows the mean analysis increment for specific humidity on model level 20, close to the 415 hPa pressure level. This is in between the peak levels of the Jacobians for humidity and temperature for WV062 and WV073 (see Figure 2). Larger values occur over the sea than over land, particularly over the northern Atlantic Ocean; however, no pronounced pattern is evident overall. The difference SEV_75 minus REF (the top-middle panel) shows the effect of assimilating SEVIRI radiances up to the limiting 75° satellite zenith angle. There is a systematic moistening of up to 3–4 × 10⁻⁶ kg kg–1 in most of the southern half of the domain, corresponding to the data coverage at this zenith angle threshold. The difference SEV_84 minus REF, shown in the top-right panel, suggests that extending the data use beyond the 75° limit causes the slight moistening effect to spread further north, but not as far north as one might have expected based on the data coverage.
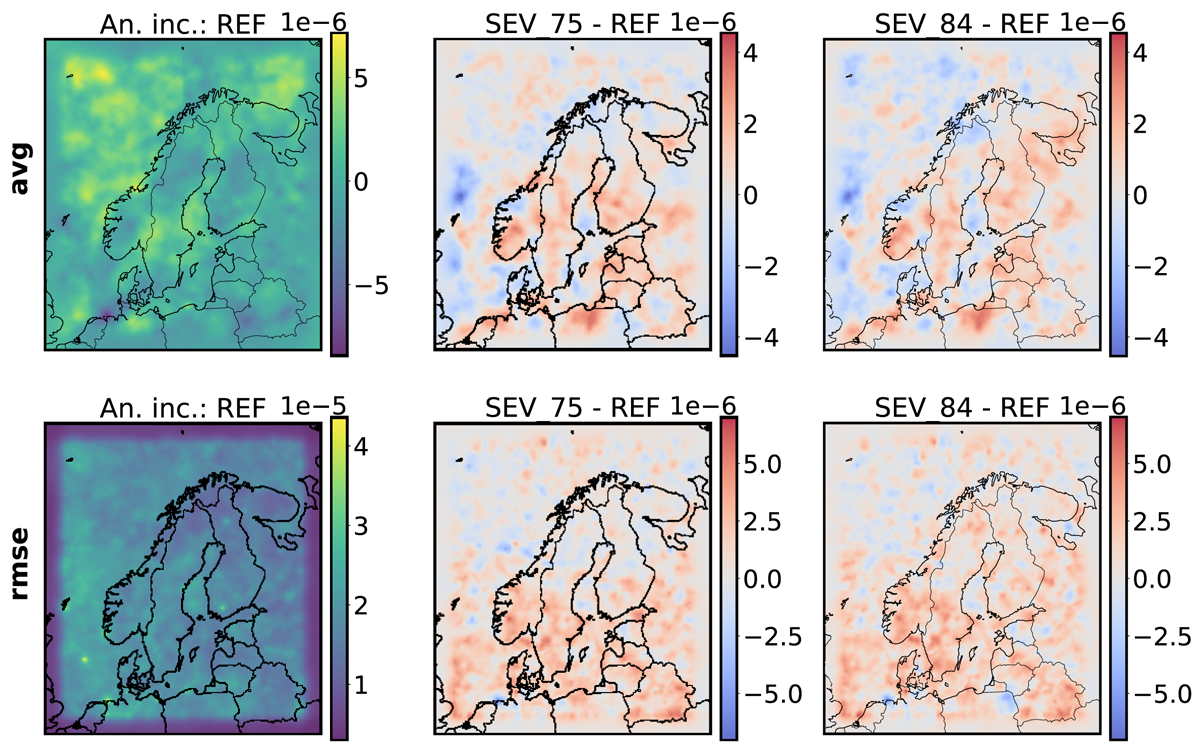
Figure 7
Statistical structure of the analysis increment in specific humidity on level 20 (near 415 hPa). Top: mean increment in REF (left), difference of mean increments in SEV_75 and REF (middle), and difference of mean increments in SEV_84 and REF (right). Bottom: RMS of the increment in REF (left), difference of RMS increments in SEV_75 and REF (middle), and difference of RMS increments in SEV_84 and REF (right). Unit is kg kg–1.
The bottom row of Figure 7 compares the root mean square (RMS) of the accumulated analysis increments in the three runs. In the REF run (bottom left), the analysis increments are relatively uniformly distributed across the domain. It is worth noting that the increments are forced to zero at the lateral boundaries to prevent aliasing of spectral increments from one edge of the domain to the other. Another feature of interest is the presence of several bright blobs indicating larger increments at the locations of radiosonde stations. The RMS difference plots for SEV_75 minus REF and SEV_84 minus REF (bottom-middle and bottom-right panels, respectively) highlight the extraction of meteorological information via the assimilation of SEVIRI data. Again, the influence of SEVIRI is restricted to the southern half of the domain in SEV_75, and it extends considerably further north in SEV_84. The colour scales indicate that the increments due to SEVIRI data are an order of magnitude smaller than those from the assimilation of all other observations.
Figure 8 illustrates the impact that the assimilation of SEVIRI radiances has on the fit of the background field to other observation types. The statistic shown is the standard deviation of the OmB departure in the SEV_75 (red) and SEV_84 (black) runs, normalized by its counterpart in the REF run. Improvement (degradation) in the data fit appears as circles to the left (right) of the 1.0 vertical line. The bars indicate the 95% confidence intervals and are shown as solid lines for statistically significant scores. The data for AMSU-A (leftmost) and MHS (second from left) are aggregated per spectral channels 6–9 and 3–5, respectively. There is a slight improvement in the data fit in all of these channels in both SEV_75 and SEV_84 runs, but the scores are mostly insignificant. The same is true for the radiosonde humidity data (far right), shown on standard pressure levels. The clearest indication of a robust, statistically significant impact appears at the upper-tropospheric-peaking humidity-sounding channels of IASI (third panel from left). Here, the improvement in the data fit is 2–3% in SEV_75 and 5–8% in SEV_84. There is a suggestion of improved data fit in the mid-tropospheric-peaking channels as well, but this signal fails to reach statistical significance.
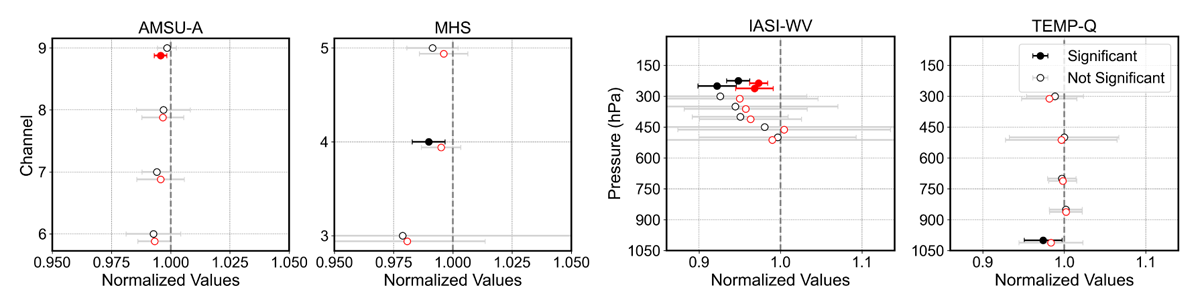
Figure 8
Standard deviation of the OmB departure in SEV_84 (black) and SEV_75 (red), normalized by the standard deviation in REF over the MetCoOp domain from 14 January to 14 February 2023. The statistics are shown for AMSU-A channels 6–9 (leftmost), MHS channels 3–5 (2nd from left), humidity-sounding channels of IASI, aggregated for intervals of the peak pressure of the channels’ weighting function (3rd from left); and specific humidity measurements from radiosondes, at standard pressure levels (far right)
3.4 Impact on Forecasts
Figure 9 shows the forecast impact scorecard for assimilating SEVIRI radiance data within the MetCoOp domain. The impact shown on the left compares SEV_84 to the reference run (REF), where no SEVIRI data were assimilated. The impact on the right compares SEV_84 to SEV_75, highlighting the contribution of data assimilated between zenith angles of 75° and 84°. The scorecards use triangles to indicate the sign and level of statistical significance as a function of forecast lead time for various meteorological parameters. Upward-facing blue triangles represent statistically significant improvements in the forecast variables, while downward-facing red triangles indicate degradations.
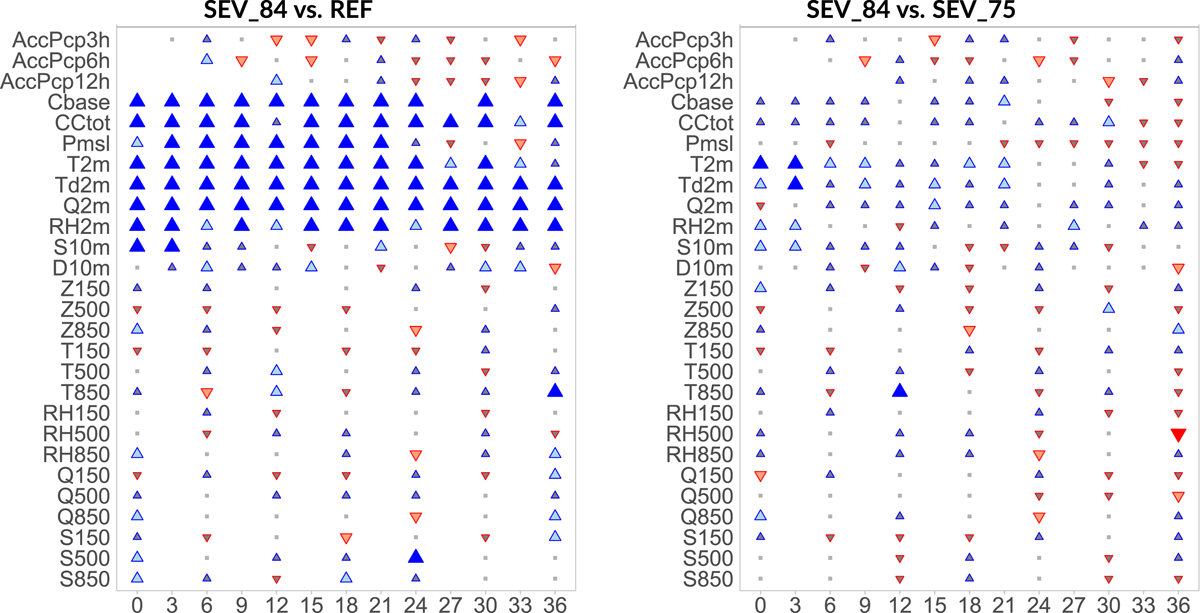
Figure 9
RMSE scorecards over the MetCoOp domain for surface and upper-air variables from 14 January to 14 February 2023, comparing experiments SEV_84 vs. REF (left) and SEV_84 vs. SEV_75 (right). Scorecards show differences in forecasts against in-situ observations, using SYNOP for surface variables and radiosondes for upper-air variables. Three sizes of blue upwards facing triangles show levels of significant improvements of SEV_84 vs. REF/SEV_75. Vice versa for red downwards facing triangles, which show degradations. See Table 2 for a description of the variables.
Table 2
Description of Variables Used in scorecards verification.
| CATEGORY | DESCRIPTION |
|---|---|
| Accumulated Precipitation (AccPcpXh) | 3, 6, 12 hour accumulations |
| Clouds | Cloud base height in meter (Cbase), Total cloud cover in Octa (CCtot) |
| Surface Variables | Air pressure at mean sea level (Pmsl), 2-meter Air temperature (T2m), |
| Dew point temperature (Td2m), Specific humidity (Q2m) and | |
| Relative humidity (RH2m), 10-meter Wind speed (S10m) and | |
| Wind direction (D10m) | |
| Upper-air Variables at 150, 500, 850 hPa | Geopotential (Z), Air temperature (T), Relative humidity (RH), |
| Specific humidity (Q) and Wind speed (S) |
The greatest benefit from assimilating SEVIRI radiances is observed in forecasts of cloud-related variables (cloud base height, total cloud cover), near-surface humidity (Q2m, RH2m), and temperature (T2m), particularly when comparing SEV_84 with REF. These improvements are most significant in the first 24 forecast hours. Furthermore, the observed humidity improvements are supported by the enhanced agreement with radiosonde humidity observations, as discussed in Section 3.3. Mean sea level pressure (Pmsl) also shows consistent gains in the first 24 hours, but the effect becomes variable beyond that. The relative strength of the improvements in humidity-related variables is in agreement with the sensitivity of SEVIRI WV channels to atmospheric humidity. For surface winds (S10m, D10m), the impact is minor and is mostly limited to the first 12 hours, after which it becomes neutral.
For some variables, such as accumulated precipitation, the impact is mixed and leans slightly towards negative territory but with weak significance. This may partly reflect limitations in pointwise verification, which is susceptible to the ‘double penalty’ issue where model errors in spatial positioning of precipitation lead to exaggerated verification scores (Plas et al., 2017). Similarly, for upper-air parameters such as temperature, humidity, and wind, the impact is generally small and less significant. This is likely due to the limited number of radiosonde observations compared to surface measurements and the fact that radiosondes are prone to drift during their ascent, particularly in strong winds, which reduces accuracy at higher altitudes.
The comparison of SEV_84 with SEV_75 in the right panel of Figure 9 shows fewer statistically significant impacts, since this comparison isolates the effect of extending the assimilation to zenith angles between 75° and 84°. Positive contributions can still be observed for cloud-related variables (CBase, CCtot) and near-surface parameters (T2m, Td2m, Q2m) during the first 21 forecast hours. The impact on other variables is generally neutral, indicating that there is no significant harm from assimilating SEVIRI radiances at larger zenith angles.
Figure 10 provides further detail on surface variables of Pmsl, T2m, RH2m, S10m, and CBase. The left column shows the bias for REF (black solid), SEV_75 (red dotted), and SEV_84 (red dashed), while the middle and right columns show normalized RMSE differences for SEV_84 vs. REF and SEV_84 vs. SEV_75, with bootstrapped uncertainty estimates. The biases for Pmsl, T2m, RH2m, and CBase show consistent reductions for SEV_84 compared to REF in the first 21 hours, while S10m biases remain largely unchanged. A similar pattern and magnitude in bias reduction is observed for SEV_75 compared to SEV_84. RMSE differences confirm significant improvements for Pmsl and T2m, especially during the first 21 hours, and for RH2m over the full 36-hour forecast period. Improvements for CBase are largest, with reductions in normalized RMSE of up to 4% persisting throughout the forecast length. For S10m, improvements are limited to the first 3 hours and are small in magnitude.
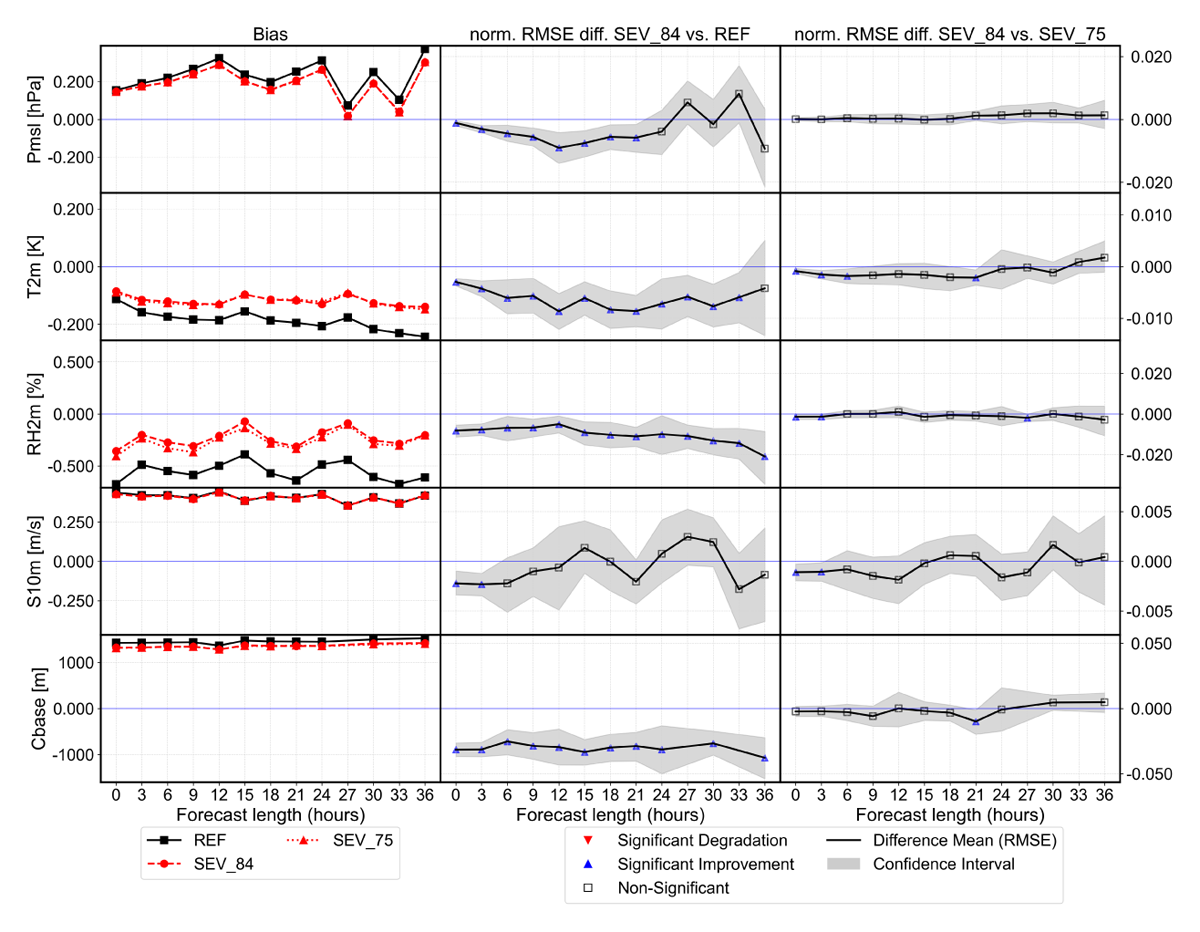
Figure 10
Verification for surface variables Pmsl, T2m, RH2m, S10m and Cbase by forecast length for the MetCoOp domain from 14 January to 14 February 2023. Left column shows bias of REF (black), SEV_75 (red dotted) and SEV_84 (red dashed). Middle and right columns show the differences in normalized RMSE of SEV_84. vs. REF and SEV_84 vs. SEV_75 with uncertainty estimates (shading). Note the improved Bias and RMSE in Pmsl, T2m and RH2m in the first 21 hours, the significantly improved RMSE for Cbase in SEV_84 vs. REF and the diminished effect when compared to SEV_75.
Lastly, Figure 11 shows verification against radiosonde observations of temperature, dew point temperature, and relative humidity. Biases improve for temperature and dew point temperature between 925 and 500 hPa, while standard deviations, which reflect forecast skill, show gains for dew point temperature and relative humidity between 850 and 700 hPa. These improvements are modest, likely limited by the small radiosonde sample size and higher uncertainties at higher altitudes. The latter is due to the fact that no corrections due to radiosonde drift are applied in the assimilation or verification.
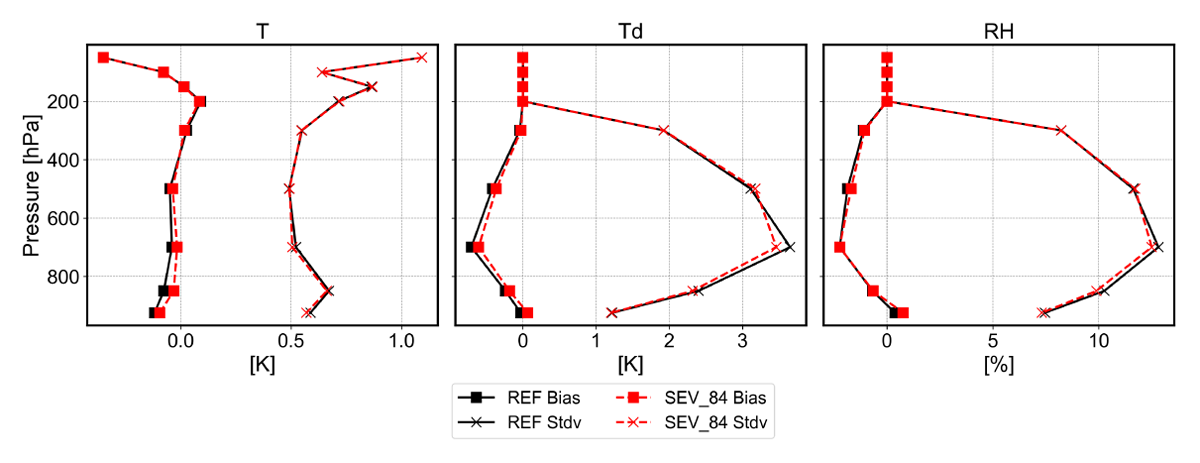
Figure 11
Verification of vertical profiles of temperature (T), dewpoint-temperature (Td) and relative humidity (RH) forecasts against observations from radiosondes over the MetCoOp domain between 14 January and 14 February 2023.
In summary, the forecast verification confirms the benefit of assimilating SEVIRI radiances. The strongest improvements originate from data with zenith angles less than 75°, but extending the assimilation to angles between 75° and 84° provides additional gains for some variables without introducing degradations. This supports the feasibility of extending the use of SEVIRI data beyond the 75° cutoff to maximize its impact, particularly for high-latitude limited-area models. Overall, forecast verification indicates a net positive impact, with normalized RMSE reductions averaging 1–4% for key surface and cloud-related variables in the first 24 hours, and largely neutral effects for upper-air and precipitation forecasts.
4 Discussion
Geostationary satellites, such as those carrying the SEVIRI instrument, provide a clear advantage over polar-orbiting satellites by delivering satellite radiances much more frequently, every 15 minutes, compared with up to four daily overpasses typical of polar orbiters in the MetCoOp domain. To explore the benefits of assimilating SEVIRI Water Vapour radiances in clear-sky conditions over the high-latitude MetCoOp domain, we carried out three numerical experiments (REF, SEV_75, and SEV_84) over a 31-day period using eight daily assimilation cycles within the limited area model HARMONIE-AROME. The results are promising and have led to a pre-operational usage of SEVIRI WV channels in MetCoOp with a similar geographical extent. However, several aspects of the study need further discussion.
4.1 Limitations of the Present Study
One limitation of this study is that it only covers a single 31-day winter period. To fully understand how the impact of SEVIRI WV channel assimilation changes during the year, experiments across different seasons would be needed. Another issue is in the small number of radiosonde launches, which reduces the reliability of upper-air verification results. Radiosondes also drift during their ascent due to wind, and this is not corrected in either the data assimilation or verification stages. This drift adds further uncertainty to the results of verification in the vertical.
A further limitation is the use of the 3D-Var assimilation method with a fixed background error covariance matrix (B-matrix). While 3D-Var improves temperature and humidity fields, it does not include flow-dependent error information and is less effective in producing wind increments from radiance data, unlike more advanced methods such as 3DEnVar (Montmerle et al., 2018) and 4D-Var (Peubey and McNally, 2009). For example, Peubey and McNally (2009) and Lean et al. (2021) demonstrate the extraction of meaningful wind increments (through the humidity tracing effect) from assimilating SEVIRI radiances in 4D-Var.
Another aspect to consider is the exclusion of humidity from the large-scale mixing process in HARMONIE-AROME. While temperature and wind fields are combined with the boundaries using large-scale mixing, humidity fields remain more independent. This could create more opportunities for data assimilation, particularly from SEVIRI WV radiances, to improve the representation of atmospheric moisture. The positive impact of SEVIRI WV assimilation on humidity fields, as discussed in Section 3.4, may partially stem from this gap in large-scale mixing.
4.2 Limitations of SEVIRI Data
SEVIRI data are limited to a maximum satellite zenith angle of 84°, beyond which there are no cloud products available. This is the reason for the 84° cutoff in our experiments. Using the newer RTTOV coefficients (v9 instead of v7) allowed us to extend the assimilation from the previous 75° limit to 84°, which significantly increases the data coverage in high-latitude areas.
Observation-minus-background (OmB) statistics show that the lower-peaking WV073 channel is more affected by errors at higher zenith angles, while the statistics in the higher-peaking WV062 channel are stable.
The cloud-screening method during the dark winter period seems to work well, but might behave differently in seasons other than winter, when the visible channels play a larger role. The complex terrain in our model domain may also slightly influence the results, as the WV073 channel might be affected by high-altitude topography. However, this effect is expected to be small.
4.3 Impact of Dry Winter Conditions on Water Vapour Channel Sensitivity
The dry atmosphere during the Scandinavian winter may increase the sensitivity of the SEVIRI WV channels, particularly the lower-peaking WV073 channel, to near-surface conditions. In standard conditions, the WV channels are primarily sensitive to mid-tropospheric humidity, but in very dry atmospheres their weighting functions shift downward, allowing them to capture more information from the boundary layer and possibly the surface. This increased sensitivity to lower levels could explain the positive forecast scores observed for surface parameters, such as the screen-level temperature and humidity, in our experiments.
4.4 Future Developments
Future research could improve SEVIRI WV channel assimilation in several ways. Adding satellite zenith angles as a predictor in the Variational Bias Correction (VarBC) could help reduce remaining small biases at the large satellite zenith angles. Observation error characteristics and thinning distances, which are currently set constant, could also be adjusted to reflect the range of viewing angles in the assimilated data. For example, smaller observation errors could be assigned to data measured at smaller zenith angles.
Another promising area is to account for the geometry of the slant-path in the calculation of radiative transfer (Bormann, 2017). Modifying the model equivalents to better match the true observing geometry has already shown improvements in global NWP systems (Bormann, 2017; Shahabadi et al., 2018). Finally, using more advanced assimilation methods like 3DEnVar or 4D-Var could help improve error estimates and better capture the effects of the humidity tracer advection.
5 Conclusions
This study shows the potential in assimilating SEVIRI Water Vapour radiances beyond the traditional 75° zenith angle limit. Going beyond the 75° limit is possible when using new RTTOV coefficients that allow to use the data up to 84° satellite zenith angles. This increases the coverage inside our specific high-latitude limited area modelling domain by approx. 76%.
The results demonstrate clear improvements in the analysis of humidity and temperature, leading to better forecasts of key variables such as mean sea level pressure (Pmsl), 2-meter temperature (T2m), 2-meter relative humidity (RH2m), and cloudbase and total cloud cover over the verified MetCoOp domain. The stronger impact on humidity-related variables agrees with the sensitivity of SEVIRI WV channels to moisture and the flexibility of the HARMONIE-AROME system in adjusting the humidity field.
The impact on wind and precipitation is less clear. Precipitation shows mixed results, possibly partially due to limitations of the pointwise verification method. Verification of upper-air variables shows small improvements, although their reliability is reduced due to the limited number of radiosonde launches and uncertainties associated with the radiosonde drift during the ascent.
Despite these limitations, this study highlights the potential of the assimilation of the humidity-sensitive channels of SEVIRI in high-latitude limited area models. This will be a good basis for further study and provides support to the idea of implementing the assimilation of these data sources in operational systems such as at MetCoOp.
Acknowledgements
The authors would like to thank Magnus Lindskog (Swedish Meteorological and Hydrological Institute) and Stephanie Guedj (Norwegian Meteorological Institute) for their fruitful discussions and valuable insights during the course of this study. We are also grateful to the ACCORD and HIRLAM consortia for providing the source code and scripting system necessary to run the HARMONIE-AROME model. Additionally, we extend our thanks to MetCoOp for supplying the boundary and observational data that were essential for conducting this research.
We also thank the two anonymous reviewers for their constructive feedback.
Competing Interests
The authors have no competing interests to declare.
Author Contributions
All authors contributed equally.