
Table 1
Overview of the EURO-CORDEX GCM-RCM chains (including references) used in this study. Every RCM is driven by every GCM. The given 30-year periods correspond to the period where the GCMs reach a global warming level (GWL) of +2°C (GWL2) and +3°C (GWL3) compared to the pre-industrial period. The model codes (A–E for GCMs, 1–4 for RCMs) refer to the ones used in Supplementary Figures S9 and S10.
| GWL2 | GWL3 | GCM | RCM |
|---|---|---|---|
| 2029–2058 | 2052–2081 | A. CNRM-CERFACS-CNRM-CM5 (Voldoire et al., 2013) | 1. CLMcom-ETH-COSMO-crCLIM-v1-1 (Sørland etal., 2021) |
| 2026–2055 | 2051–2080 | B. ICHEC-EC-EARTH (Prodhomme et al., 2016) | 2. KNMI-RACMO22E (Meijgaard et al., 2012) |
| 2029–2058 | 2052–2081 | C. MPI-M-MPI-ESM-LR (Giorgetta et al. 2013) | 3. SMHI-RCA4 (Samuelsson et al., 2011) |
| 2016–2045 | 2037–2066 | D. MOHC-HadGEM2-ES (Martin et al., 2011) | 4. MOHC-HadREM3-GA7-05 (Tucker et al., 2022) |
| 2031–2060 | 2057–2086 | E. NCC-NorESM1-M (Bentsen et al. 2013) |
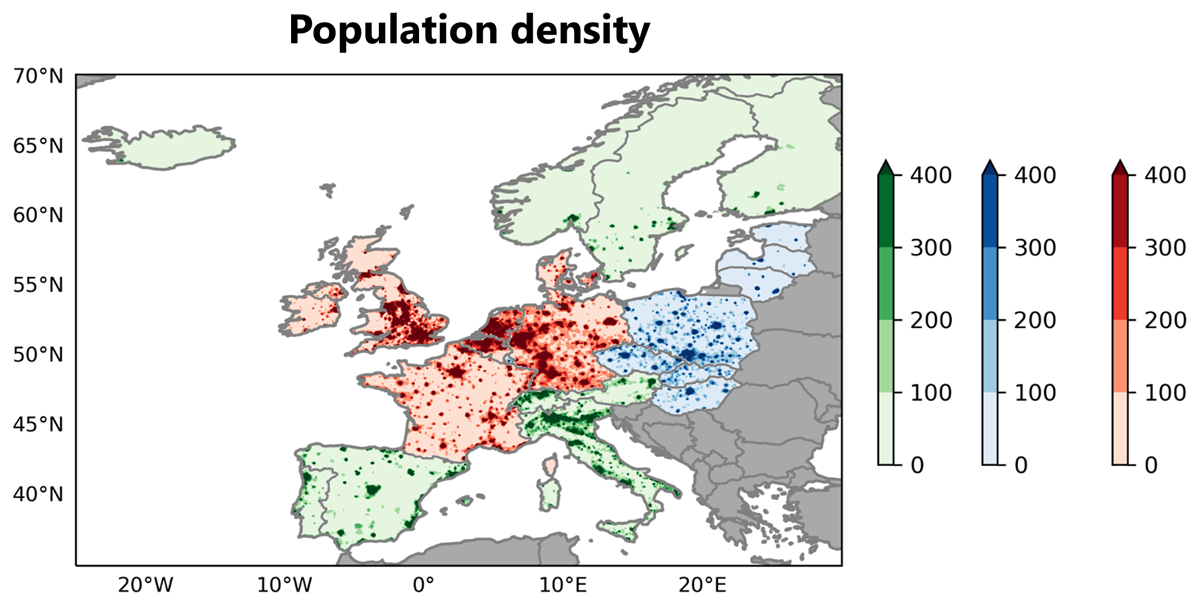
Figure 1
Population density in Europe (P km–2) for the year 2020 with Core Europe in red, Eastern Europe in blue, all other analyzed countries in green, and non-considered countries in grey.
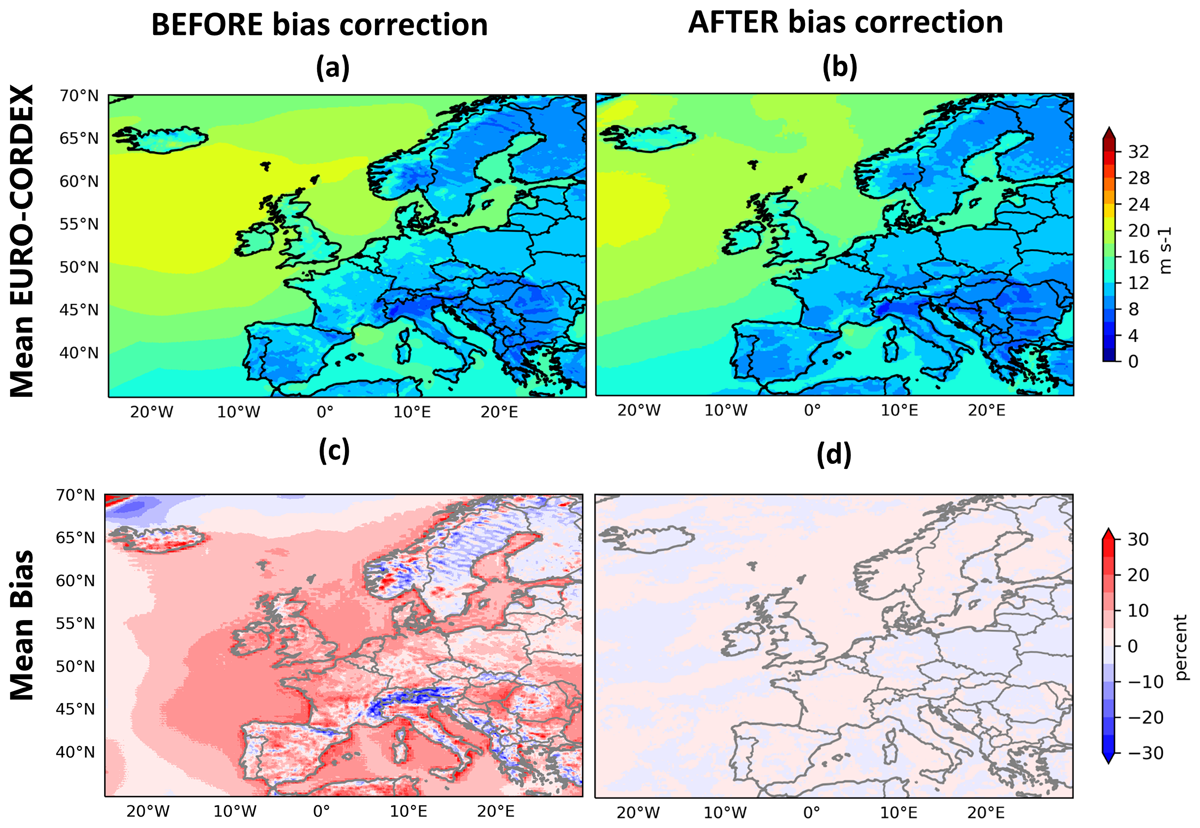
Figure 2
(a-b) Mean of daily maximum wind gust (m s–1) for the ensemble mean of the EURO-CORDEX historical simulations (1976–2005) before bias correction (a), and after bias correction using Empirical Quantile Mapping (b). (c-d) Difference between the EURO-CORDEX ensemble mean and ERA5 (%).
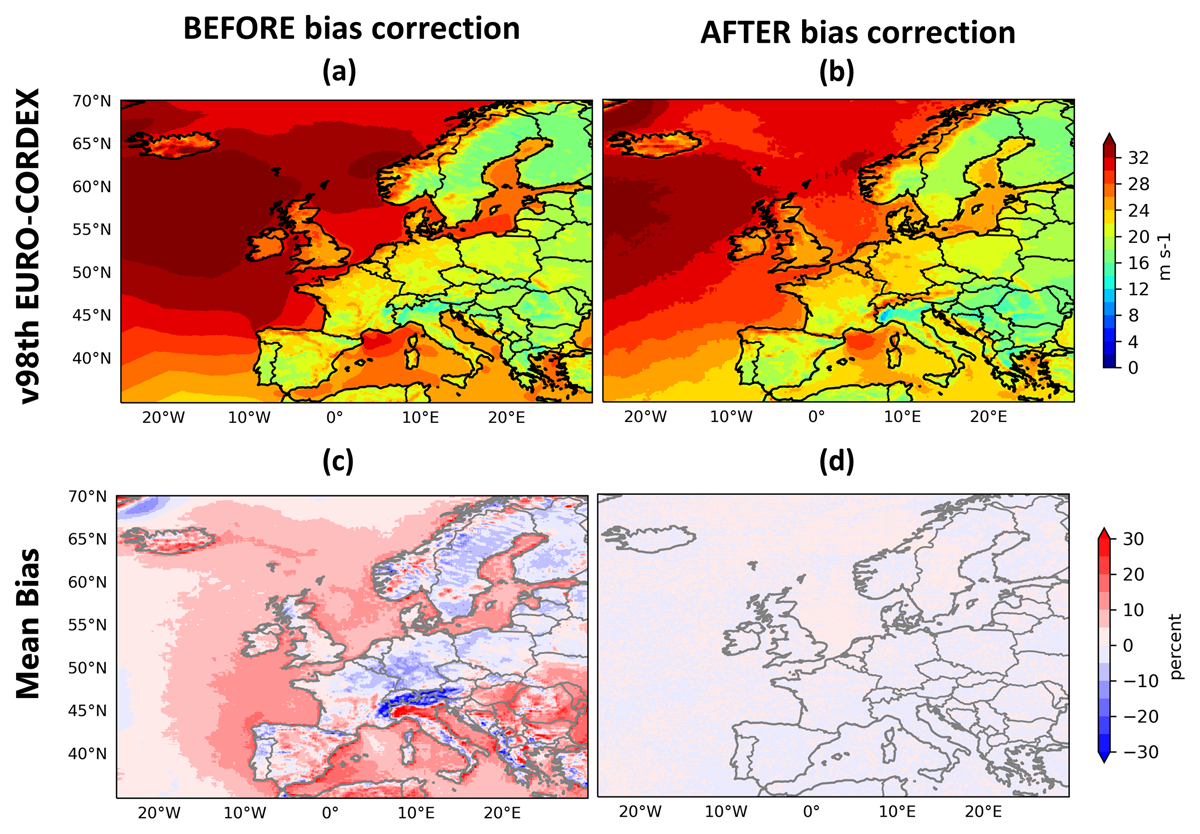
Figure 3
Same as Figure 2, but for the 98th percentile of daily maximum wind gust.
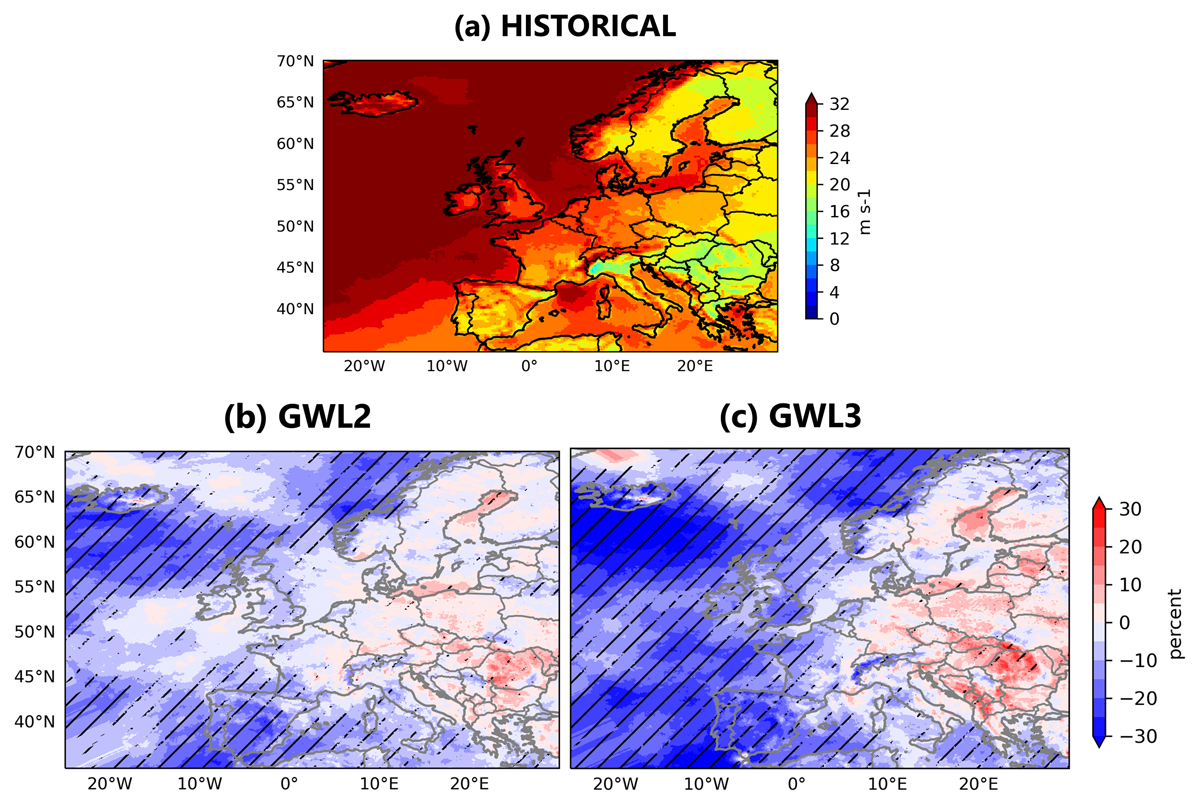
Figure 4
(a) Windstorm intensity (m s–1), shown as wind gust speed above the 98th percentile, derived from the EURO-CORDEX ensemble mean for the historical period (1976–2005). Changes in windstorm intensity (%) compared to the historical period for the ensemble mean of (b) GWL2, and (c) GWL3. Black diagonal lines indicate robust climate change signals, meaning that 14 or more ensemble members agree on the sign of change.
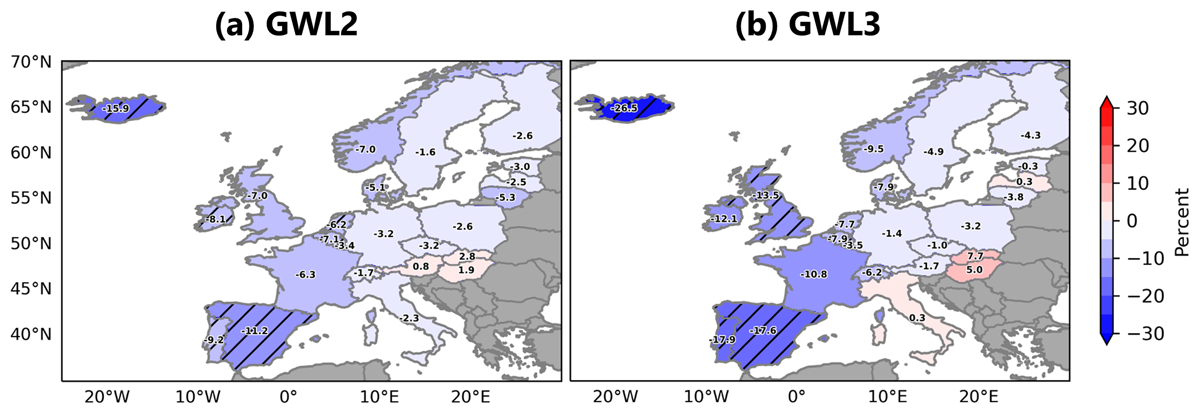
Figure 5
Changes in windstorm frequency (%) compared to the historical period for the ensemble mean for (a) GWL2, and (b) GWL3. Black diagonal lines indicate robust climate change signals, meaning that 14 or more ensemble members agree on the sign of change.
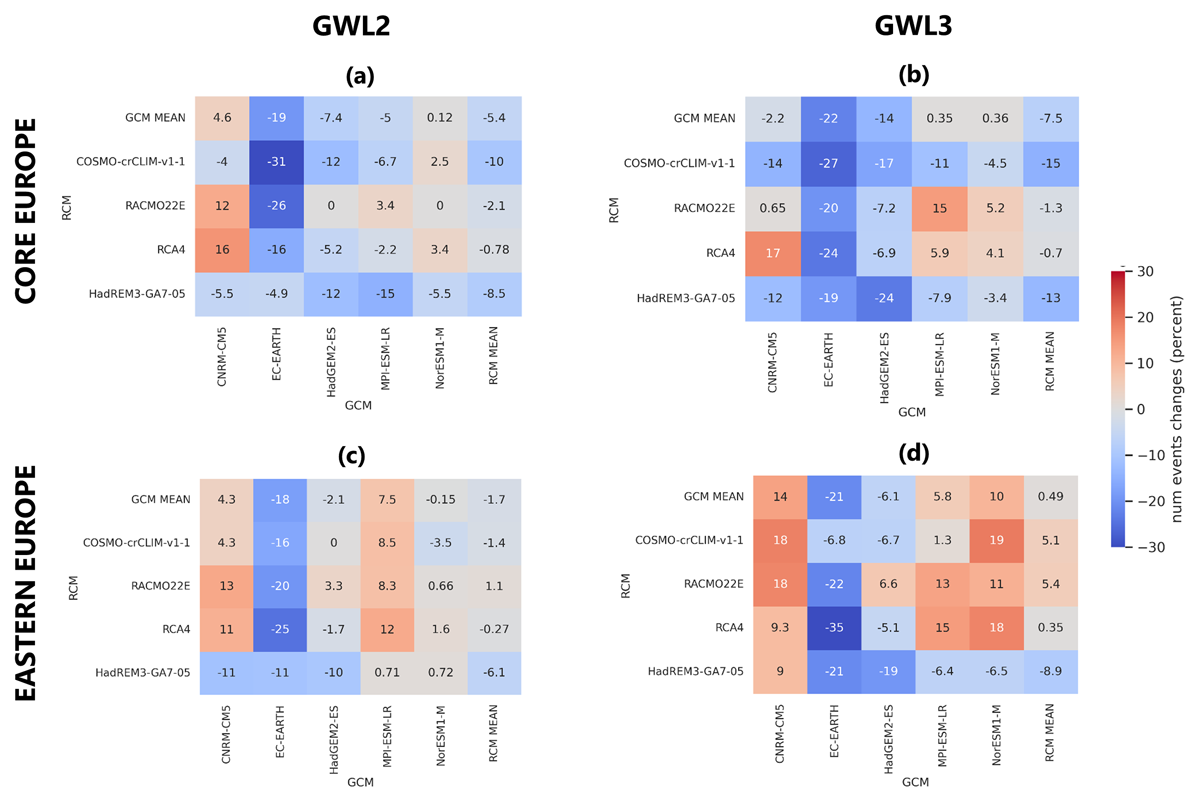
Figure 6
Changes in windstorm frequency (%) compared to the historical period for the individual ensemble members derived for Core Europe (upper row) and Eastern Europe (lower row) for (a) GWL2, and (b) GWL3. For each matrix, rows represent RCMs and columns GCMs. The RCM (GCM) mean is depicted in the last column (first row).
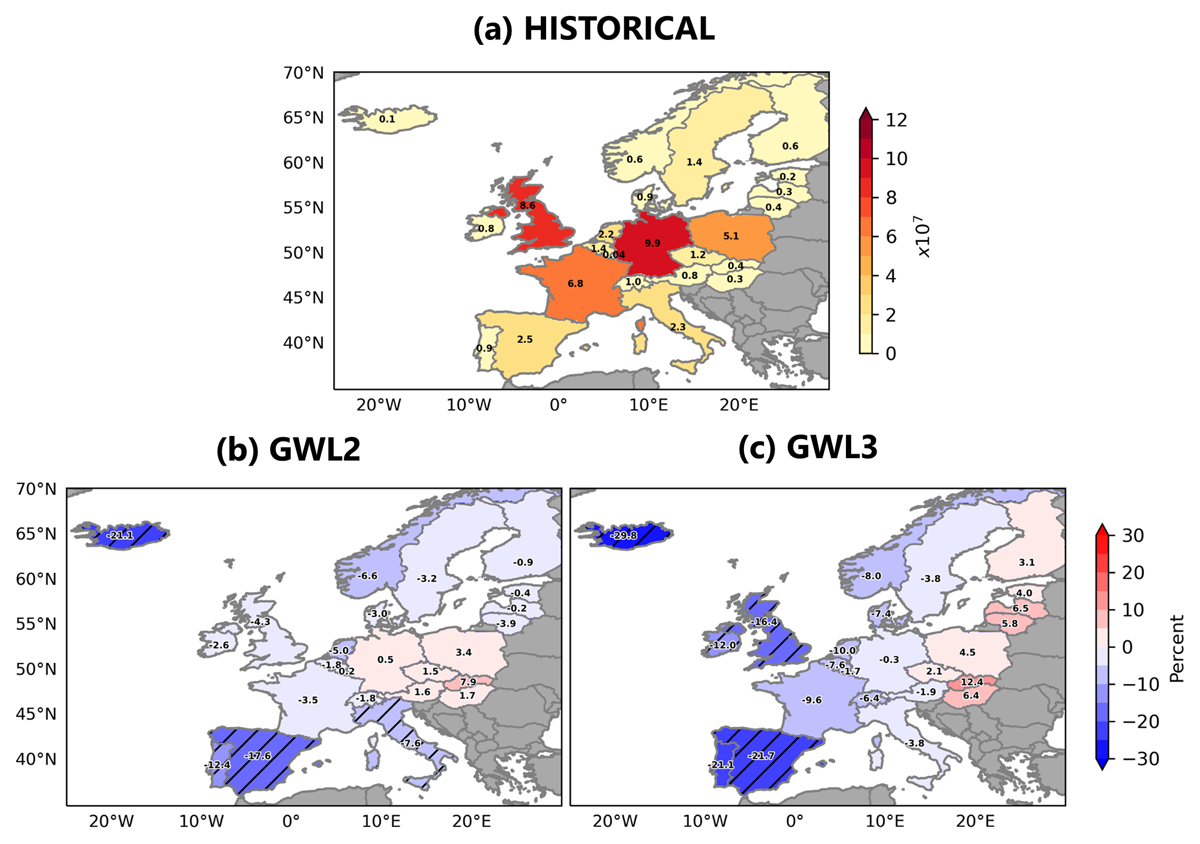
Figure 7
(a) Windstorm loss, shown as total LI, derived from the EURO-CORDEX ensemble mean for the historical period (1976–2005). Changes in windstorm loss (%) compared to the historical period for the ensemble mean for (b) GWL2, and (c) GWL3. Black diagonal lines indicate robust climate change signals, meaning that 14 or more ensemble members agree on the sign of change.
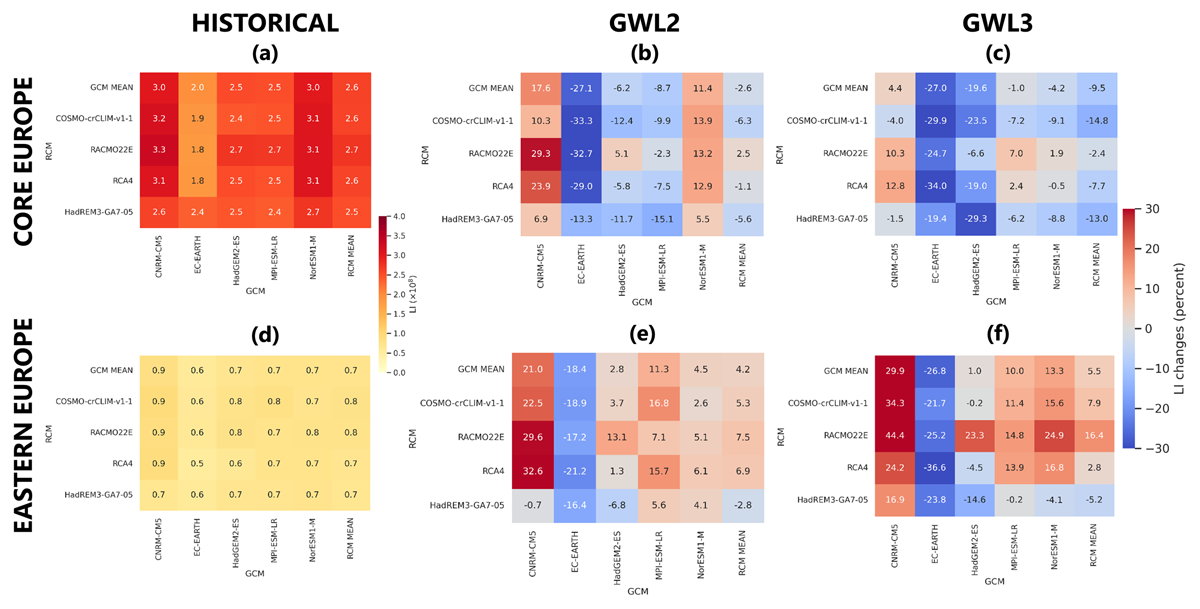
Figure 8
Windstorm loss derived for Core Europe (a) and Eastern Europe (d) for the individual ensemble members for the historical period (1976–2005). Changes in windstorm loss (%) compared to the historical period for the individual ensemble members for (b,e) GWL2, and (c,f) GWL3. For each matrix, rows represent RCMs and columns GCMs. The RCM (GCM) mean is depicted in the last column (first row).
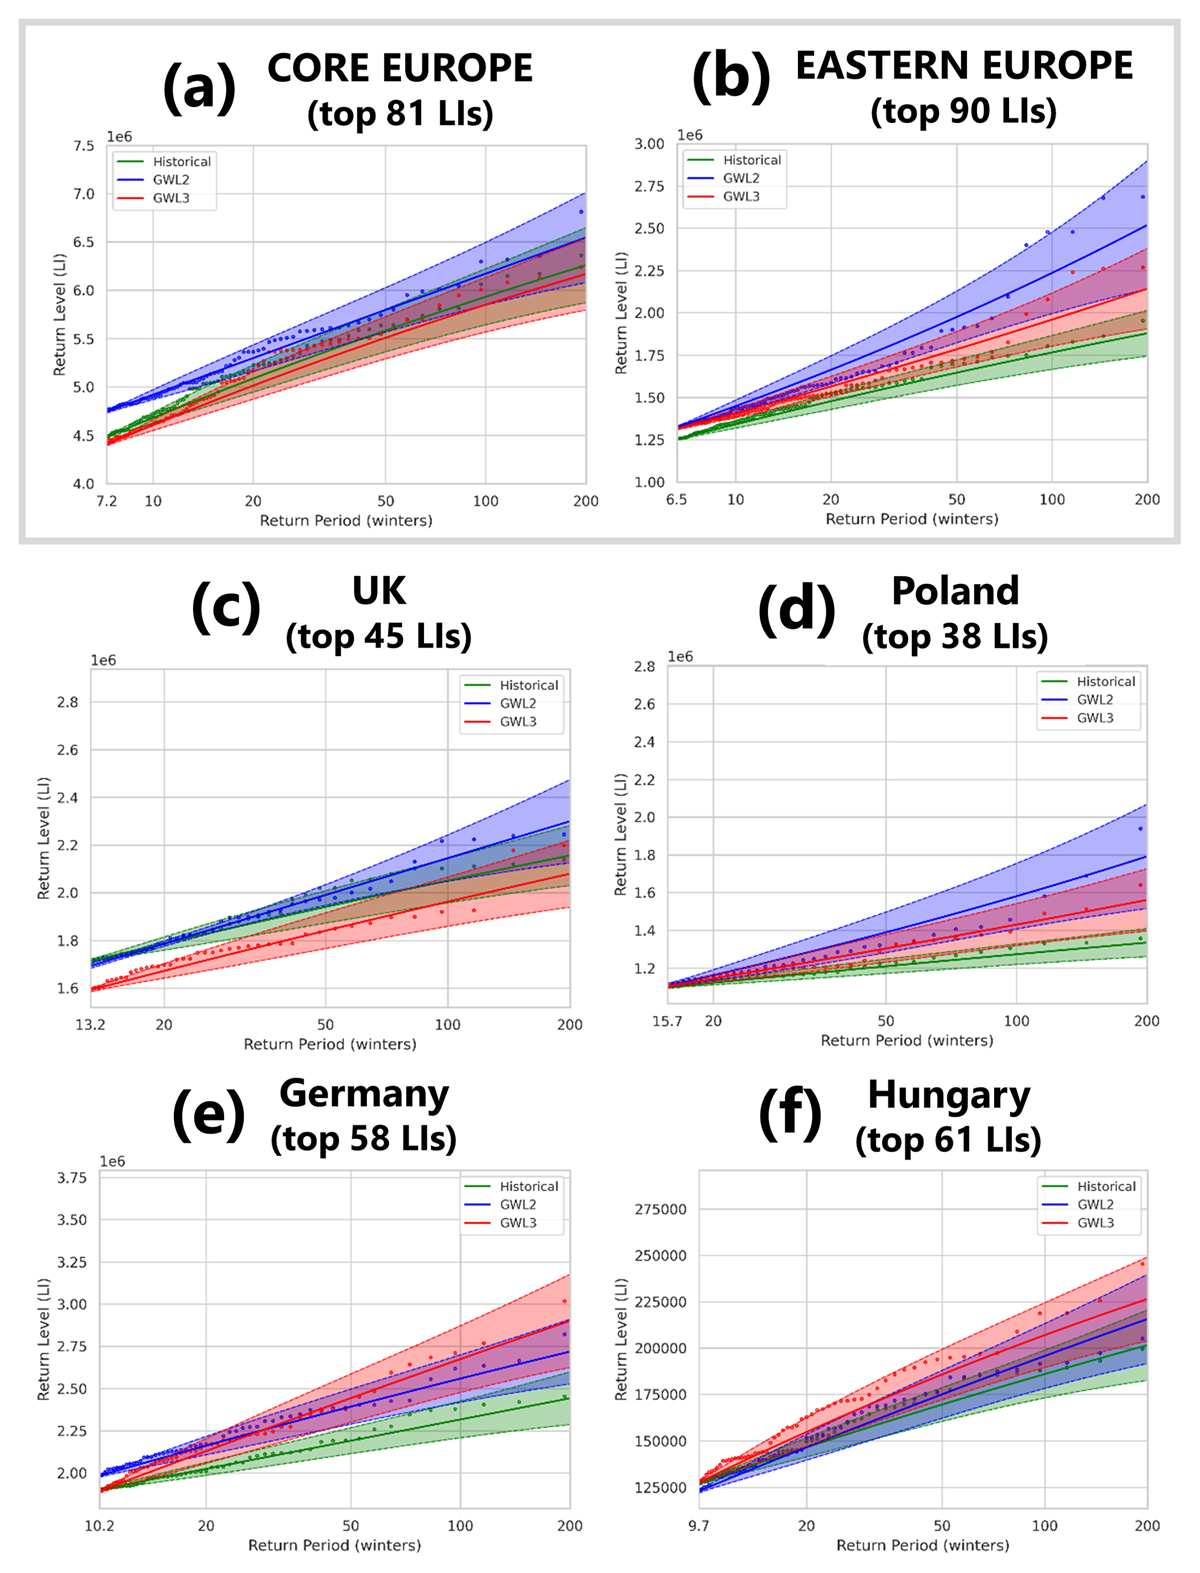
Figure 9
Return periods of the most extreme loss events derived for (a) Core Europe and (b) Eastern Europe for the historical period (green), the GWL2 (blue), and the GWL3 (red). The dots represent the empirical values, the solid lines show the GPD fit, and the dashed lines represent the upper and lower bounds of the 95% confidence interval. Same as (a) and (b), but for countries belonging to Core Europe (c,e) and Eastern Europe (d,f). The number of top LIs used in these figures are based on the stability of the scale and shape parameters of the GPD fit.