
1 Introduction
Windstorms are one of the main natural hazards affecting Europe and have led to significant societal impacts over the last decades (e.g. Schwierz et al., 2010; Munich Re, 2022). Windstorms are intense extratropical cyclones that induce severe wind gusts and heavy precipitation, thus sometimes leading to fatalities, infrastructure damage, and disruptions to electricity and transportation systems (Fink et al., 2009; Mitchell-Wallace et al., 2017; Pinto et al., 2019; Gliksman et al., 2023). Prominent examples include the windstorms Anatol and Lothar in December 1999 (Ulbrich et al. 2001), windstorm Kyrill in 2007 (Fink et al., 2009), and windstorms Ciara and Dennis in 2020 (Jardine et al., 2023). In 2022, European windstorms reached the highest aggregated insured losses since 2013 with about $5.7 billion, which is above the long-term (2000–2021) average of $3.2 billion (Aon, 2023). Thus, the quantification of wind-related risks is key, both to potentially forecast the impacts associated with impending events and to provide a wide perspective of windstorm risk for various sectors in a warming world (Pinto et al., 2019; Merz et al., 2020; Gliksman et al., 2023).
With this aim, a wide variety of storm severity indices and loss models have been developed and applied over the last three decades (see review by Gliksman et al. (2023)). For example, Lamb (1991) developed a first storm severity index that considered the observed peak wind over land, the storm duration and the affected area. Later, Klawa and Ulbrich (2003) developed another simple storm loss model that related exceedances of a local wind gust threshold to windstorm-associated damage to buildings and infrastructure. They considered the daily maximum wind gusts from German weather stations, and scaled it with the local 98th percentile, based on the assumption that no significant losses occur below it (roughly 20 ms–1). Values exceeding the 98th percentile were cubed (v3) to account for the wind’s destructive power and were weighted with the population density as a proxy for the local insured property. Finally, a linear relationship was taken using loss data from the German Insurance Association to determine market losses. Such models establish thus a relationship between meteorological wind (gust) data and building damage by using so-called damage functions (Prahl et al., 2015). Many studies and approaches were developed over the last two decades, focusing on observational data, reanalysis and climate model datasets (e.g. Leckebusch et al., 2008; Pinto et al., 2012; Prahl et al., 2015; Gliksman et al., 2023; Moemken et al., 2024a).
While Europe has a long historical record of destructive windstorms (e.g. Roberts et al., 2014; MunichRe, 2023; Moemken et al., 2024b), decadal variability dominates on longer time scales and no clear long-term trends can be identified for the historical period, but rather periods of low activity, such as in the 1960s and high activity, as in the 1990s (e.g. Feser et al., 2015; Raible et al., 2021). For the 21st century, general circulation model (GCM) projections show a general decrease in the total number of extratropical cyclones (e.g. Ulbrich et al., 2009; Zappa et al., 2013; Raible et al., 2021). However, for the North Atlantic/European region and wintertime, an increase in extreme windstorms has been identified for the North Sea region, a general pattern consistent between Coupled Model Intercomparison Project (CMIP; https://www.wcrp-climate.org/wgcm-cmip) CMIP3, CMIP5 and CMIP6 but sensitive to the choice of GCMs and scenarios (e.g. Bengtsson et al, 2006; Pinto et al., 2009; Zappa et al., 2013; Harvey et al., 2020; Priestley and Catto, 2022). For a comprehensive risk assessment at the regional level, it is thus imperative to employ an ensemble of high-resolution climate simulations to ensure the best possible estimates.
On the global scale, the World Climate Research Program (WCRP) CMIP provides a large and very valuable database for GCM simulations following a variety of scenarios (IPCC, 2007; 2013; 2021). However, the low GCM resolution (on average 100 km for CMIP6, lower for the previous CMIPs) strongly limits their value for impact analysis on the regional scale. To overcome this caveat, the WCRP launched the Coordinated Regional Downscaling Experiment (CORDEX; http://wrcp-cordex.jussieu.fr/; Giorgi et al., 2009), which aimed at dynamically downscaling CMIP GCM simulations and generated ensemble regional climate projections for different regions worldwide. For Europe, EURO-CORDEX (http://www.euro-cordex.net) is the common CMIP5 framework to provide regional climate model (RCM) projections for Europe at 50 km (EUR-44) and 12 km (EUR-11) resolution (Jacob et al., 2014). The refined resolution and better representation of physical processes relevant at the regional scale led to a better representation of regional characteristics and variability compared with the GCMs (Demory et al., 2020; Iles et al., 2020; Vautard et al., 2021). RCM simulations have also been used to investigate changes in wind speed and wind energy potentials (e.g. Hueging et al., 2013; Tobin et al., 2015; Moemken et al., 2018; Michel and Sorteberg, 2023), and windstorms (e.g. Leckebusch et al., 2006; Schwierz et al., 2010; Donat et al., 2011; Bloomfield et al., 2023).
Regarding the projections for windstorm related impacts in Europe, several authors have analyzed global climate projections (e.g. Leckebusch et al., 2007; Pinto et al., 2007; Schwierz et al., 2010; Donat et al., 2011; Karremann et al., 2014a; Little et al., 2023) but few have used RCM data (e.g. Donat et al., 2011; Bloomfield et al., 2023; Michel and Sorteberg, 2023). For example, Pinto et al. (2012) identified an increase in both frequency and intensity of potential losses caused by windstorms for Core Europe (Benelux, Denmark, France, Germany, Ireland, UK) based on global ECHAM5 ensemble simulations following the Special Report on Emissions Scenarios (SRES) scenarios B1, A1B and A2. More recently, Little et al. (2023) provided evidence that windstorm losses in Northern and Central Europe may strongly increase for CMIP6 GCMs under the high emission scenario SSP5–8.5 by 2100. Still, large disparities between single GCMs and scenarios are identified, thus calling for a detailed analysis of a multi-GCM, multi-RCM ensemble at the European scale. Following the concept introduced in IPCC (2021), this study will focus not on specific scenarios but on global warming levels (GWLs) to provide a wider and more impact related view of the changes. The aims of this study are as follows:
Examine wind gusts in a multi-model EURO-CORDEX ensemble, compare them to reanalysis data and quantify the added value of bias correction.
Quantify the changes of European windstorm losses for Core Europe and single countries for the multi-model EURO-CORDEX ensemble in terms of windstorm frequency and intensity for different GWLs (+2°C and +3°C).
In total, an ensemble of 20 EURO-CORDEX model pairs (a matrix of 5 GCMs times 4 RCMs) are considered, thus enabling a more precise assessment of the windstorm impacts at the regional scale and a better quantification of the uncertainties. Section 2 provides an overview of the data and methods. Section 3 focuses on the comparison between the EURO-CORDEX wind gust data and reanalysis data and the bias correction. The possible changes in frequency and intensity of windstorm losses in a warmer climate and associated uncertainties are described in Section 4. Finally, Section 5 provides a summary of the results and a detailed discussion.
2 Data and Methods
2.1 Data
2.1.1 Euro-Cordex
We studied the potential impact of European windstorms under recent and future climate conditions at the regional scale in a large multi-model ensemble, provided within the framework of EURO-CORDEX (Giorgi et al., 2009; Jacob et al., 2014). The ensemble consists of 20 GCM-RCM chains, specifically of four RCMs each driven by the same five GCMs (Table 1). Such a large ensemble is beneficial to investigate not only the uncertainty and robustness of climate change signals, but also the influence of various GCMs and RCMs. We used daily maximum wind gust at 10 m height with a spatial resolution of 0.11° (12 km).
Table 1
Overview of the EURO-CORDEX GCM-RCM chains (including references) used in this study. Every RCM is driven by every GCM. The given 30-year periods correspond to the period where the GCMs reach a global warming level (GWL) of +2°C (GWL2) and +3°C (GWL3) compared to the pre-industrial period. The model codes (A–E for GCMs, 1–4 for RCMs) refer to the ones used in Supplementary Figures S9 and S10.
| GWL2 | GWL3 | GCM | RCM |
|---|---|---|---|
| 2029–2058 | 2052–2081 | A. CNRM-CERFACS-CNRM-CM5 (Voldoire et al., 2013) | 1. CLMcom-ETH-COSMO-crCLIM-v1-1 (Sørland etal., 2021) |
| 2026–2055 | 2051–2080 | B. ICHEC-EC-EARTH (Prodhomme et al., 2016) | 2. KNMI-RACMO22E (Meijgaard et al., 2012) |
| 2029–2058 | 2052–2081 | C. MPI-M-MPI-ESM-LR (Giorgetta et al. 2013) | 3. SMHI-RCA4 (Samuelsson et al., 2011) |
| 2016–2045 | 2037–2066 | D. MOHC-HadGEM2-ES (Martin et al., 2011) | 4. MOHC-HadREM3-GA7-05 (Tucker et al., 2022) |
| 2031–2060 | 2057–2086 | E. NCC-NorESM1-M (Bentsen et al. 2013) |
The data was analyzed for the historical reference period 1976–2005 and for different GWLs. GWLs reflect changes in the global surface temperature with respect to pre-industrial climate conditions and are now widely used to communicate climate change impacts to stakeholders and policymakers (IPCC, 2021). Here, the study focused on the +2°C and +3°C with respect to the period 1881–1910, named GWL2 and GWL3, respectively. While the GWL2 corresponds to realistic near-future climate change scenarios (Kjellström et al., 2018) and the Paris Agreement’s goal to limit global warming to below +2°C (Schleussner et al., 2016), the GWL3 is relevant for investigating more extreme scenarios and long-term changes (Raftery et al., 2017). The 30-year long GWL periods are identified separately for each GCM (Table 1), following the time sampling approach (Teichmann et al., 2018; Moemken et al., 2022). The climate projections follow one of the Representative Concentration Pathway (RCP), namely the RCP8.5 scenario, which represents a high-emission, non-mitigation, worst-case scenario (Meinshausen et al., 2011; Riahi et al., 2011). RCP8.5 leads to anthropogenic radiative forcing of 8.5 W/m2 and thus to a global temperature increase of 3–4°C by 2100. This scenario was chosen due to its consistency with currently observed emissions (Schwalm et al., 2020), the large amount of data available, and to ensure that the GWL3 is reached in all ensemble members.
The model consistency was used to evaluate the uncertainty and robustness of the climate change signals, following Jacob et al. (2014). Signals are therefore defined as robust (non-robust) if more (less) than 66% of the ensemble members agree on the direction of change. This corresponds to 14 out of 20 ensemble members in the study.
2.1.2 ERA5 reanalysis data
To validate the performance of the historical simulations, they were compared against the ERA5 reanalysis dataset (Hersbach et al., 2020). ERA5 is the newest reanalysis product of the European Centre for Medium-Range Weather Forecast (ECMWF). Daily maximum wind gust at 10 m height with a spatial resolution of 30 km (0.25°) for the period 1976–2005 was used. The definition of wind gusts follows the standard of the World Meteorological Organization (WMO), using the maximum 3-second wind speed at 10 m. The ERA5 data is re-gridded to the EURO-CORDEX grid using conservative remapping (Jones, 1999) prior to the comparison.
2.2 Methods
2.2.1 Bias correction of wind gust
The evaluation of the historical EURO-CORDEX simulations uncovered substantial biases for wind gusts compared to ERA5 (see Section 3). Since these biases, especially the ones at the tail of the wind gust distribution, may influence the climate change signal for windstorm impacts, we apply a bias correction to the daily maximum wind gusts from the historical and RCP8.5 simulations. We aim to improve the accuracy and remove errors, while additionally ensuring the coherence of the multi-model ensemble (Cannon et al., 2020).
Four different bias correction methods were tested, namely Normal Distribution Mapping, Empirical Quantile Mapping, Empirical Robust Quantile Mapping, and Quantile Mapping with Linear Transformation Function. A detailed description of the different methods can be found in Qian and Chang (2021). For this study, the Empirical Quantile Mapping proved to be the most effective, as it successfully corrects the bias in the EURO-CORDEX ensemble, even for extreme wind gusts (values exceeding the 98th percentile). The bias correction is carried out with Empirical Quantile Mapping by adjusting the quantiles of the distribution of daily maximum wind gusts of the historical EURO-CORDEX simulations (1976–2005) to those derived from ERA5 reanalysis data. With this aim, cumulative distribution functions (CDFs) were employed as described in equation 1 (Boe et al., 2007; Gudmundsson et al., 2012; Gudmundsson, 2016; Li et al., 2019). This is performed at every grid point and for each of the 20 ensemble members separately.
where, is the bias-corrected model. is the inverse CDF of ERA5 data. is the CDF of the original model data. is the original model data.
For each grid point, the CDF of ERA5 reanalysis data and model data from the historical period (1976–2005) is first computed at regularly spaced quantile levels, τ = 0, 0.01, 0.02, …, 0.99, 1.00. Subsequently, linear interpolation is used to obtain quantile values for levels that are not explicitly listed. The derived correction functions for the recent climate are then also applied for the future projections.
For this study, a reanalysis dataset for the bias correction was used due to the limited number of available gridded observational wind gust data (c.f. Moemken et al., 2018; Michel and Sorteberg, 2023). ERA5 was selected because of its good representation of near surface winds compared to other available reanalysis datasets (Ramon et al., 2019) and its high spatial resolution and recent data.
2.2.2 Loss Index (LI)
A simple meteorological storm severity index was employed, named Loss Index (LI), to assess windstorm losses under current and future climate conditions. The formulation by Pinto et al. (2012) and Karremann et al. (2014a) was used, described in equation 2:
where v is the maximum wind gust over a three-day period for each grid point ij, v98 is the local 98th percentile of daily maximum wind gust in the historical period, P is the population density per grid point, I (v, v98) is set to 0 if vij < v98 and 1 if vij > v98, and L is set to 0 over sea and 1 over land.
The cubic term reflects the non-linear relationship between wind gusts and damage, indicating that losses increase with the cube of wind gust as a result of the advection of eddy kinetic energy (Palutikof and Skellern, 1991; Lamb, 1991). The three-day period reflects the average duration of storms crossing Europe while producing damaging winds (Hewson and Neu, 2015) and corresponds with (re)insurance clauses for natural hazards (Klawa and Ulbrich, 2003; Karremann et al, 2014a). To identify individual events, overlapping three-day windows (shifted by one day) were used; the temporal local maximum of each window (Karremann et al., 2014a) was analyzed. The peak gust is scaled with the 98th percentile, following the assumption that only the top 2% of wind gusts cause damage as the infrastructure is adapted to the local wind climate (Palutikof and Skellern, 1991; Klawa and Ulbrich, 2003). While this threshold is considered reasonable for Core Europe, it might be too low for Eastern Europe, Northern Europe and the Iberian Peninsula (Karremann et al., 2014b). For that reason, a minimum threshold of 20 ms–1 where the 98th percentile of daily maximum wind gust is below 20 ms–1 was used, following the approach by Karremann et al. (2014b). Finally, population density is used as a proxy for the exposure component of LI since insurance data is not available (Klawa and Ulbrich, 2003). For this study, gridded population density data for the year 2020 (Figure 1) was used for both historical and future periods, thereby neglecting possible changes in European population density. The data was provided by the Centre for International Earth Science Information Network (CIESIN, 2018) at 5 km spatial resolution, which is re-gridded to the EURO-CORDEX resolution using a conservative remapping (Jones, 1999).
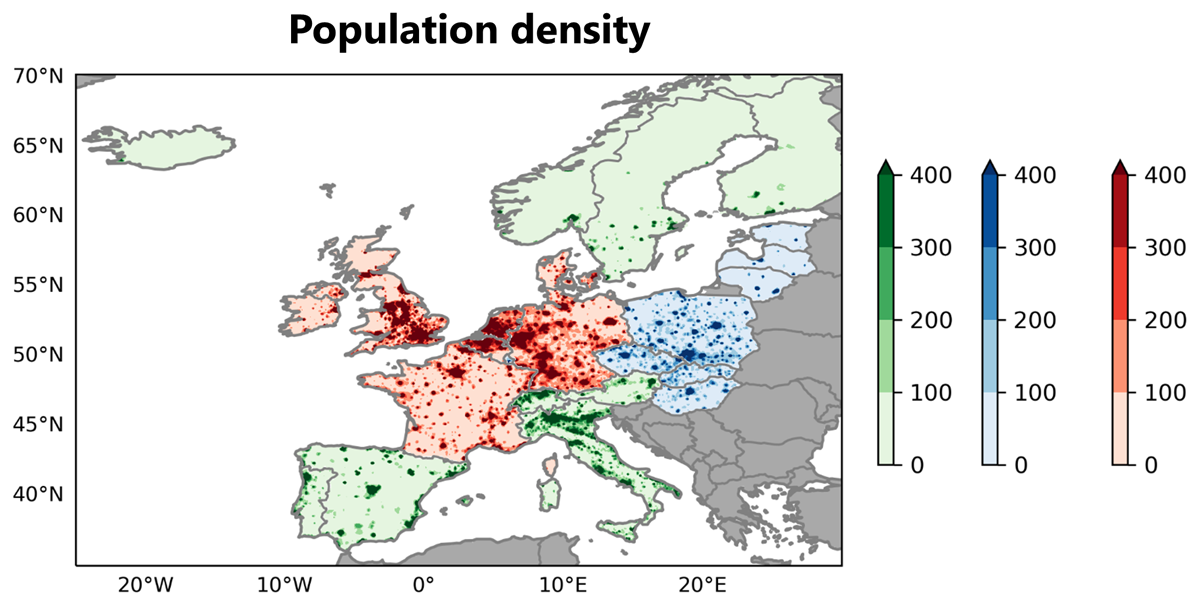
Figure 1
Population density in Europe (P km–2) for the year 2020 with Core Europe in red, Eastern Europe in blue, all other analyzed countries in green, and non-considered countries in grey.
LI is aggregated for 24 European countries (Figure 1) as well as for two larger regions: Core Europe (Belgium, Denmark, France, Germany, Ireland, Luxembourg, the Netherlands, UK), where the windstorm risk is of particular interest for the insurance industry, and Eastern Europe (Czechia, Estonia, Hungary, Latvia, Lithuania, Poland, Slovakia). Only the extended winter season from October to March (ONDJFM) was considered as this is the peak season for severe windstorms in the North Atlantic/European region (e.g. Donat et al., 2011; Reale et al. 2019). Moreover, the focus was solely on losses associated with the most extreme windstorms. To this end, events were analyzed with LI values that exceeded a certain threshold. Following Pinto et al. (2012), a threshold was chosen to select an average of five events per season. For the historical period (1976–2005), the top 2900 events were thus identified, equivalent to 5 storms for 20 models across 29 winters. The lowest LI value of the historical event set was used as the minimum threshold to identify storm events in the GWL periods. This enabled an investigation into the changes in both LI and the number of storms under different GWLs relative to the historical period. Please note that this approach resulted in a different number of selected events for the individual ensemble members, both for the historical and the GWL periods (Supplementary Figure S1 and Section 4.3).
2.2.3 Extreme value statistics
A return value analysis was employed to obtain information on the recurrence interval of rare extreme loss events, focusing on Core and Eastern Europe. In this study, the return period refers to the average duration between losses of a certain magnitude, while the return level represents the magnitude of the loss that is expected to be exceeded within a given return period. The large EURO-CORDEX ensemble enabled an examination of return levels for longer return periods, with up to 580 winters available for analysis (20 models × 29 winters) for both historical and GWL periods. The return value analysis is conducted using both empirical methods and a Generalized Pareto Distribution (GPD) fitting (Coles, 2001; Della-Marta et al., 2009; Pinto et al., 2012). The maximum-likelihood-method is used to fit the GPD (Della-Marta and Pinto, 2009) using the Python package “thresholdmodeling” by Lemos et al. (2020). The GPD fit is done for the most extreme LI events, i.e. events with LI values above a certain threshold following the “peak over threshold” method. The threshold is selected where the estimated shape and scale parameters are stable (see Appendix 1 in Pinto et al. (2012) for a detailed description). Finally, the uncertainty of the GPD fit is estimated using the delta method (Coles, 2001; Della-Marta et al., 2009) with an alpha of 0.05, corresponding to a 95% confidence interval.
3 Evaluation of Historical Simulations
The quality of the historical simulations in representing the current wind gust climate over Europe was evaluated by comparing them with ERA5 reanalysis. To accomplish this, wind gusts in the historical period of the EURO-CORDEX ensemble (29 winters, 1976–2005) were used with the corresponding winters from ERA5 reanalysis data. The findings presented here are expressed in terms of the ensemble mean bias of the mean and the 98th percentile of daily maximum wind gust.
Focusing on the mean of daily maximum wind gust, results show in general stronger wind gust in the EURO-CORDEX ensemble mean compared to ERA5, except for mountainous regions such as Scandinavia, the Alps or the Pyrenees, where the bias is generally negative (Figure 2a, c). Some regions in Europe present a positive bias higher than 20% (e.g. Iceland, coastal regions of the Mediterranean). When looking at particular RCM-GCM combinations, HadREM3-GA7-05 and RACMO22E have stronger mean wind gusts compared to ERA5 in most of Western and Central Europe (Supplementary Figure S2). For the 98th percentile, a positive bias is generally seen for the Iberian Peninsula, Southern France and Eastern Europe (Figure 3a, c). However, the 98th percentile of wind gust shows a negative bias when compared with ERA5 over Central Europe, including the Alps (Figure 3c). In terms of wind gusts over the ocean, it is evident that the EURO-CORDEX ensemble exhibits a strong positive bias when compared with ERA5 (Figures 2c, 3c). When looking at individual ensemble members (Supplementary Figure S3), a strong positive bias is found in wind patterns for RCA4 for all GCMs. All other RCM-GCM combinations agree on the less windy patterns over Central Europe. The bias from the RCA4 model is dominant across all GCMs, while in other models, it is unclear if the bias comes primarily from the GCM or the RCM.
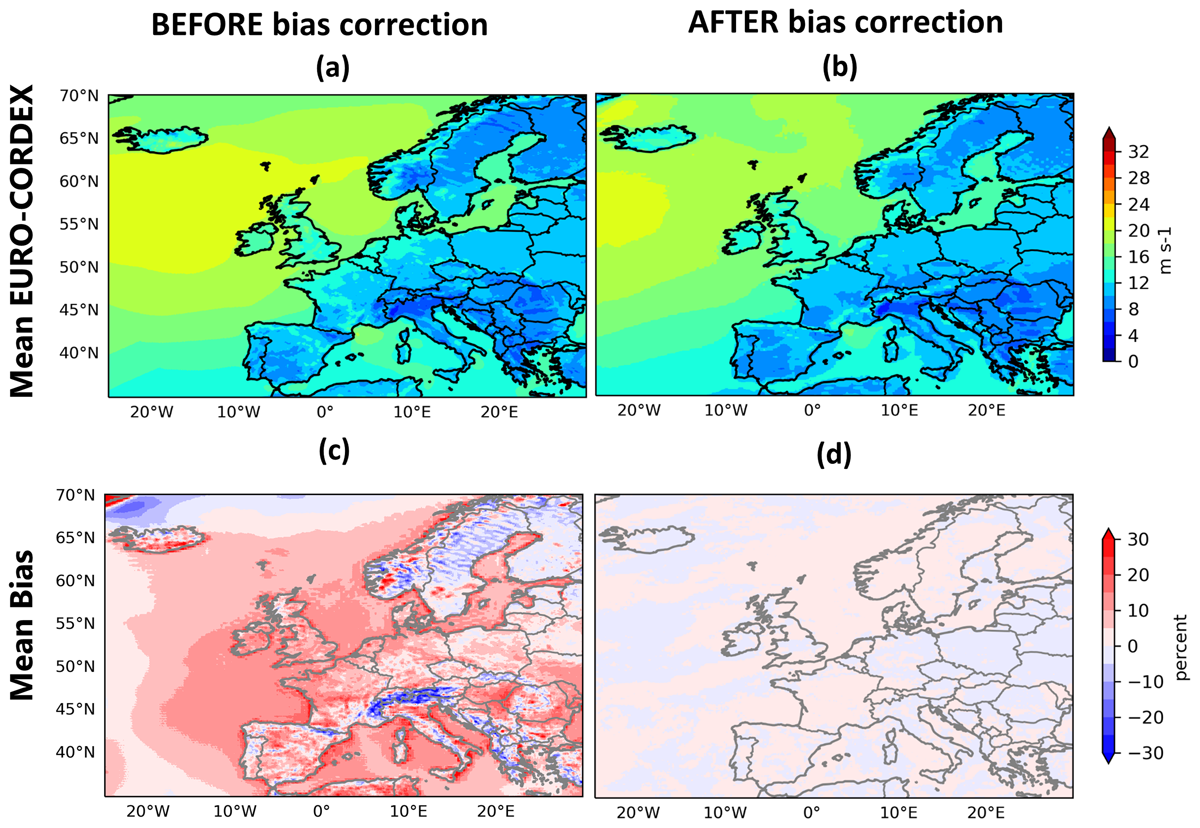
Figure 2
(a-b) Mean of daily maximum wind gust (m s–1) for the ensemble mean of the EURO-CORDEX historical simulations (1976–2005) before bias correction (a), and after bias correction using Empirical Quantile Mapping (b). (c-d) Difference between the EURO-CORDEX ensemble mean and ERA5 (%).
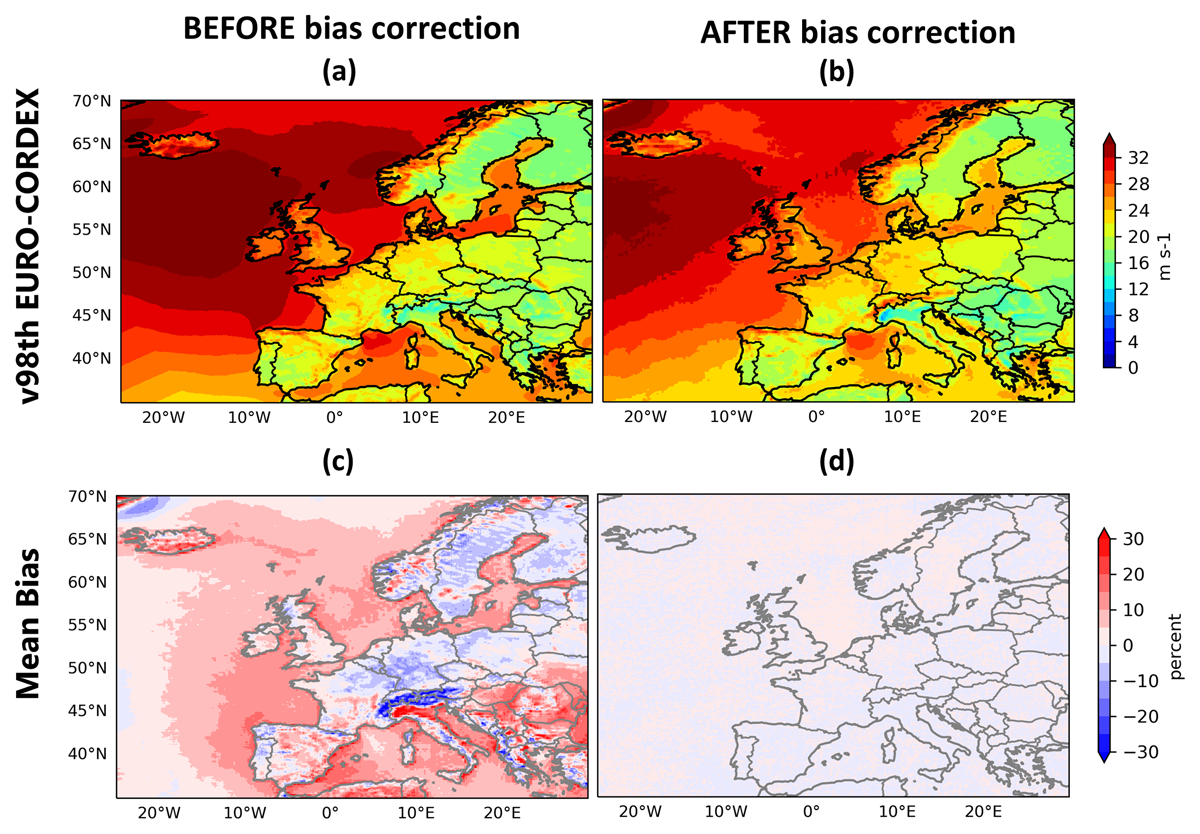
Figure 3
Same as Figure 2, but for the 98th percentile of daily maximum wind gust.
Considering these results, the historical simulations of the EURO-CORDEX ensemble exhibit substantial biases of wind gusts when compared to ERA5 reanalysis, in particular for the RCA4 RCM. Since the bias is considerably high in some regions of Europe, a bias correction was conducted using Empirical Quantile Mapping (see Section 2.2.1) of both current and future windstorm climates in EURO-CORDEX before analyzing changes in windstorm loss.
After using Empirical Quantile Mapping, the bias between the historical EURO-CORDEX simulations and ERA5 were computed again. The corrected models were found to have much reduced biases in the mean of daily maximum wind gust (Figure 2b, d) ranging between –5% and +5%. Regarding the most extreme wind gusts (98th percentile), the bias correction performed well (lower/higher than ±5%), even in areas that are characterized by elevated topography, such as the Alps or the Pyrenees (Figure 3b, d). In this study of maximum wind gust, bias correction is very useful in reducing the bias not only for the mean but also for the extremes. Finally, the bias correction substantially reduces the bias over all 20 ensemble members when compared with ERA5 (Figures S4, S5), even for RCA4 where the highest bias was occurring.
4 Changes Under Future Climate Conditions
The potential changes in European windstorm loss under future climate conditions are evaluated. For this study, the bias correction method applied does not alter the climate change signal (see Figure S6). The method primarily adjusts the intensity of climate change signals without substantially altering their spatial patterns in most areas, thereby ensuring alignment with observed data and enhancing the reliability of future projections. The analysis focuses on changes in windstorm intensity, windstorm frequency, windstorm related losses, and rare extreme events. The latter two are of particular interest for the insurance industry for determining premium values for windstorm risk in the context of climate change.
4.1 Changes in windstorm intensity
In the first step, changes in windstorm intensity were investigated. This was done in terms of changes in wind gust speed above the (historical) 98th percentile. Figure 4 shows the ensemble mean of the historical windstorm intensity and the projected changes for GWL2 and GWL3, respectively. Areas with robust signals (Section 2.1.1) are marked with diagonal lines. The climate change signals of the individual ensemble members are shown in Supplementary Figures S7 and S8, respectively.
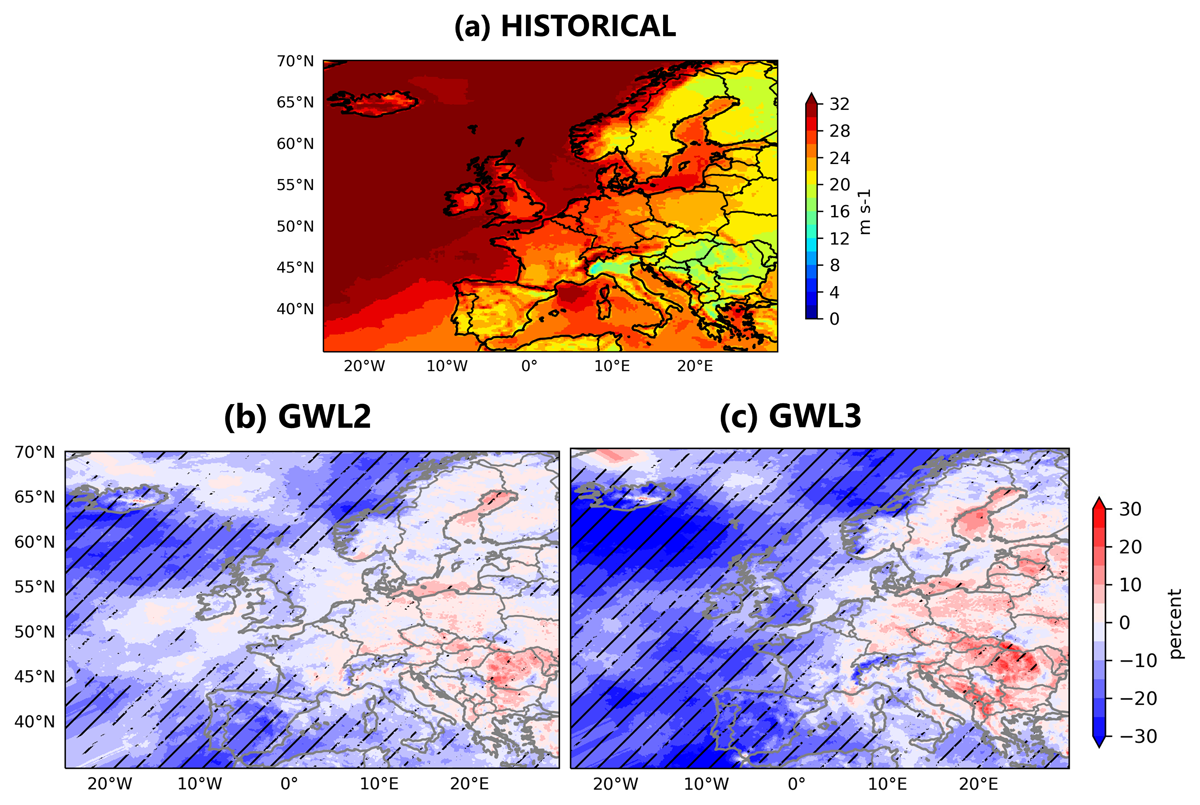
Figure 4
(a) Windstorm intensity (m s–1), shown as wind gust speed above the 98th percentile, derived from the EURO-CORDEX ensemble mean for the historical period (1976–2005). Changes in windstorm intensity (%) compared to the historical period for the ensemble mean of (b) GWL2, and (c) GWL3. Black diagonal lines indicate robust climate change signals, meaning that 14 or more ensemble members agree on the sign of change.
For the GWL2, the ensemble mean projects a decrease in windstorm intensity for the Mediterranean, the UK and mountainous regions on the continent (Figure 4b). Strongest and mostly robust trends are found for the Iberian Peninsula, with changes of up to –20%. For Eastern Europe, the Baltic Sea and parts of Core Europe, the ensemble mean projects a slight, though non-robust increase for the GWL2, with trends mostly below 5%. The signals do not appear to be dominated by an individual GCM or RCM, as can be seen from the individual ensemble members in Figure S7.
Climate change signals increase in magnitude and robustness for GWL3 (Figure 4c). The decreasing trends in windstorm intensity over the Iberian Peninsula now reach up to –30% in the ensemble mean and spread further towards France. The positive, but still non-robust signals over Eastern Europe also intensify and can reach up to 20% locally. Again, the individual ensemble members exhibit very different spatial patterns that do not indicate a clear dominance of a single GCM or RCM (Figure S8).
4.2 Changes in windstorm frequency
Next, changes in windstorm frequency were analyzed, which refers to changes in the number of storms in the 29 winters of the GWL periods compared with the 29 winters of the historical period. For the GWL2 (Figure 5a), the EURO-CORDEX ensemble mean projects a slight decrease in storm frequency (less than 10%) for Core Europe, with robust signals in Ireland and the Netherlands. In Eastern Europe, the projected changes are non-robust and mostly negative. Only Austria, Hungary and Slovakia show slight positive trends (smaller than 3%) in the ensemble mean. Largest changes in windstorm frequency are projected for the Iberian Peninsula and Iceland, with negative trends of up to 16%.
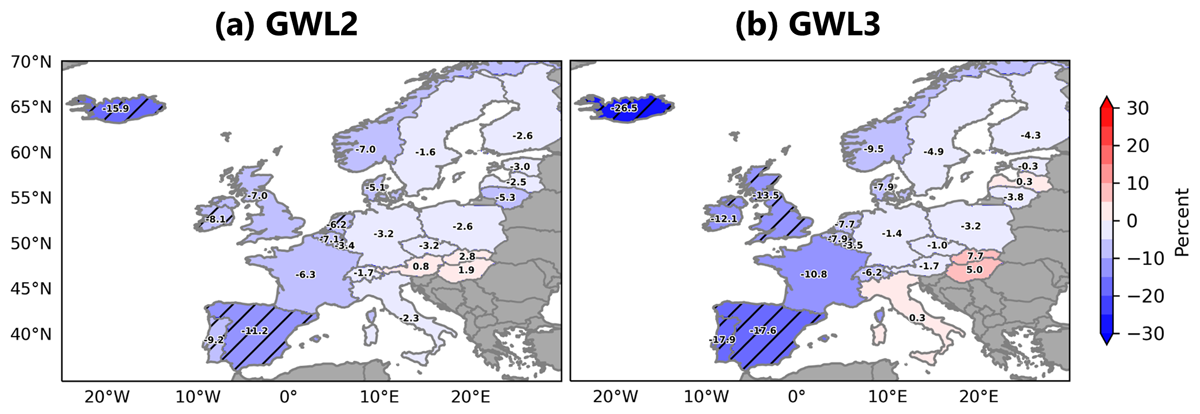
Figure 5
Changes in windstorm frequency (%) compared to the historical period for the ensemble mean for (a) GWL2, and (b) GWL3. Black diagonal lines indicate robust climate change signals, meaning that 14 or more ensemble members agree on the sign of change.
As for the windstorm intensity, changes are more pronounced for a GWL3 (Figure 5b). The ensemble mean projects negative trends for most parts of Europe. The only exceptions are Italy, Hungary, Slovakia and Latvia, where the windstorm intensity can increase by up to 8% (non-robust). Largest (and robust) changes are again found for the Iberian Peninsula and Iceland, where the decrease in storm intensity can reach up to 26.5%.
For the individual ensemble members, all simulations driven by EC-EARTH show a strong decrease in storm frequency (up to 31% for single members, and more than 15% in the GCM mean) for Core Europe and Eastern Europe in both GWLs (Figure 6). The same can be seen for most of the individual countries (Supplementary Figure S9, model code B). The climate change signals for all other RCM-GCM combinations are generally less pronounced and often do not exhibit a clear pattern. For example, the trends within one RCM (like RCA4) may vary for different GCMs (and vice versa). Moreover, for some ensemble members, trends may change in sign from one GWL to another as for the COSMO-CLM simulation driven by NorESM1-M. This applies both to the larger regions of Core and Eastern Europe (Figure 6) and to individual countries (Figure S9).
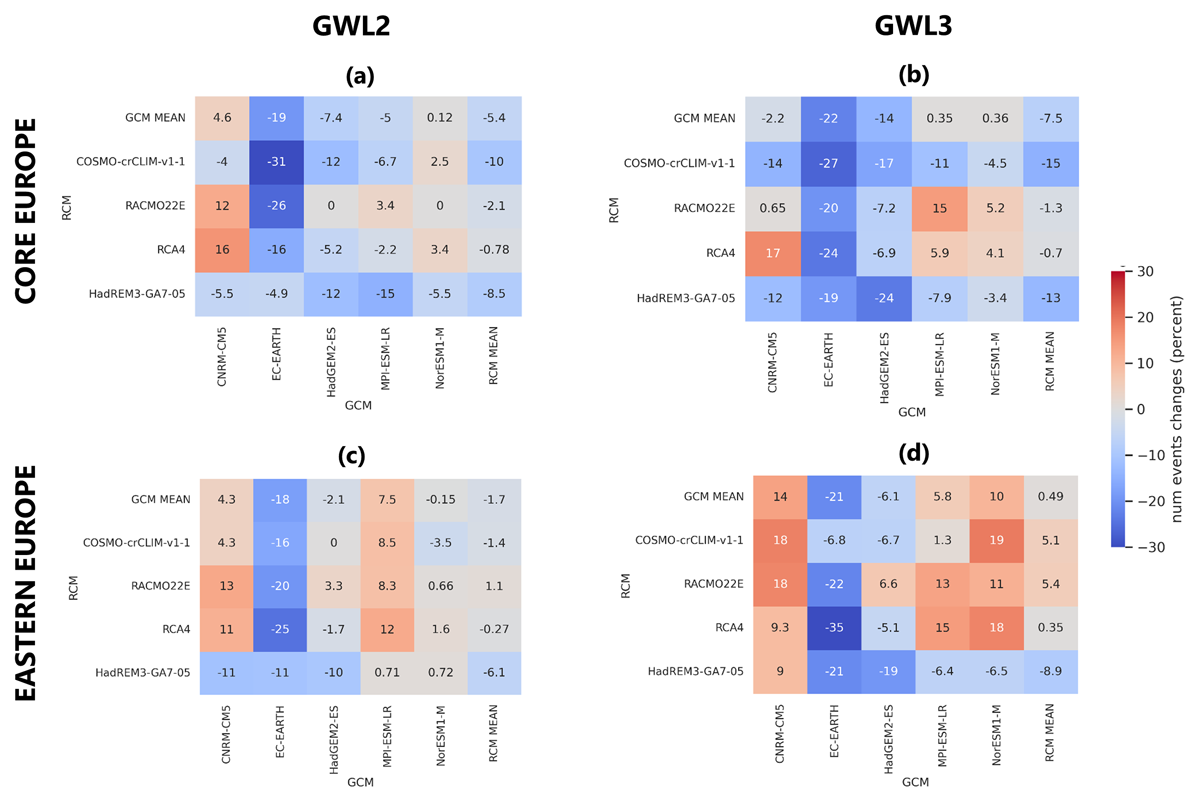
Figure 6
Changes in windstorm frequency (%) compared to the historical period for the individual ensemble members derived for Core Europe (upper row) and Eastern Europe (lower row) for (a) GWL2, and (b) GWL3. For each matrix, rows represent RCMs and columns GCMs. The RCM (GCM) mean is depicted in the last column (first row).
4.3 Changes in windstorm losses
Changes in windstorm losses were analyzed by examining the top 2900 storm events from the historical period and using their minimum LI values as threshold to study changes in LI under future climate conditions (Section 2.2.2). While a fixed number of events per ensemble member was not used but rather a focus on the most extreme events in the whole ensemble, the applied bias correction assures that, overall, all 20 ensemble members contribute equally to the historical event set (Figure S1). For the GWLs, the total number of events and the contribution of the individual RCM-GCM combinations is changing, with the CNRM-CM5-simulations (EC-EARTH-simulations) contributing more (less) to the event set of most extreme storms (Figure S1). The following will focus on the total LI, summed over all storms in the event set (historical and GWLs, respectively).
Under a global warming of +2°, the ensemble mean projects a small (less than 10%) and non-robust decrease of LI for Core Europe (Figure 7b). The only exception is Germany, with a slight increase in LI (not significant). In Eastern Europe, trends are mostly positive (though non-robust) with values up to 8%. Largest (and robust) climate change signals can be found for Iceland and the Iberian Peninsula, where the negative trend in storm loss exceeds 20%. For the +3° GWL, changes are more pronounced in many European countries (Figure 7c). Exceptions are Germany, Austria and some of the Baltic states, where the trends in LI are projected to change sign. For Core Europe, all countries show a decrease in LI in the ensemble mean, with largest (more than 15%) and robust trends for the UK. On the other hand, all countries in Eastern Europe show an increase in LI in the ensemble mean (non-robust). Overall, projected changes in LI are comparatively small under both GWLs, with values seldomly exceeding 15%. The only exceptions are the Iberian Peninsula and Iceland, where a decrease of almost 30% is projected under the GWL3.
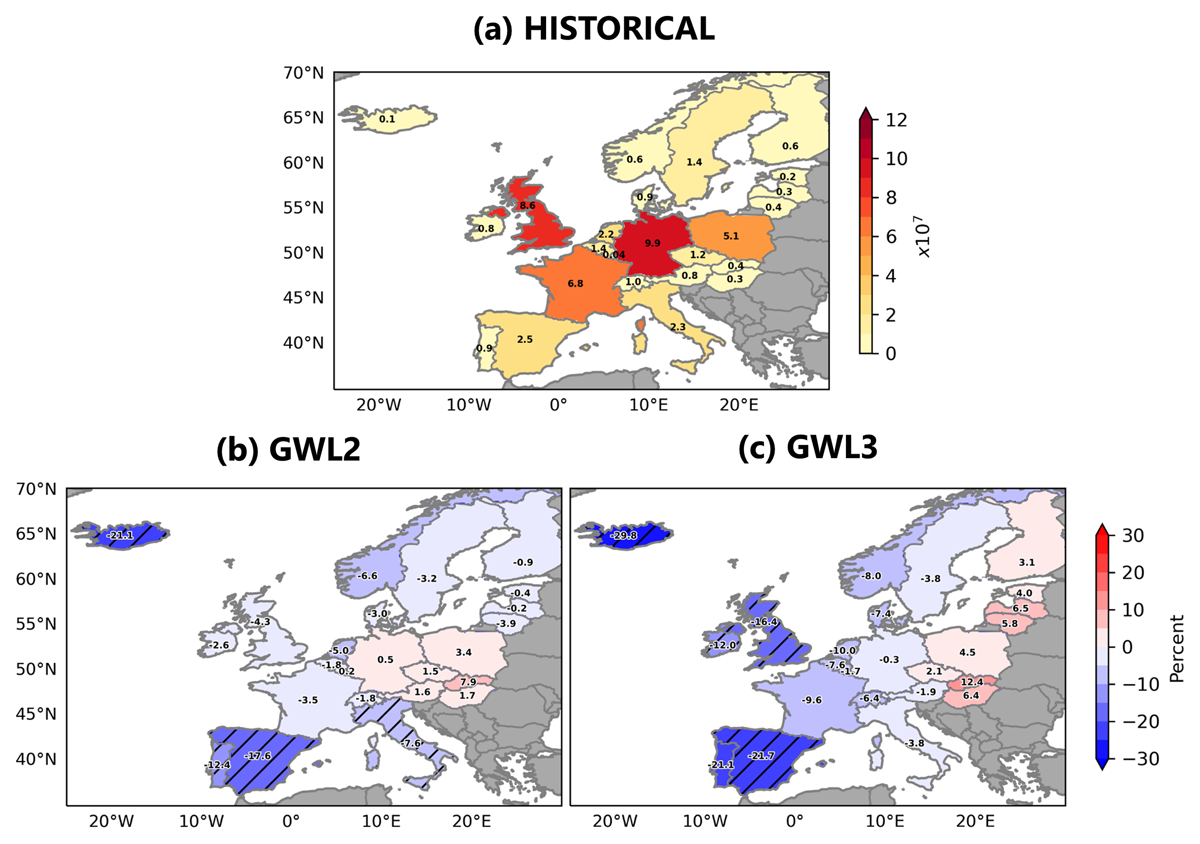
Figure 7
(a) Windstorm loss, shown as total LI, derived from the EURO-CORDEX ensemble mean for the historical period (1976–2005). Changes in windstorm loss (%) compared to the historical period for the ensemble mean for (b) GWL2, and (c) GWL3. Black diagonal lines indicate robust climate change signals, meaning that 14 or more ensemble members agree on the sign of change.
The analysis of the various ensemble members (Figure 8) reveals a strong decrease in LI for all EC-EARTH-simulations for Core Europe, Eastern Europe and most individual countries (Figure S10). This decrease can be found under both GWLs with values reaching up to 36% and agrees well to the projected changes in windstorm frequency (Section 4.2). On the other hand, most simulations driven by CNRM-CM5 show a strong increase in LI, with values reaching up to 45% for Eastern Europe (Figure 8e, f). The other RCM-GCM combinations mostly agree on increasing LI for Eastern Europe under both GWLs, with overall lower values (1–25%) and no clear dominance of a single GCM or RCM.
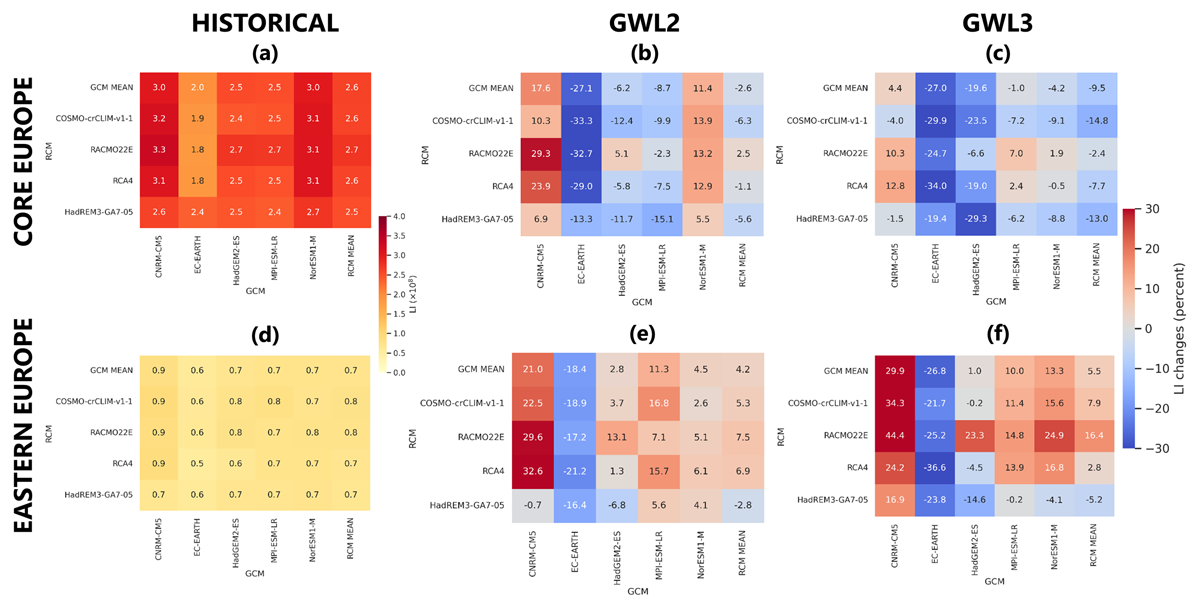
Figure 8
Windstorm loss derived for Core Europe (a) and Eastern Europe (d) for the individual ensemble members for the historical period (1976–2005). Changes in windstorm loss (%) compared to the historical period for the individual ensemble members for (b,e) GWL2, and (c,f) GWL3. For each matrix, rows represent RCMs and columns GCMs. The RCM (GCM) mean is depicted in the last column (first row).
4.4 Changes in rare extreme loss events
In the final step, changes in rare extreme loss events at different return levels and return periods were analyzed. This is particularly crucial for insurance companies, as they have to determine appropriate premiums for those rare extreme events to have sufficient funds to cover claims. This part of the study focused on Core Europe and Eastern Europe instead of individual countries to ensure more reliable and stable GPD fits (Section 2.2.3), but single countries were also discussed. Based on the stability of the scale and shape parameters of the GPD fit (see Section 2.2.3), the top 81 events for Core Europe and the top 90 events for Eastern Europe were used.
For Core Europe (Figure 9a), the return period for rare extreme loss events is projected to shorten across all return levels for the GWL2 (blue curve). This indicates that rare extreme losses are expected to occur more frequently compared to the historical period (green curve). For example, a loss value corresponding to a 50-year return period under historical climate conditions is projected to occur about every 33 years for a global warming of 2°C. Under the GWL3 (red curve), on the contrary, results show a strong overlap with the distribution for the historical period (green curve), and even a small lengthening of the return period. A historical loss value corresponding to a 50-yr return period, for instance, is estimated to occur every 58 years for the GWL3. The changes in rare extreme loss events for Core Europe are primarily influenced by extreme events in individual countries. A detailed analysis of Core Europe countries (Figures 9c,e and S11) reveals that while, for example, Ireland and the UK do not show a significant change of return periods, these changes are clear for Germany and France, which also show shorter return periods for GWL3 than GWL2. Nevertheless, there is large uncertainty and thus no clear climate change signal for rare extreme events is found for Core Europe.
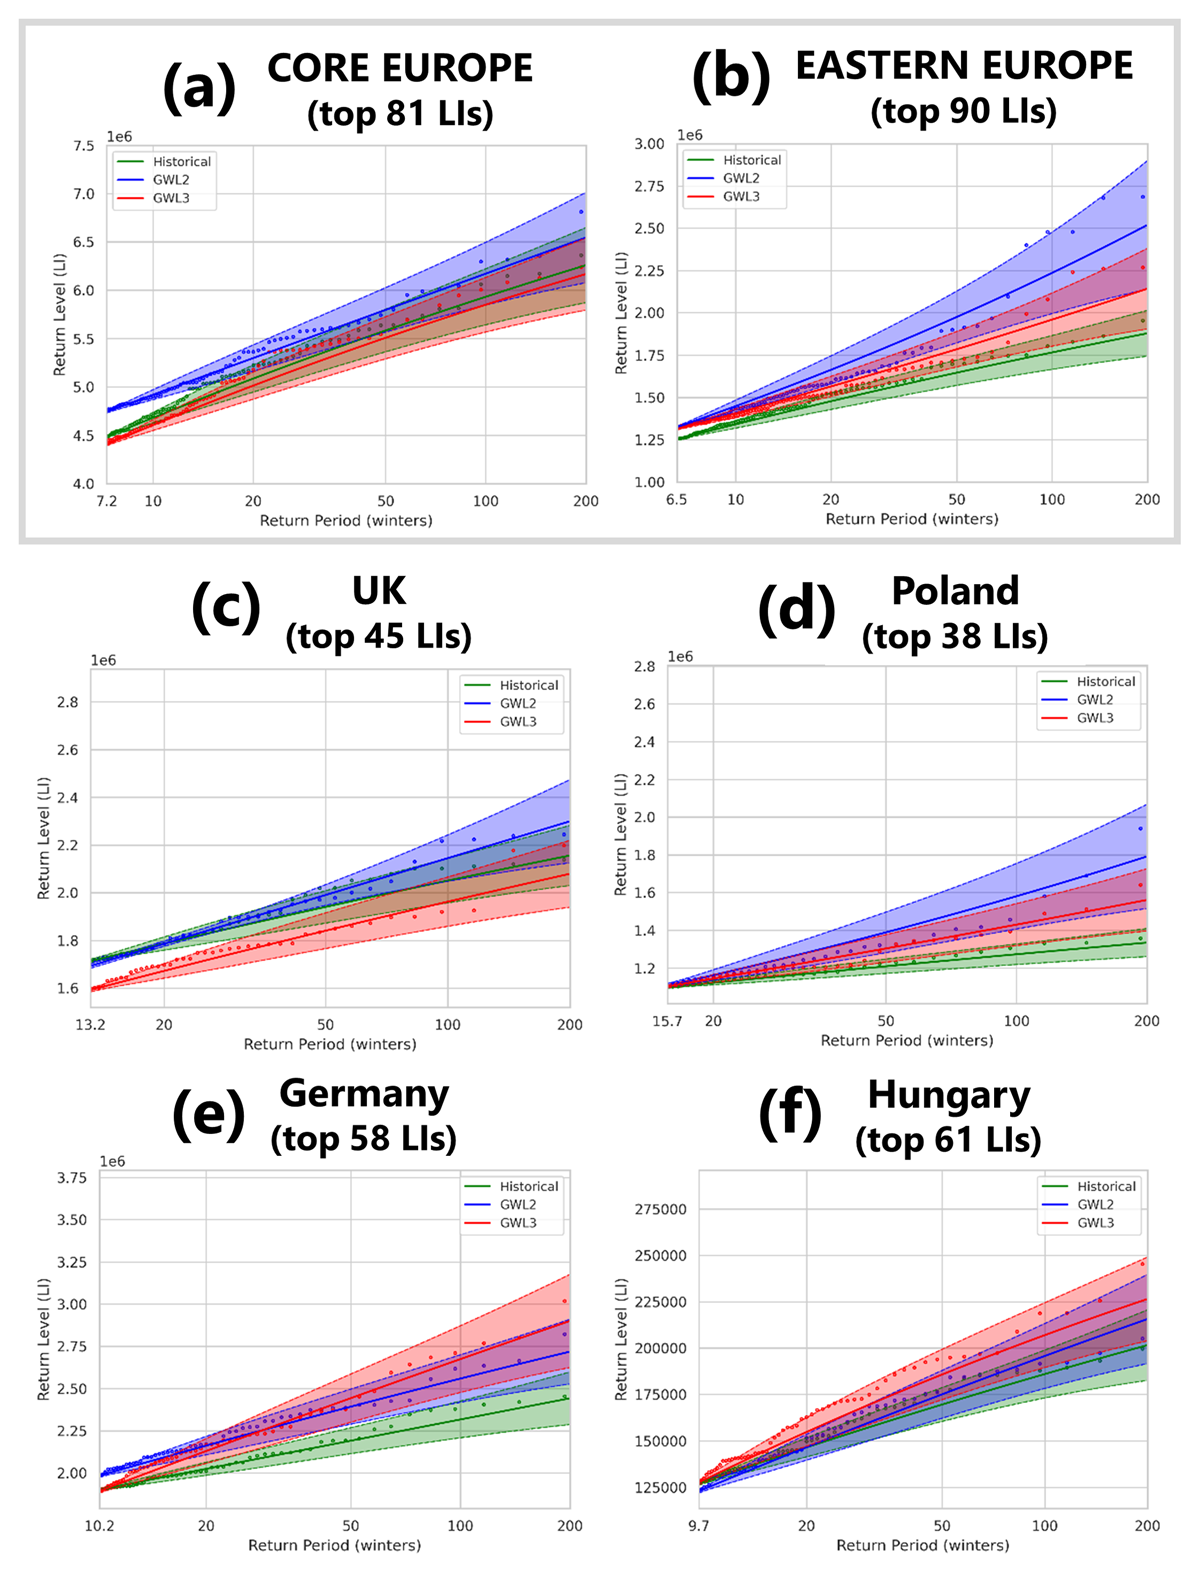
Figure 9
Return periods of the most extreme loss events derived for (a) Core Europe and (b) Eastern Europe for the historical period (green), the GWL2 (blue), and the GWL3 (red). The dots represent the empirical values, the solid lines show the GPD fit, and the dashed lines represent the upper and lower bounds of the 95% confidence interval. Same as (a) and (b), but for countries belonging to Core Europe (c,e) and Eastern Europe (d,f). The number of top LIs used in these figures are based on the stability of the scale and shape parameters of the GPD fit.
The results are more consistent for Eastern Europe (Figure 9b). For both GWLs, a shortening of return periods compared to current climate conditions is projected. Changes are more pronounced for the GWL2 than for the GWL3. For example, a 50-year event in the historical period will become a 19-year event under the GWL2 and a 28-year event under the GWL3, respectively. Considering the individual countries (Figures 9d,f and S12), the shortening of return periods is observed for most of the individual countries, some with more (e.g. Poland, Latvia), some with less clarity or hardly any signal (e.g. Hungary). But together with the analysis for the countries in Core Europe, it appears that the signal generally becomes clearer the further east we look. Overall, the differing patterns of rare extreme loss between Core Europe and Eastern Europe highlight regional variations. Furthermore, there is no evidence that a GWL3 results in more frequent or severe rare extreme loss events than a GWL2.
5 Summary and Conclusions
This study analyzed potential impacts of climate change on windstorm losses in Europe. With this aim, the simple meteorological storm severity index named loss index (LI; after Pinto et al., 2012) was applied to a large EURO-CORDEX multi-model ensemble. 10 m wind gust speed was bias-corrected using an Empirical Quantile Mapping approach. Climate change signals were estimated for two global warming levels (+2°C and +3°C) relative to pre-industrial climate conditions using RCP8.5 scenario simulations. The main results are:
The historical EURO-CORDEX simulations show substantial biases in 10 m wind gust compared to ERA5 reanalysis data. Largest biases occur over regions with complex topography and for simulations with the RCA4 model. These biases were considerably eased with the Empirical Quantile Mapping bias correction.
The ensemble mean projections reveal an increase in windstorm intensity for most parts of continental Core and Eastern Europe in future decades, while a decrease is found for the Iberian Peninsula. Changes are more pronounced under GWL3.
The windstorm frequency is projected to decrease under future climate conditions for large parts of Europe. Largest and robust changes are found for the Iberian Peninsula, Iceland (both GWLs), and the UK (GWL3).
Regarding windstorm loss, climate change signals are comparatively small and mostly non-robust overall, with negative trends for Core Europe and positive trends for Eastern Europe.
The return periods of the most extreme loss events are projected to shorten for Eastern Europe, independent of the GWL, while no clear and consistent trends are found for Core Europe as a whole.
The EURO-CORDEX projections reveal large uncertainties in the sign and the magnitude of change, resulting in mostly non-robust climate change signals. Trends vary across the individual GCM-RCM chains without a clear dominance of a single GCM or RCM.
The evaluation of the EURO-CORDEX models was performed by comparing the historical EURO-CORDEX daily maximum wind gusts with ERA5 reanalysis. Ideally, observational (gridded) wind gust should be used for the comparison with the historical period. To the best of our knowledge, no such gridded observational wind gust dataset is available, as E-OBS only accounts for daily mean wind speed. The ERA5 reanalysis was therefore used due to its generally good representation of near surface winds (e.g. Ramon et al., 2019; Molina et al., 2021). However, ERA5 shows the lowest wind speed over mountainous regions (Laurila et al., 2021) and underestimates wind gusts over mountains in Sweden compared to observations (Minola et al., 2020). This underestimation can be attributed to ERA5’s wind gust parametrization, which does not accurately account for the elevation-dependent in the turbulent contribution. Nevertheless, ERA5 performs better than ERA-Interim, showing a closer agreement with observations for both wind speed and wind gust (Minola et al., 2020). Since no gridded wind gust data is available that serves as a better reference than ERA5, ERA5 was used for bias correction. The data was corrected by means of Empirical Quantile Mapping, since the EURO-CORDEX presented a substantial bias in 10 m wind gust. This method corrects not only the mean and variance but the whole distribution (Themeßl et al., 2011). The bias corrected model presented reduced climatological mean bias in spatial patterns and intensities.
The consideration of the EURO-CORDEX models allowed a quantification of the changes of European windstorm losses and examine their uncertainty and robustness. Here, the RCP8.5 scenario was chosen due to its larger availability in EURO-CORDEX and because the GWL3 is not reached in some ensemble members for the RCP4.5. Given that the changes are scenario dependent (IPCC, 2021), including a second, more moderate scenario (e.g., RCP4.5) would provide a better assessment of the uncertainties of changes. Very recently, the improved framework for CMIP6-CORDEX simulations has been issued (Katragkou et al., 2024), and CMIP6 downscaling experiments are now under way, considering the recent Shared Socioeconomic Pathways (SSPs) and aerosol forcing. Future studies should include a comparison between SSPs and RCPs and investigate possible differences for European windstorms.
Changes in windstorm-related impacts in Europe have been studied not only from a global climate projection perspective (e.g. Pinto et al., 2007, Little et al., 2023) but also using regional climate simulations (e.g. Michel and Sorteberg, 2023; Bloomfield et al., 2023). Our results show an increase in windstorm intensity and a simultaneous decrease in frequency (thus fewer but more intense storms) for large parts of continental Europe. For the UK and the Iberian Peninsula, both windstorm intensity and frequency are projected to decrease. However, and in line with Spinoni et al. (2020) and Michel and Sorteberg (2023), the climate change signals are subtle, often not significant and have a large uncertainty.
The results of this study at the regional scale can also be discussed in the context of changes in the large-scale atmospheric conditions in future decades. The representation of the Northern Hemisphere storm tracks under future climate change has been evaluated in climate model simulations from Phases 3, 5, and 6 of the CMIP by Harvey et al. (2020). They found consistent wintertime changes in the spatial patterns of the multi-model ensembles in CMIP3, CMIP5, and CMIP6, a weakening on the northern flank of the North Atlantic storm track and an extension towards Europe. This agrees with our results at the regional scale, showing an increase in windstorm intensity over Eastern Europe. More recently, Priestley and Catto (2022) show that extra-tropical cyclone numbers are projected to decrease globally in winter when analyzing the CMIP6 models, in line with previous studies (e.g. Ulbrich et al., 2009). Moreover, Priestley and Catto (2022) describe an extension of the North Atlantic storm track into Europe in all scenarios, with an increase in extreme windstorms identified for the North Sea region (see also Pinto et al., 2009; 2012). These assessments are thus all consistent with the present study.
The current results also have implications for the mid- and long-time planning of the insurance companies. While Moemken et al. (2024a) provided evidence that LI tends to underestimate high-impact events compared with an insurance catastrophe model, they highlight the overall effectiveness of LI to estimate windstorm impacts. Combined with current results, this information might help insurance companies to implement a climate change component in their catastrophe models and potentially even to consider different future pathways. Given the regional differences and subtleties in the results, a region-specific approach, tailored to the particular conditions of each area, could be important to quantify windstorm impacts in the forthcoming decades.
Data Accessibility Statement
The EURO-CORDEX data were obtained from the Earth System Grid Federation (ESGF) using the German Climate Computing Center (DKRZ) node at https://esgf-data.dkrz.de/search/cordex-dkrz/. The ERA5 reanalysis data can be downloaded from the Copernicus Climate Change Service (C3S) Climate Data Store (https://cds.climate.copernicus.eu/). The bias-corrected wind gust data used in this study are available through the corresponding author, subject to a reasonable request.
Additional File
The additional file for this article can be found as follows:
Acknowledgements
The authors acknowledge the World Climate Research Programme’s Working Group on Regional Climate, and the Working Group on Coupled Modelling, former coordinating body of CORDEX and responsible panel for CMIP5. We also thank the climate modelling groups (listed in Table 1 of this paper) for producing and making available their model output. We also acknowledge the Earth System Grid Federation infrastructure an international effort led by the U.S. Department of Energy’s Program for Climate Model Diagnosis and Intercomparison, the European Network for Earth System Modelling and other partners in the Global Organisation for Earth System Science Portals (GO-ESSP). We thank the German Climate Computer Centre (DKRZ, Hamburg) for computer and storage resources. We thank Hendrik Feldmann (IMKTRO at KIT) for discussions about EURO-CORDEX data. Finally, we would like to thank the editor for assisting the review process and the anonymous reviewer for constructive suggestions, which have helped improve our manuscript.
Competing Interests
The authors have no competing interests to declare.
Author Contributions
JM and JGP conceived and designed the study. IA performed the data analyses and made the figures. All authors discussed the results, wrote parts of the initial paper draft and contributed with manuscript revisions.