
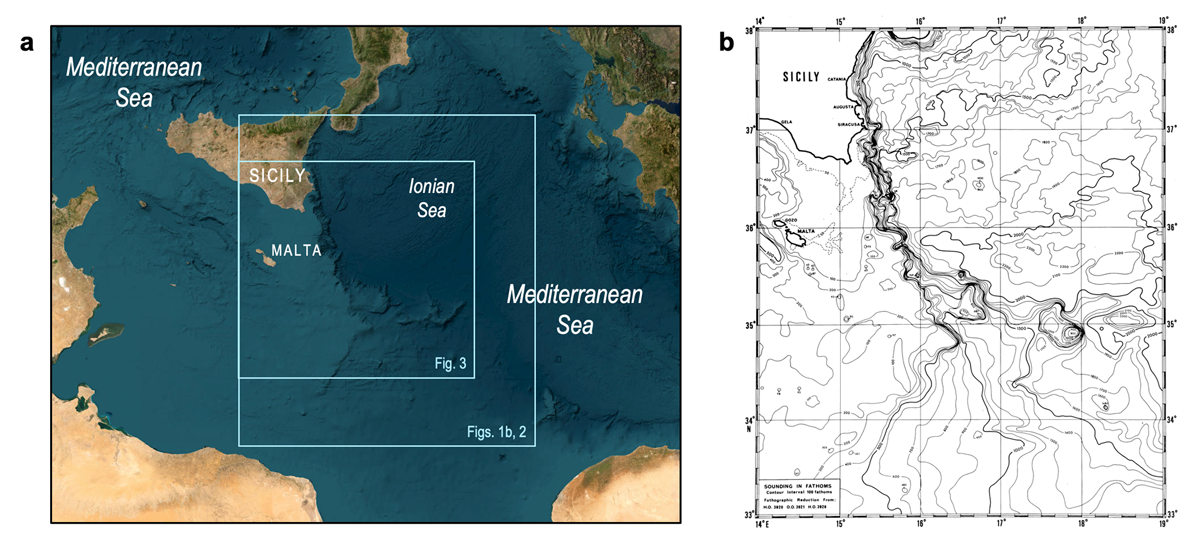
Figure 1
a, Map of the study area, with frames indicating the boundaries of the maps in Figures 1b, 2 and 3. Source: National Centers for Environmental Information (NCEI), Bathymetric Data View, World View, ESRI base map. b, Bathymetry of the region east of Malta with contour interval in 100 fathoms. Source H.O. 3920, O.O. 3921, H.O. 3926.
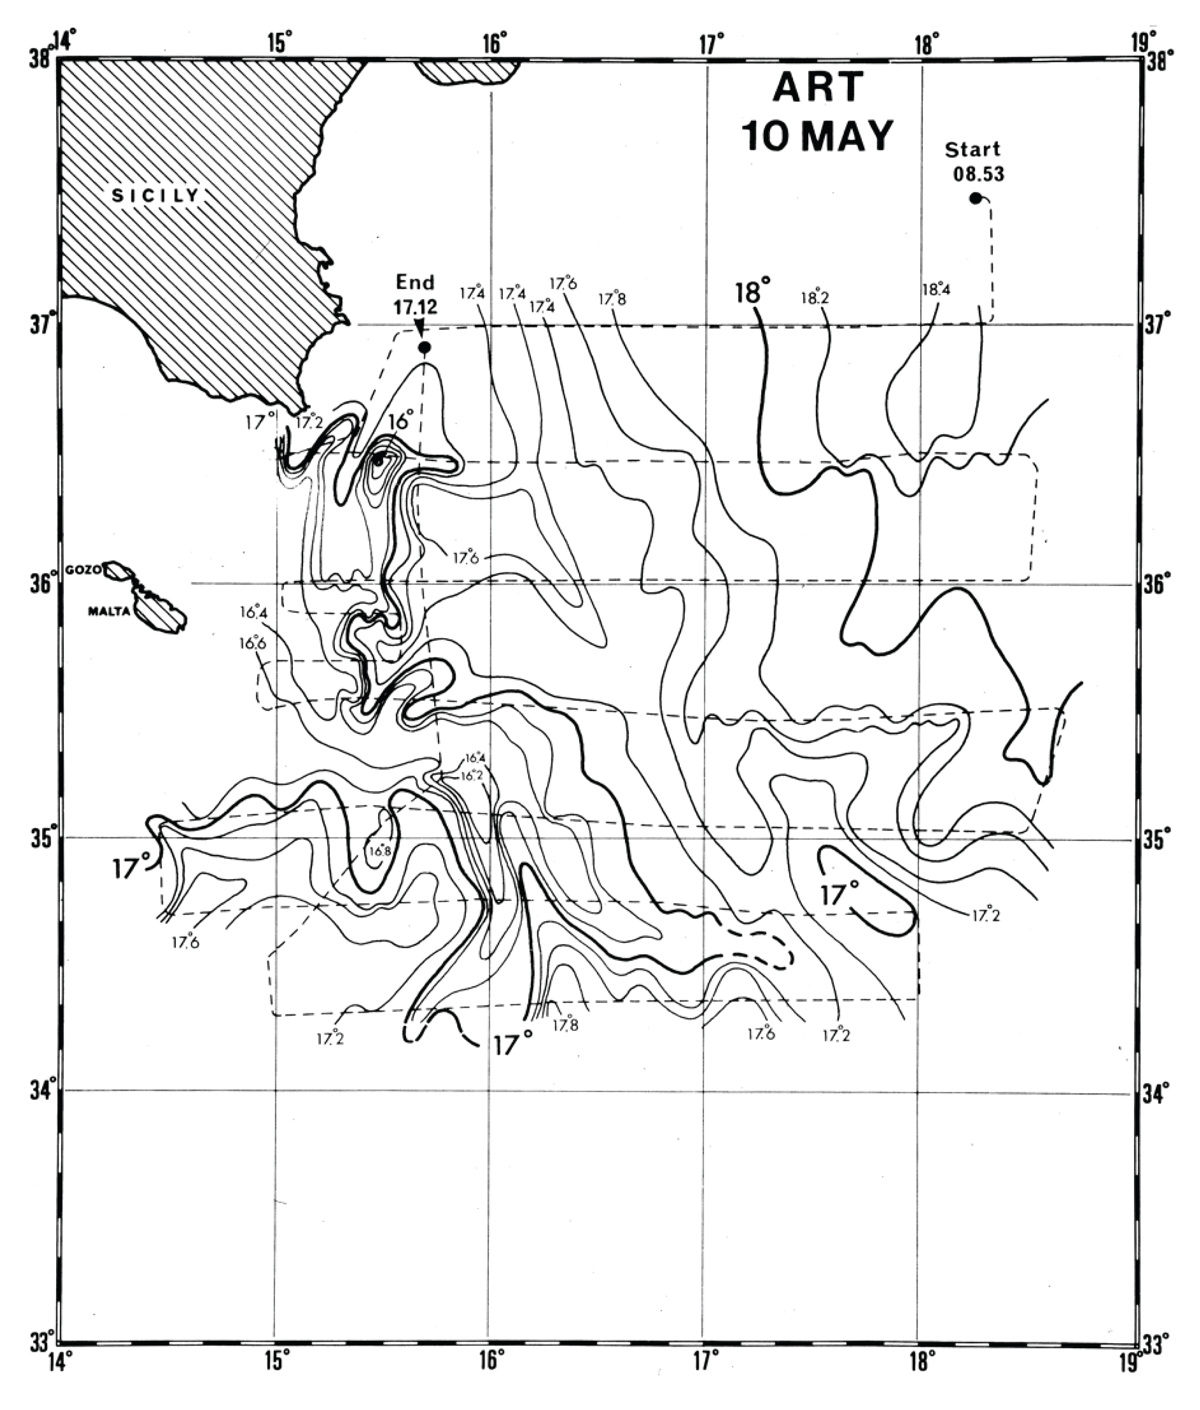
Figure 2
Large- scale mapping of the sea-surface temperature (SST) east of Malta and in the Ionian Sea on 10 May 1971 by Airborne infra-red thermometry (ART) by a US Navy P3 Orion plane during an 8-hour flight of which 5 hours were used for a quasi-synoptic location of the Maltese Ocean Front up to the southern tip of Sicily between 15–16° E longitude. [Source: Briscoe et al. (1974), Figure 1].
Table 1
Velocities versus depth 5–15–30–60 m. Daily averages: Start at 15 hours on 27 May completed at 12 hours on 30 May 1971.
| DEPTH | DAY 1 | DAY 2 | DAY 3 | |||
|---|---|---|---|---|---|---|
| V CM/S | DIR.* | V CM/S | DIR. | V CM/S | DIR. | |
| 5 | 45 | 187 | 41 | 203 | 53 | 189 |
| 15 | 39 | 197 | 38 | 211 | 46 | 202 |
| 30 | 31 | 195 | 31 | 205 | 33 | 201 |
| 60 | 7 | 169 | 8 | 182 | 7 | 171 |
[i] * dir. = direction towards in degrees [Modified from Johannessen (1976), Table 1].
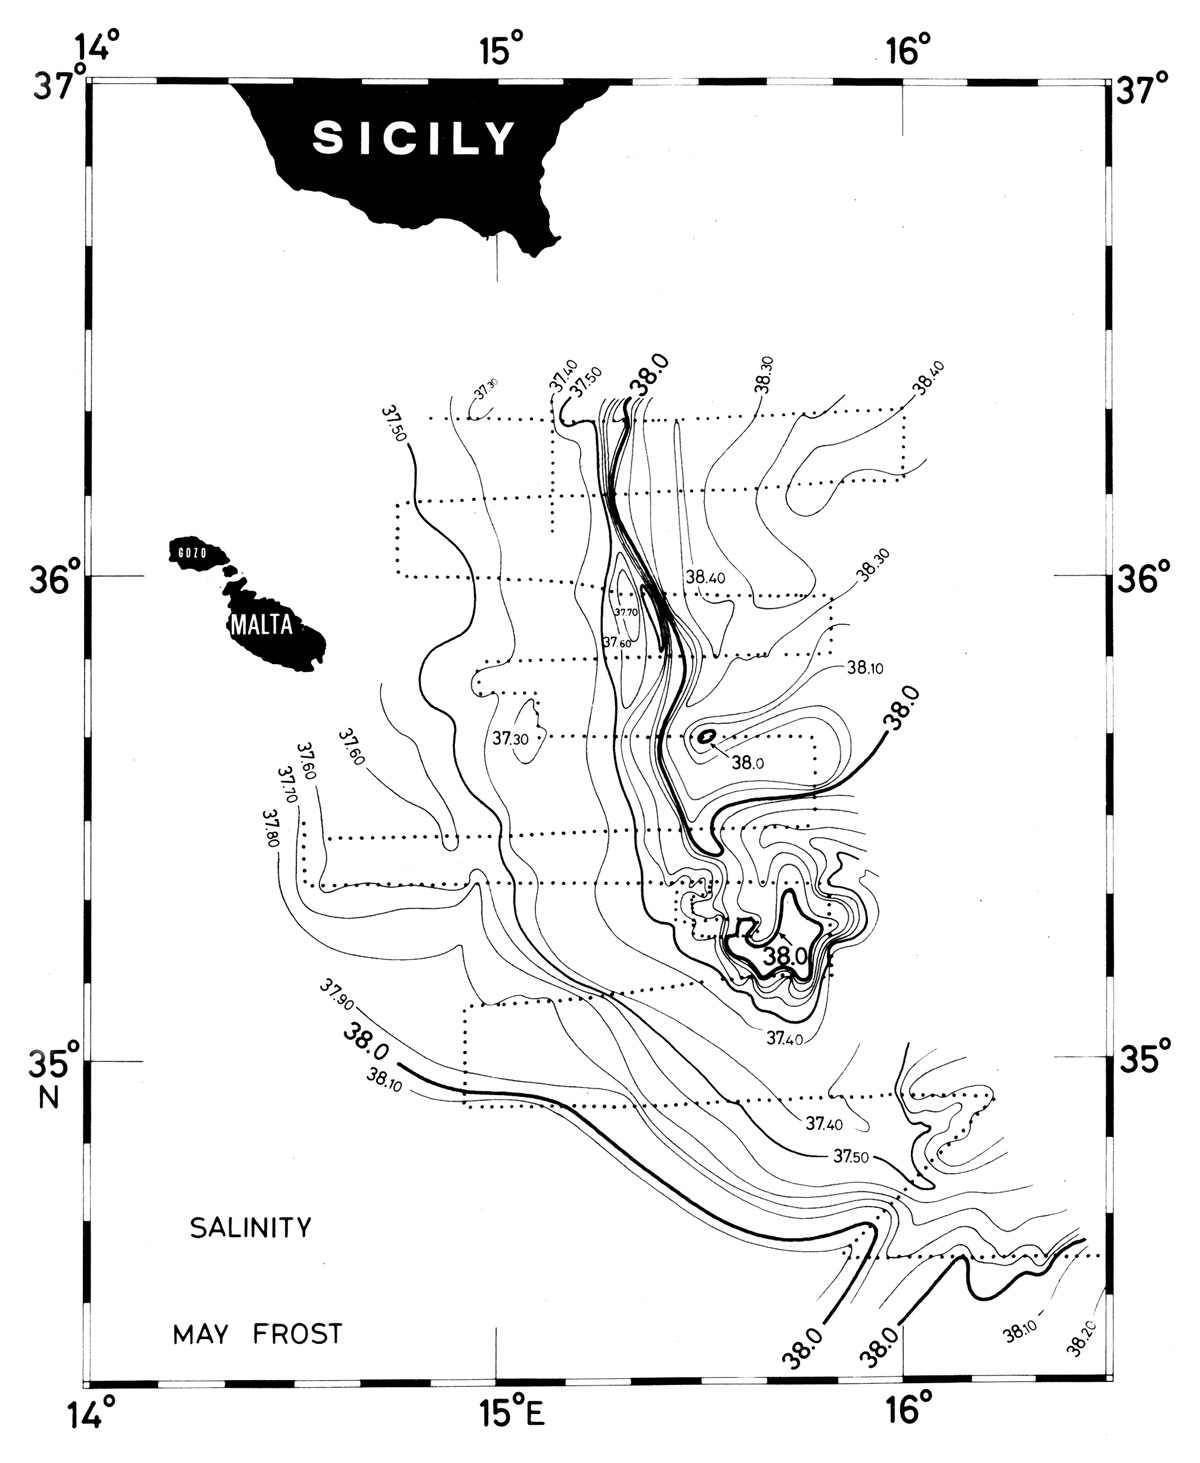
Figure 3
Surface salinity map of the frontal region east of Malta during the period 13 to 20 May 1971. The surface salinity was sampled by the ‘bucket method’, n = 2000, and the salinity was determined onboard the research vessel with a laboratory salinometer. The dots indicate the observations with a sampling rate for each 2.3 km, during a very calm period. [Source: Johannessen (1976), Figure 1].
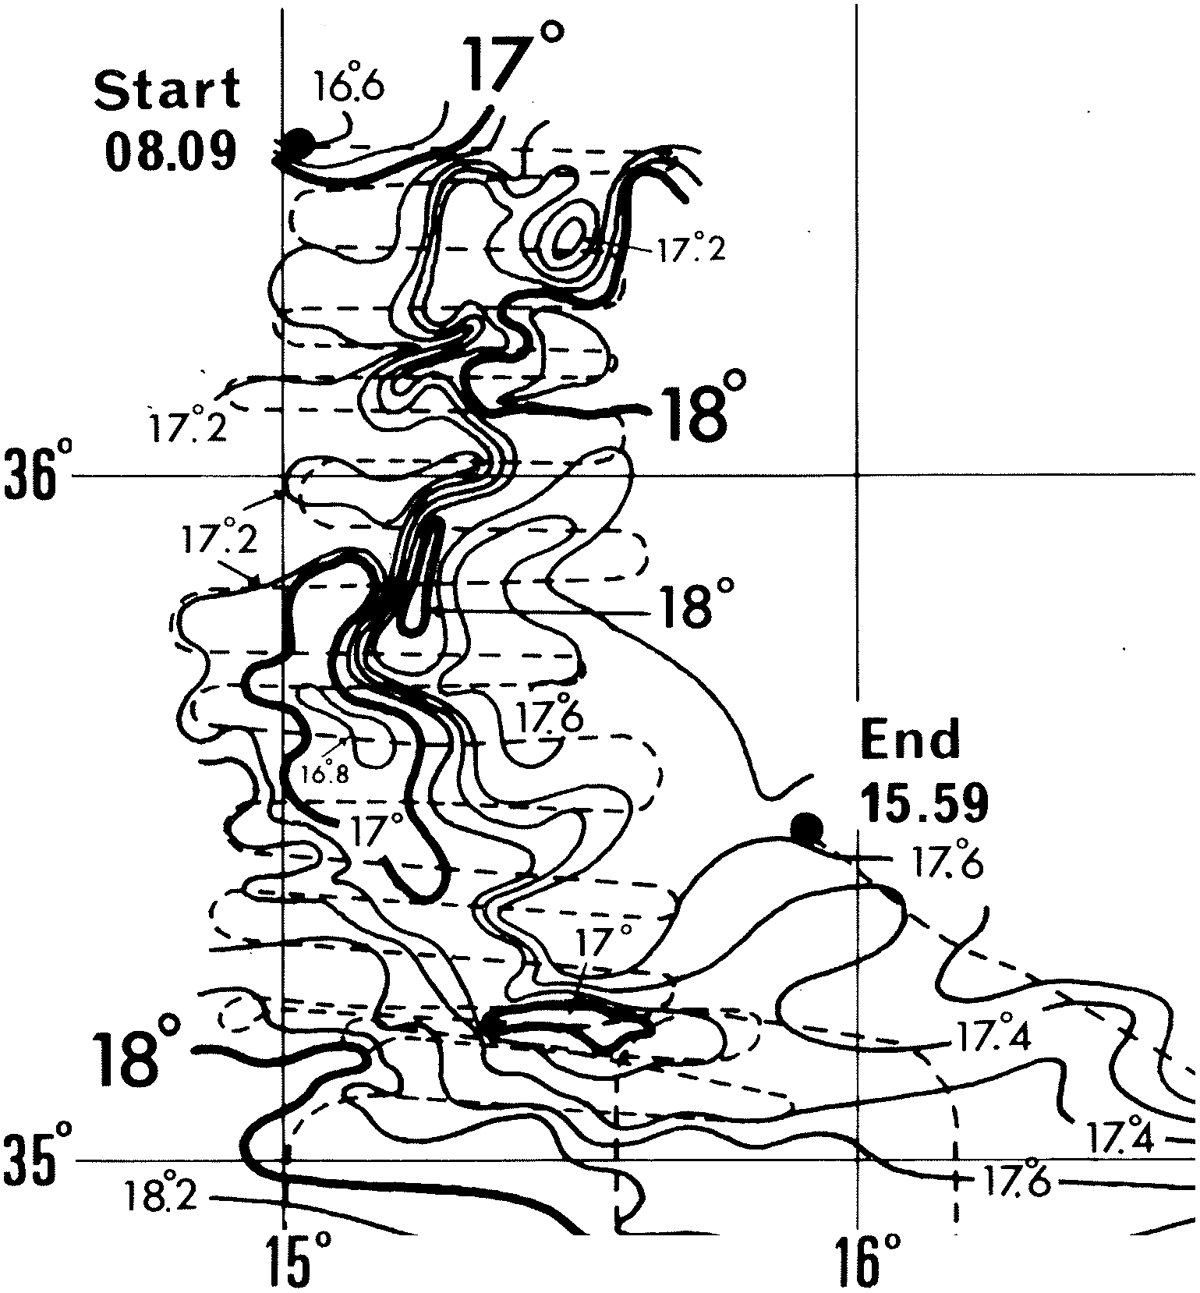
Figure 4
Detailed quasi-synoptic sea-surface temperature as obtained by an Airborne infra-red thermometry (ART) equipped airplane on 19 May 1971 during a period of 6 hours. Note the cold patches of less than 17°C in the middle of the figure and in the southern part which indicate upwelling along two crests of the meandering front during very calm wind conditions and the eddy structure with temperature of less that 17.2°C in the northern part of the figure, spun off from the front. [Source: Johannessen (1976), Figure 2].
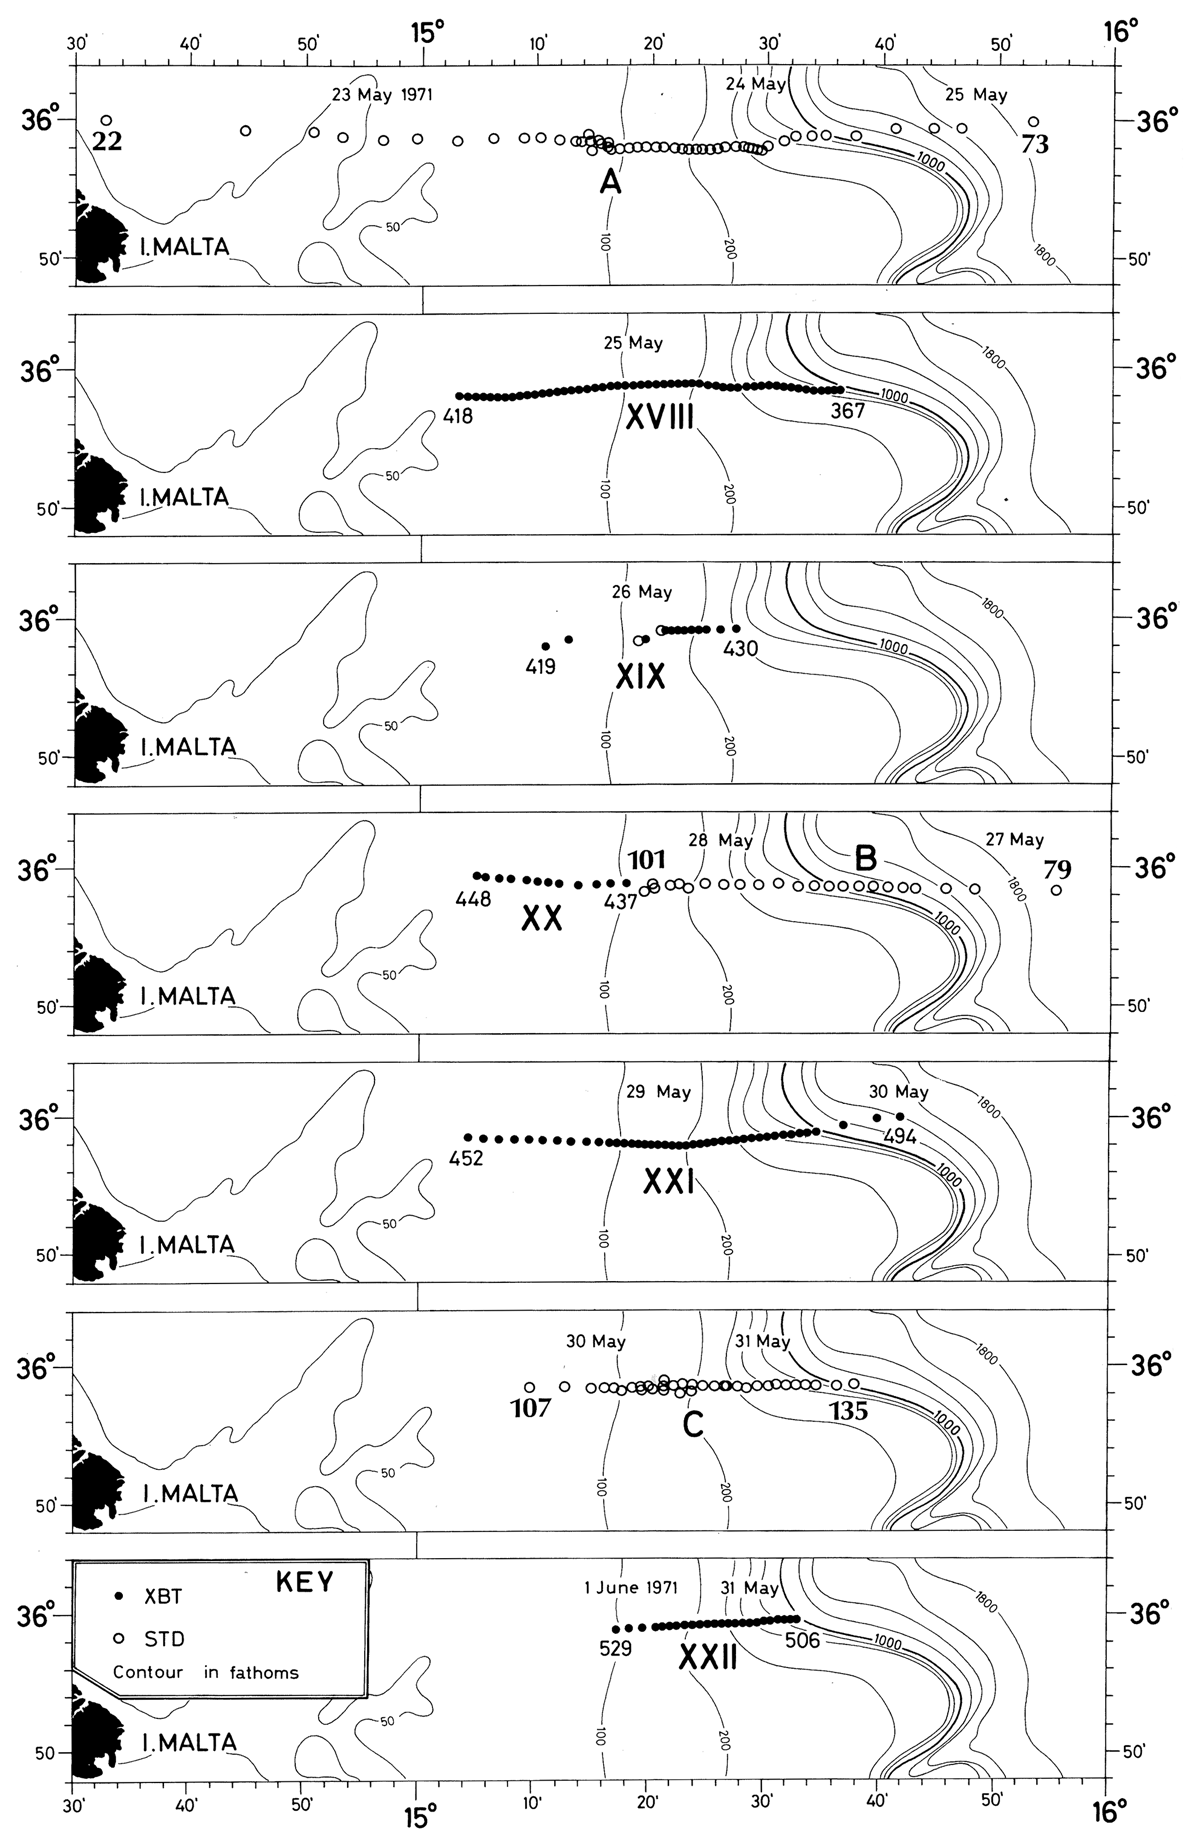
Figure 5
Programme of observations of the ocean structure of the Maltese Ocean Front during the period 23 May and 1 June 1971 by use of a a Bisset and Bergman 9060 temperature, salinity and density probe (STD) interfaced with a shipborne computer, giving values of temperature, salinity and density every 0.5 m in the upper 100 m and 1.5 m below 100 m. Expendable temperature probes (XBTs) were used to observe the temperature structure in a quasi-synoptic mode dropped from the moving ship. [Source: Johannessen (1976), Figure 3].
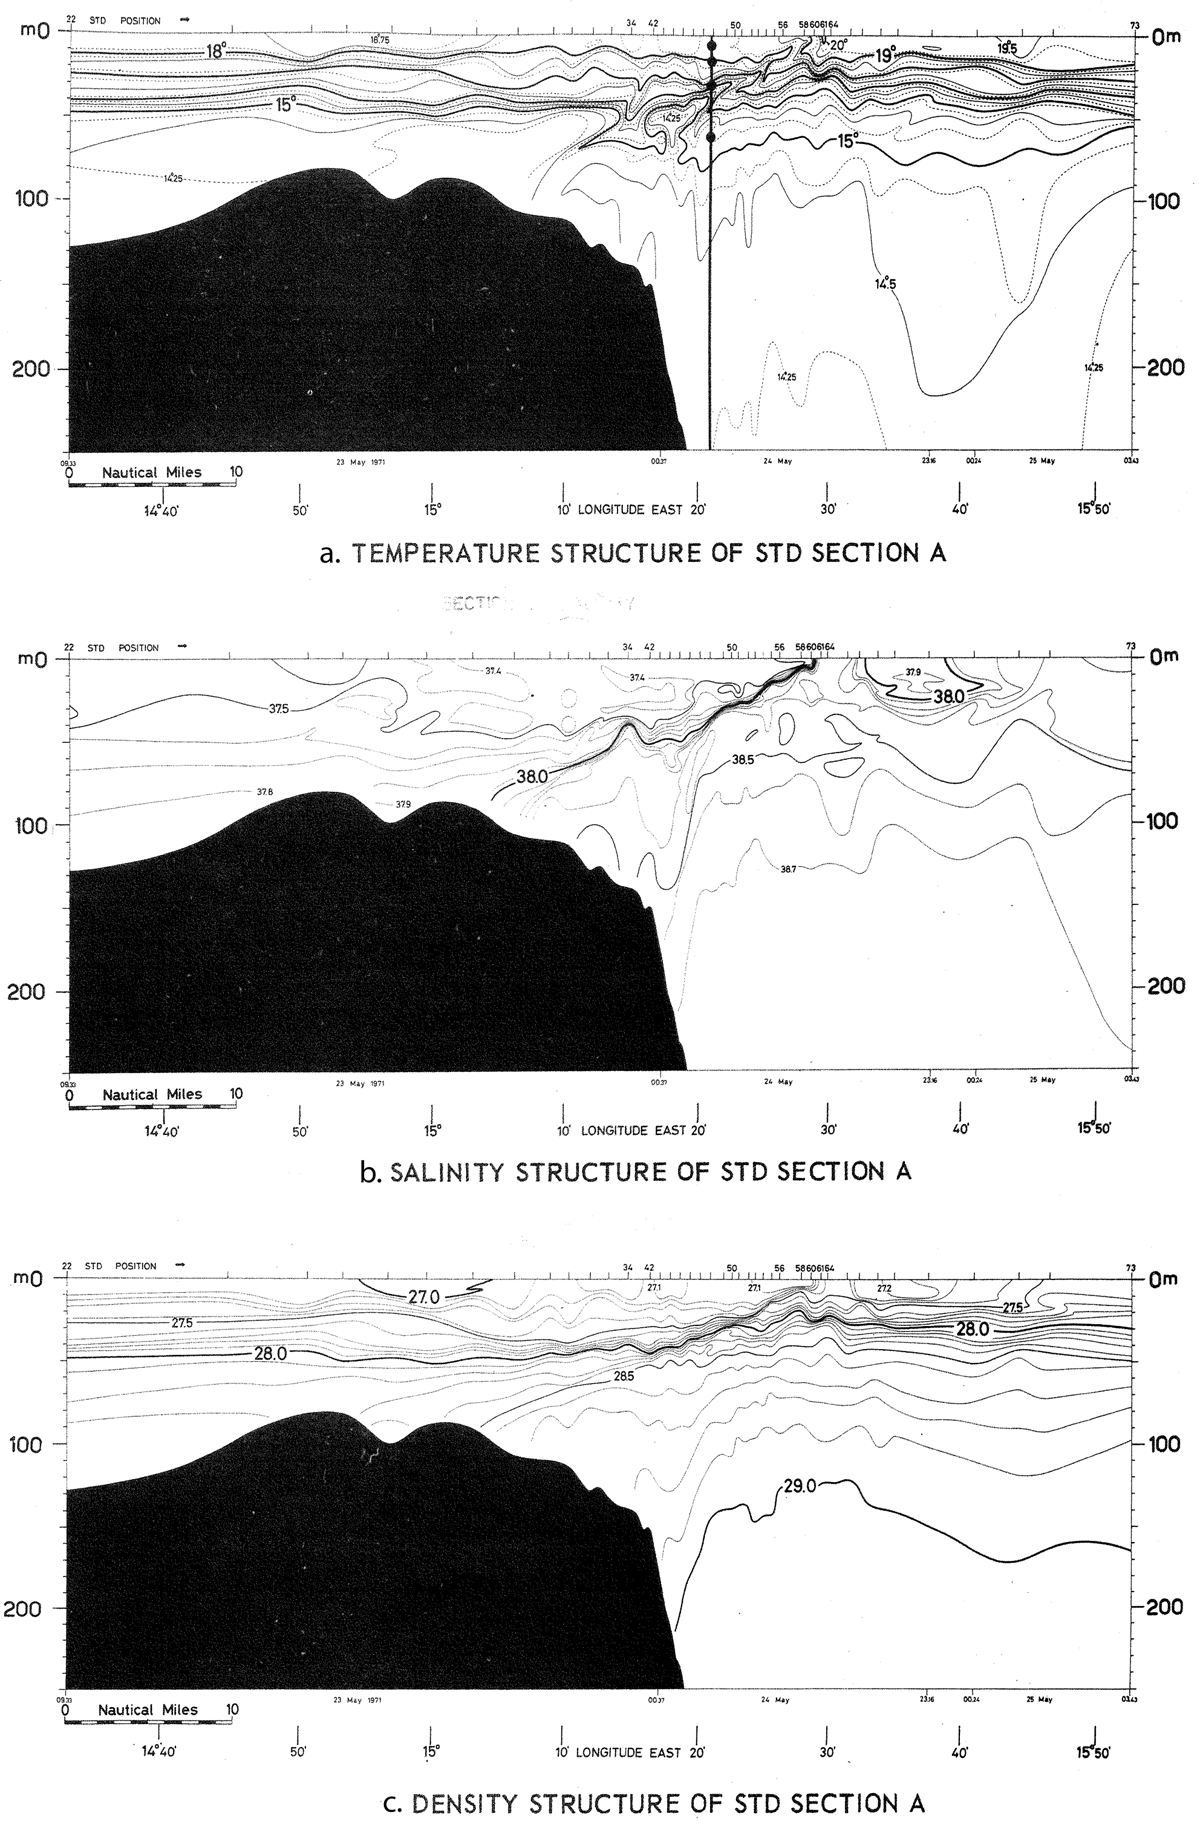
Figure 6
a, Temperature, b, salinity and c, density (STD) Section A on 23 to 25 May 1971; for position see Figure 5. The current meter array is marked on Figure 6a, but it was anchored only during a 3-day period 27–30 May. Dots mark the depth at 5–15–30–60 meter. [Modified after Johannessen (1976), Figures 4, 5, 6].
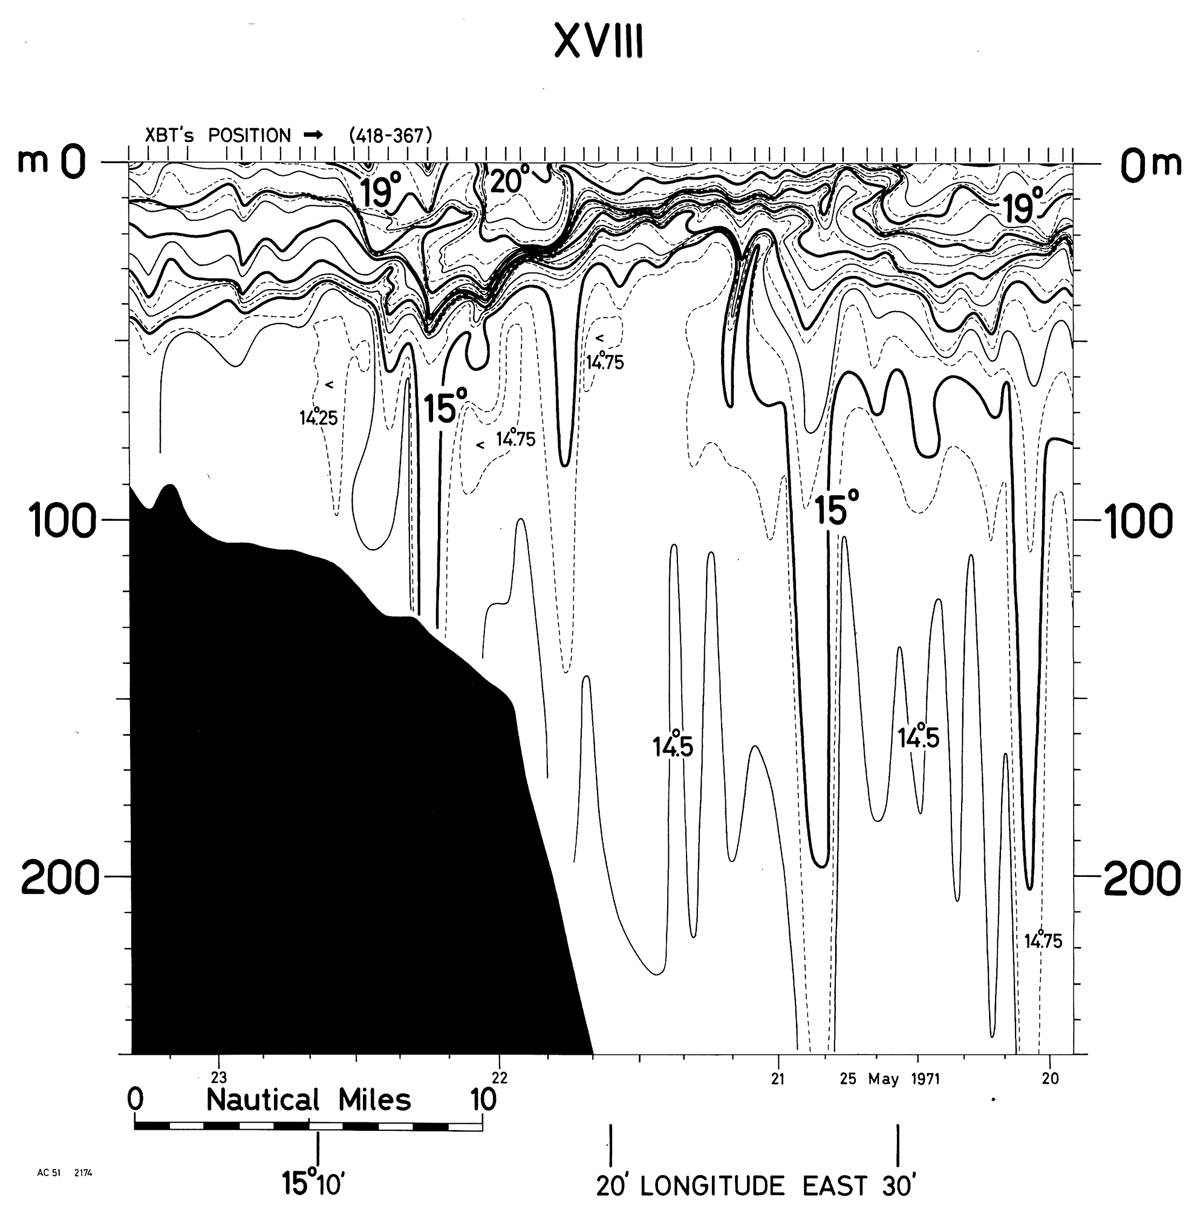
Figure 7
Expendable temperature probe (XBT) temperature section XVIII on 25 May 1971; for position, see Figure 5. [Source O. M. Johannessen].
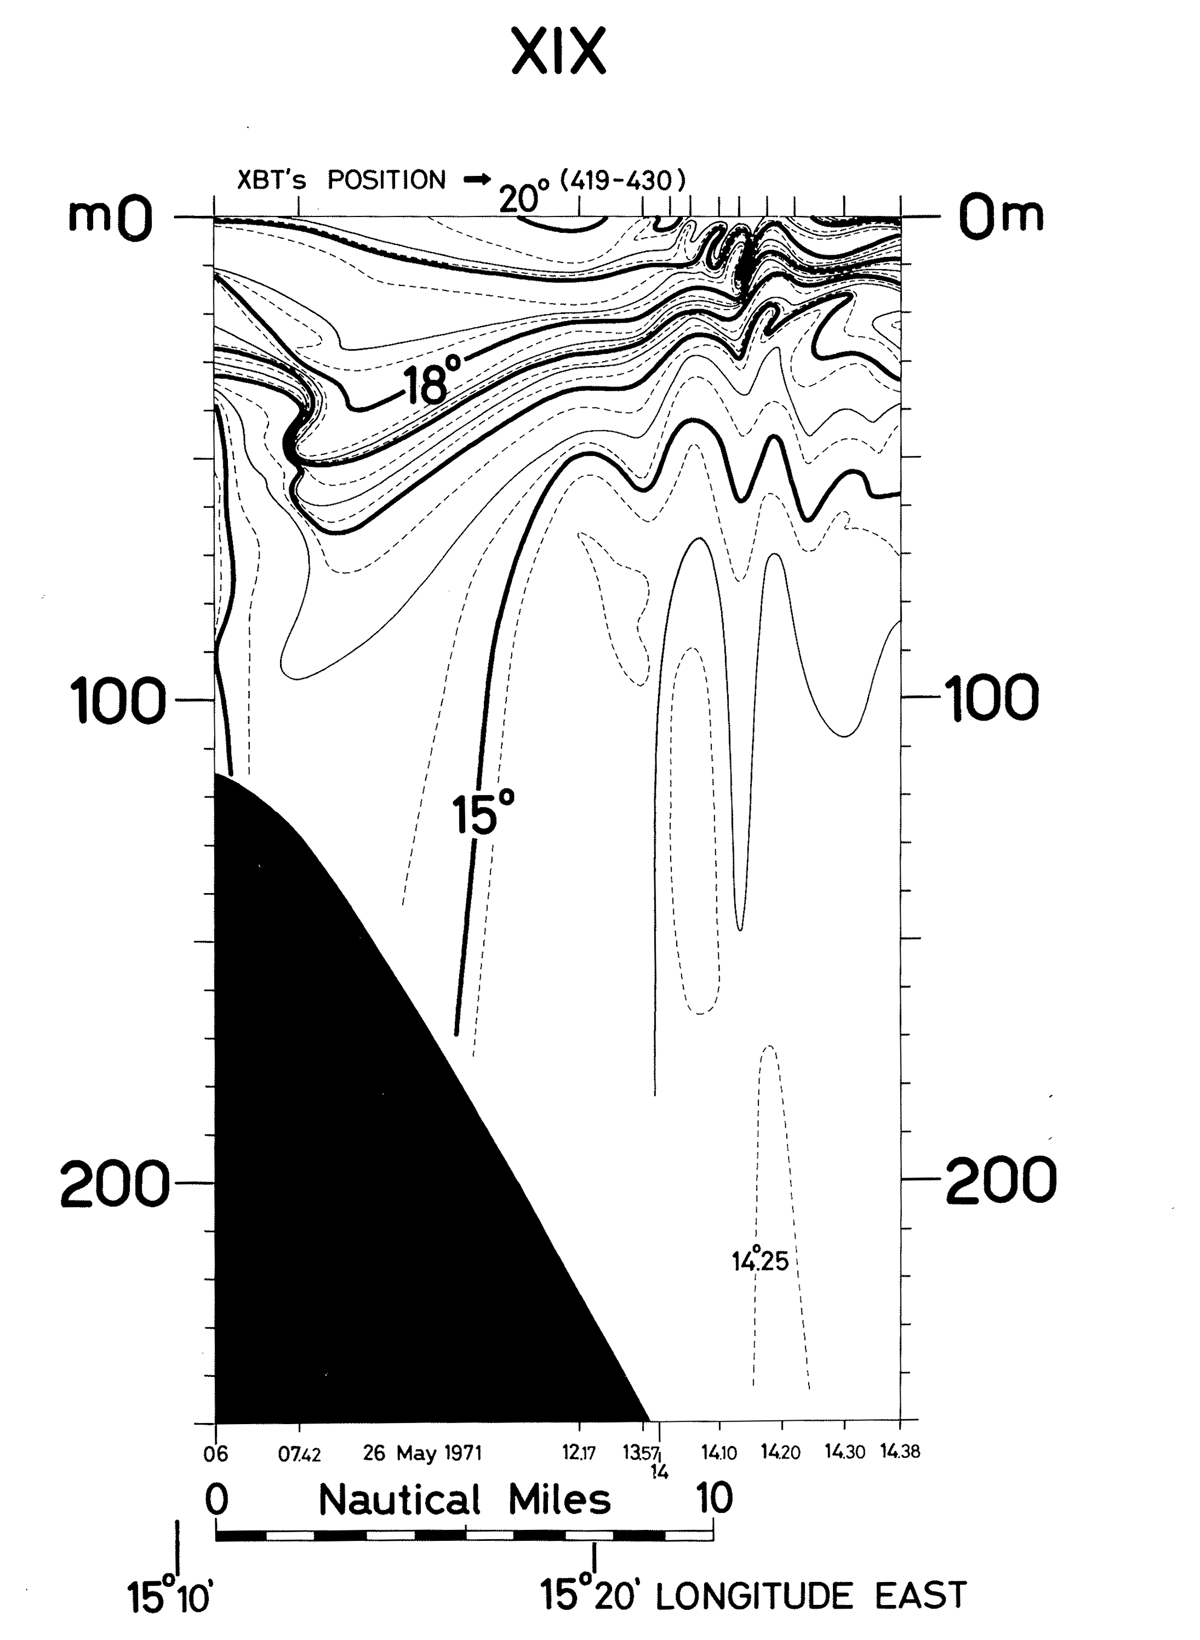
Figure 8
Expendable temperature probe (XBT) temperature section XIX on 26 May 1971; for position see Figure 5. [Source O. M. Johannessen].
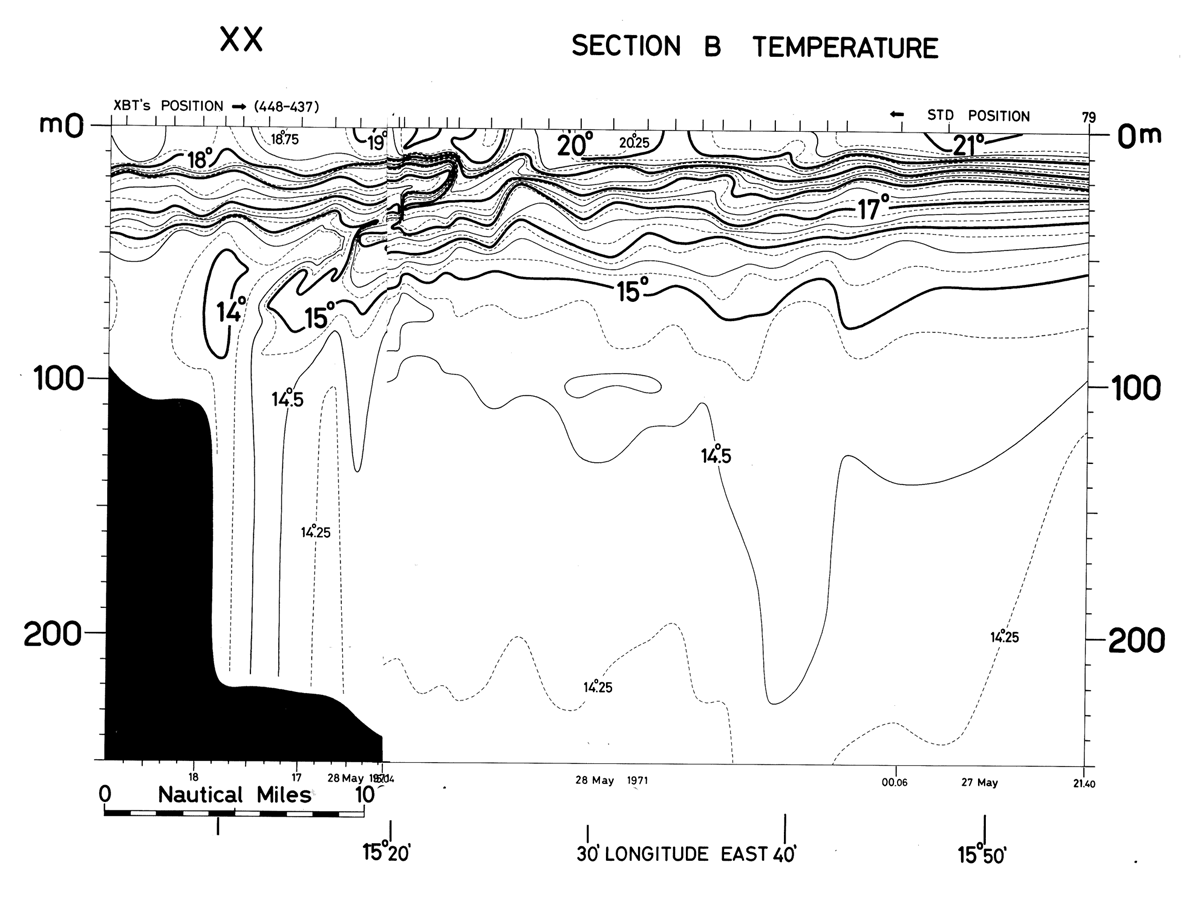
Figure 9
Merged temperature section STD Section B and XBT Section XX on 27–28 May 1971. [Source O. M. Johannessen].
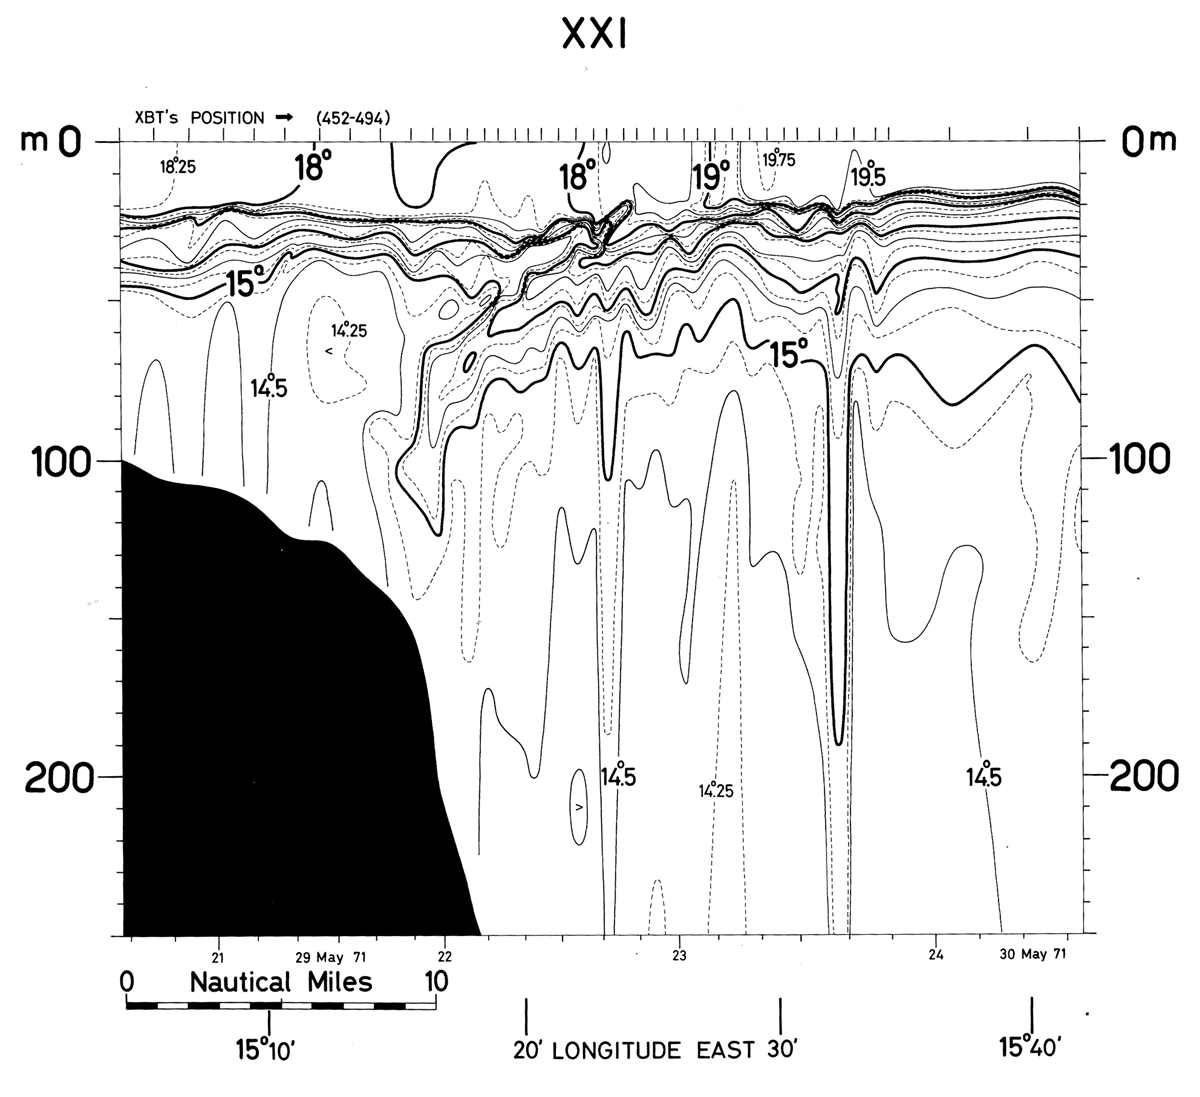
Figure 10
Expendable temperature probe (XBT) temperature section XXI on 29 and 30 May 1971; for position see Figure 5. [Source: Johannessen (1976), Figure 10].
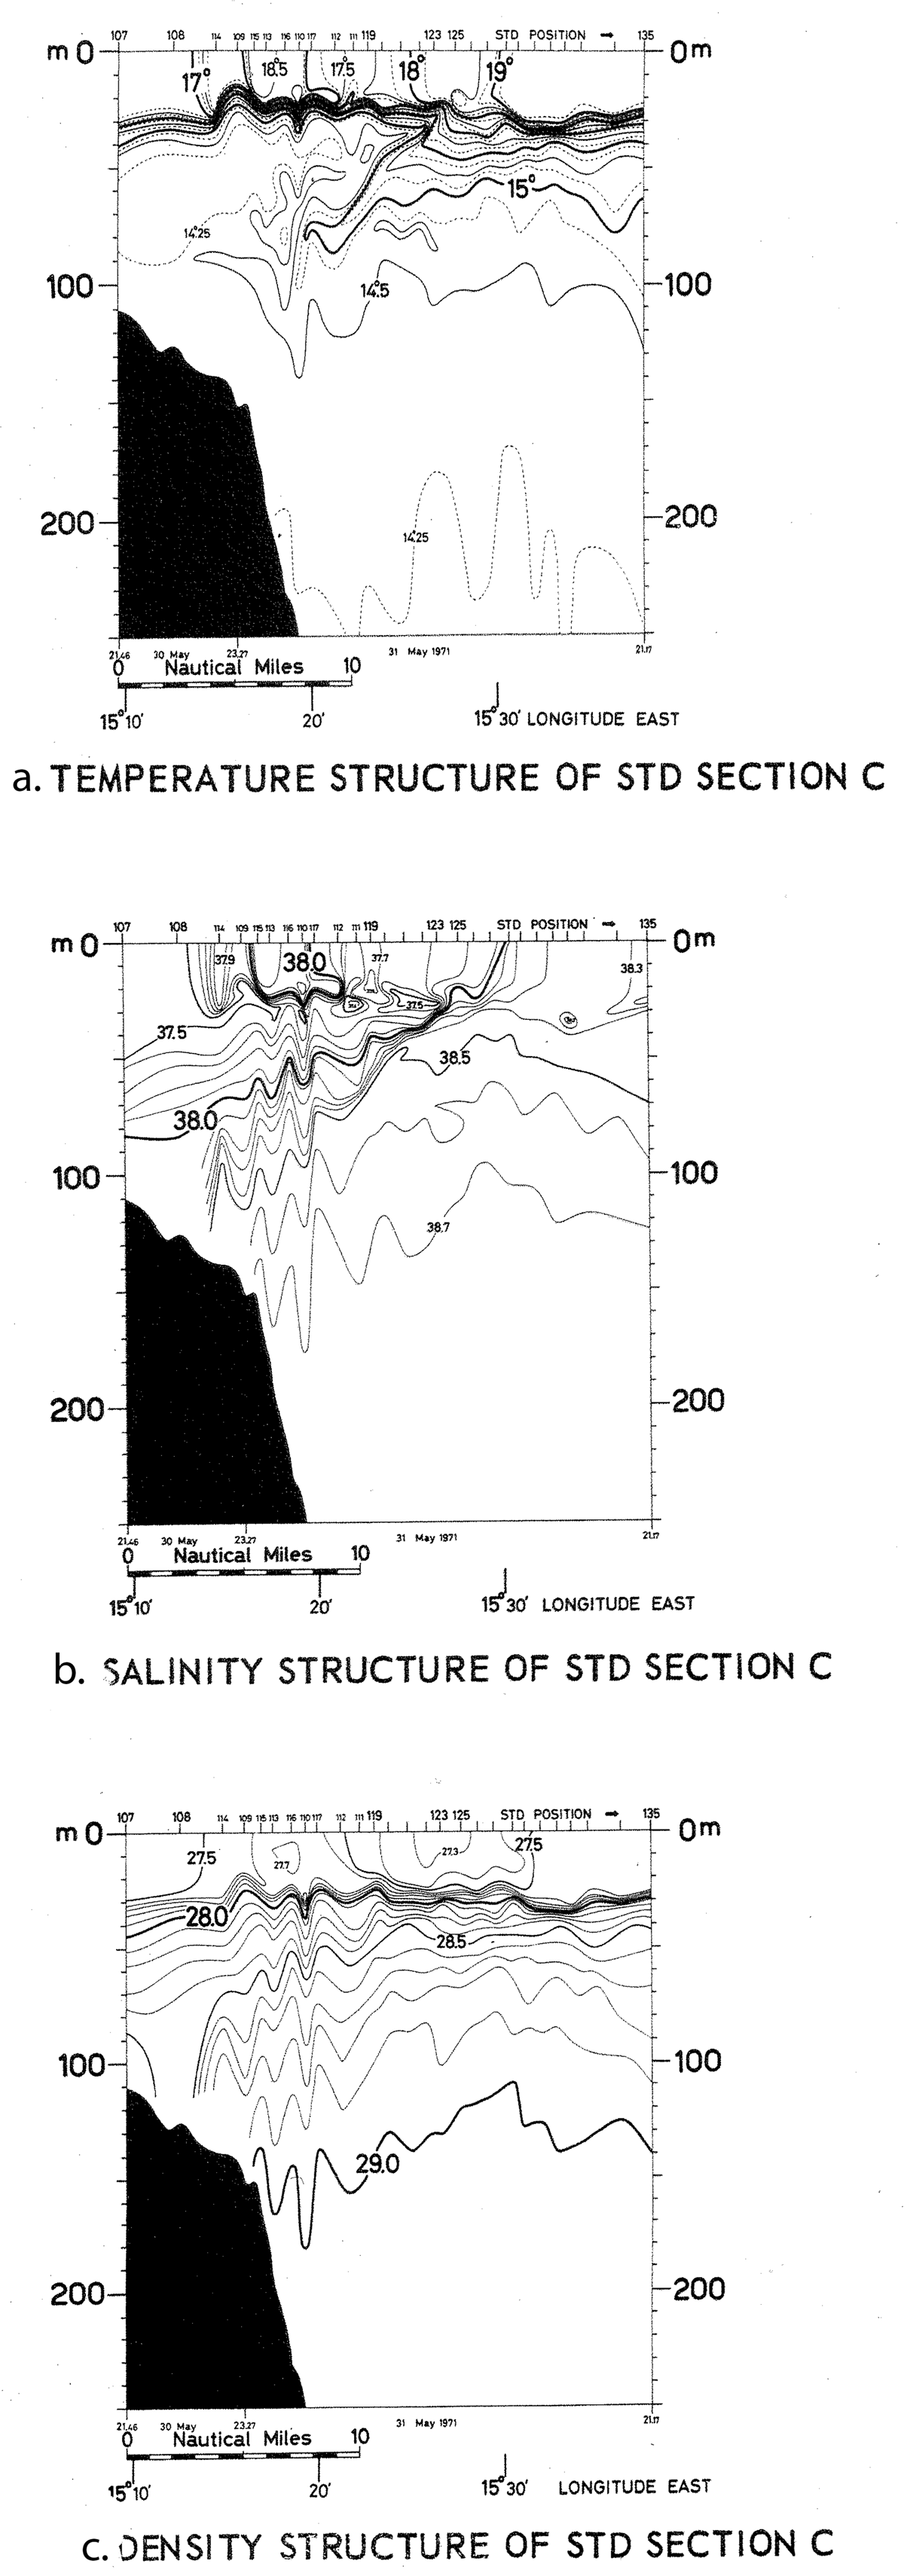
Figure 11
a, Temperature, b, salinity and c, density (STD) Section C on 30 and 31 May 1971; for position see Figure 5. [Modified after Johannessen (1976), Figures 10, 11, 12].
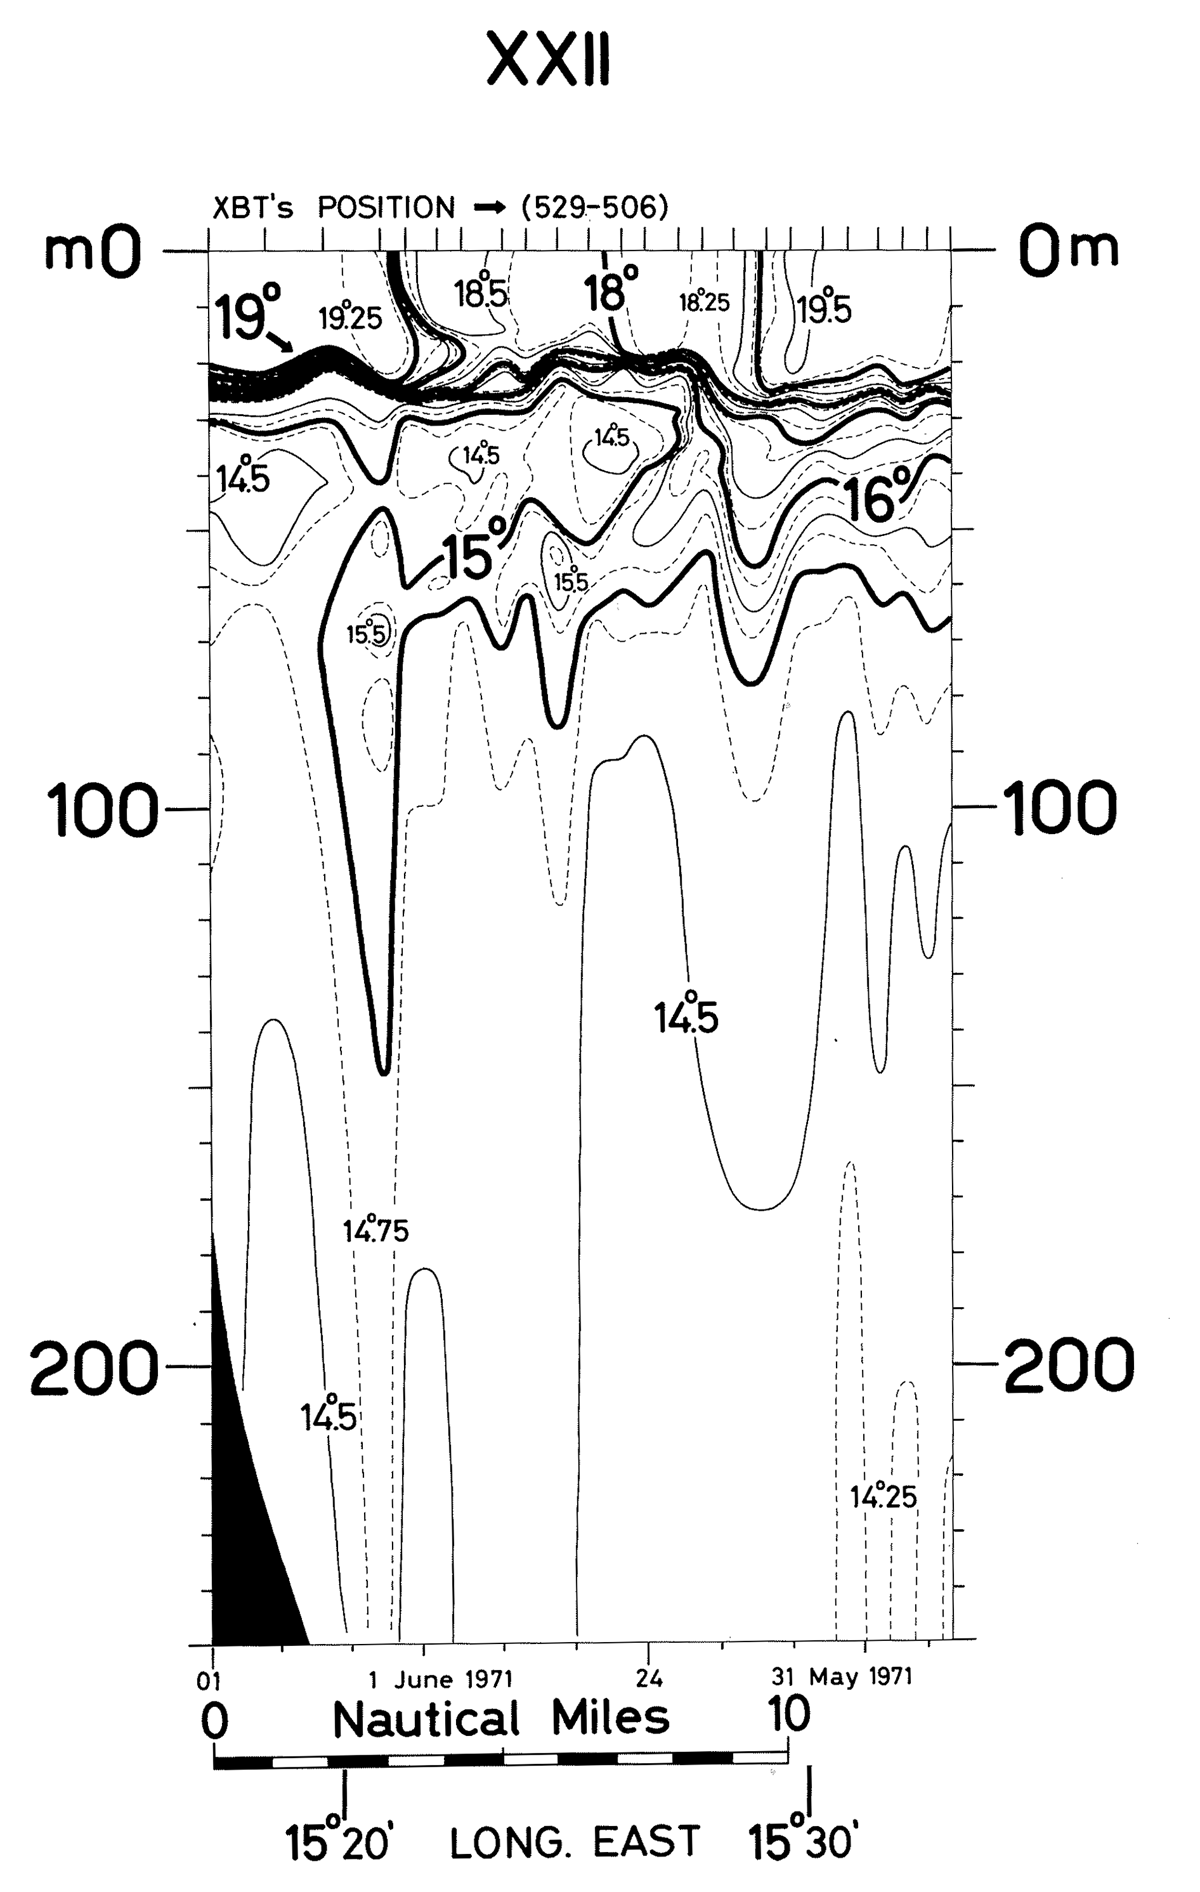
Figure 12
Expendable temperature probe (XBT) temperature section XXII 31 May and 1 June 1971; for position see Figure 5. [Source O. M. Johannessen].
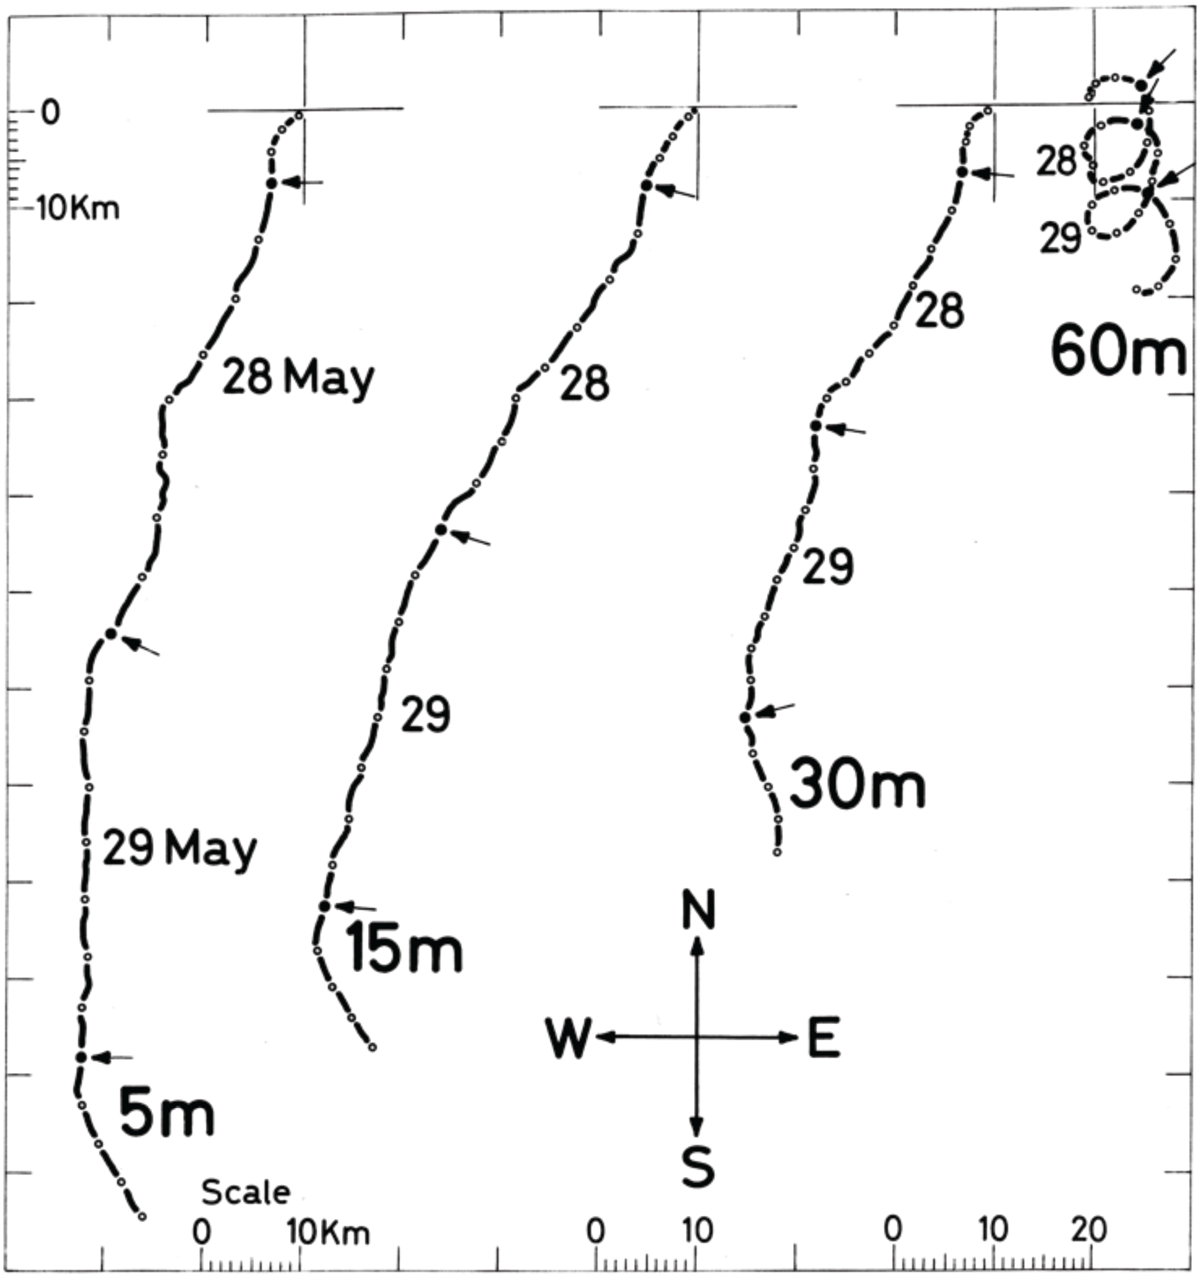
Figure 13
Vector diagram for current observations at 5–15–30–60 meters during 27–30 May 1971. Open dots indicate 3-hour interval, position marked on Figure 6. [Source: Johannessen (1976), Figure 9].