
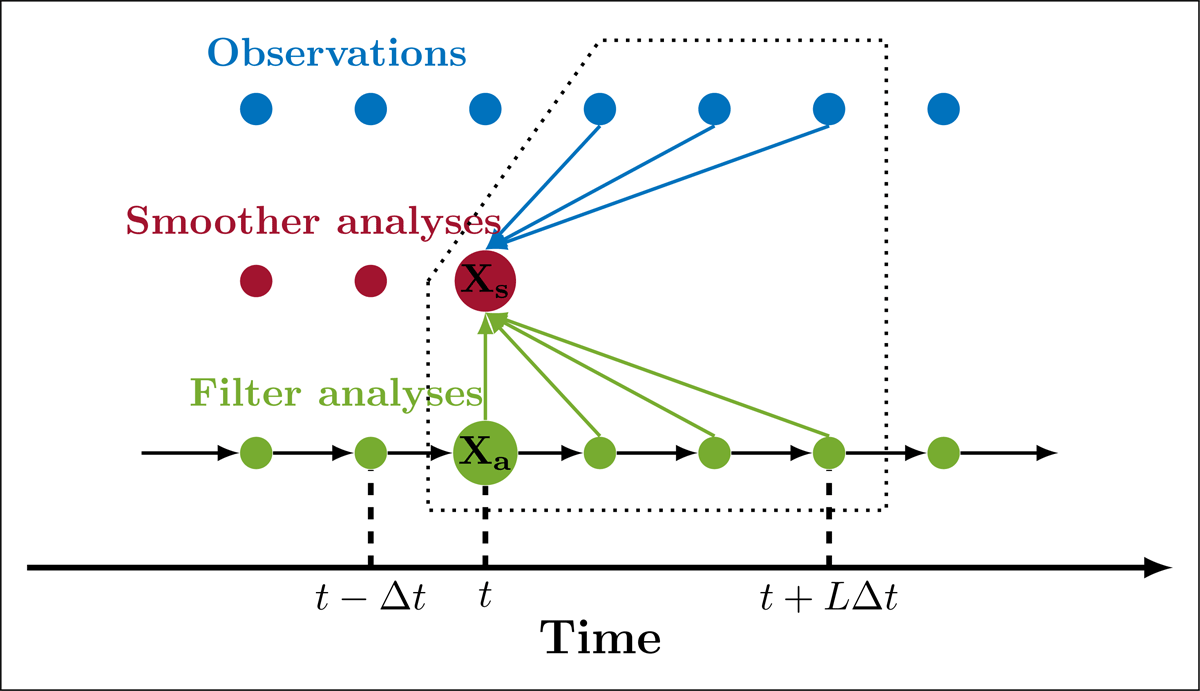
Figure 1
Schematic of the offline EnKS. The green dots represent the filter analysis after a model integration of Δt schematized by the black arrows. The blue dots depict the observations, and the red dots represent the smoother analyses of the offline EnKS. The dotted shape contains ‘future’ observations and filter analyses from t to t+LΔt to generate the smoother analysis Xs at t, in which the blue and green arrows are information flows.
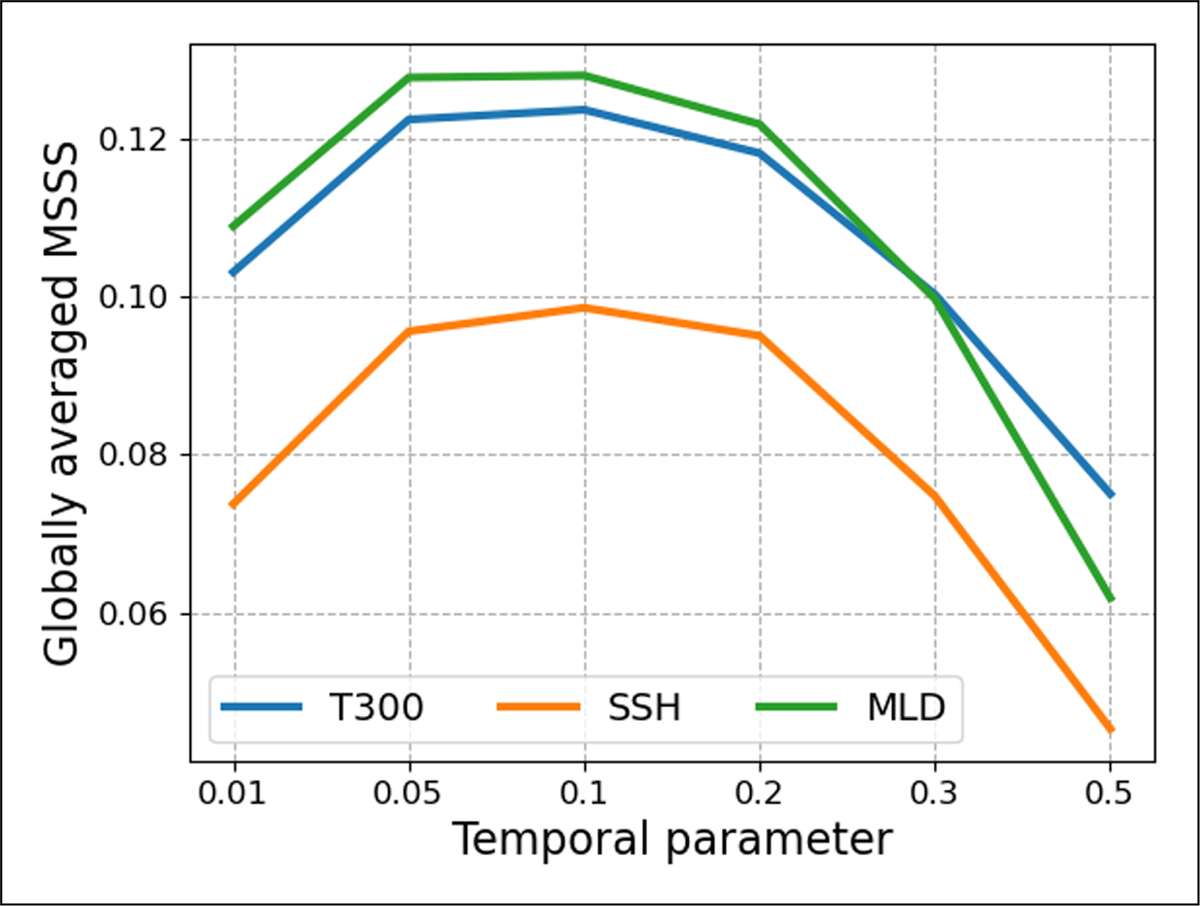
Figure 2
Globally averaged MSSS scores for different experiments for T300 (blue line), SSH (orange line), and MLD (green line).
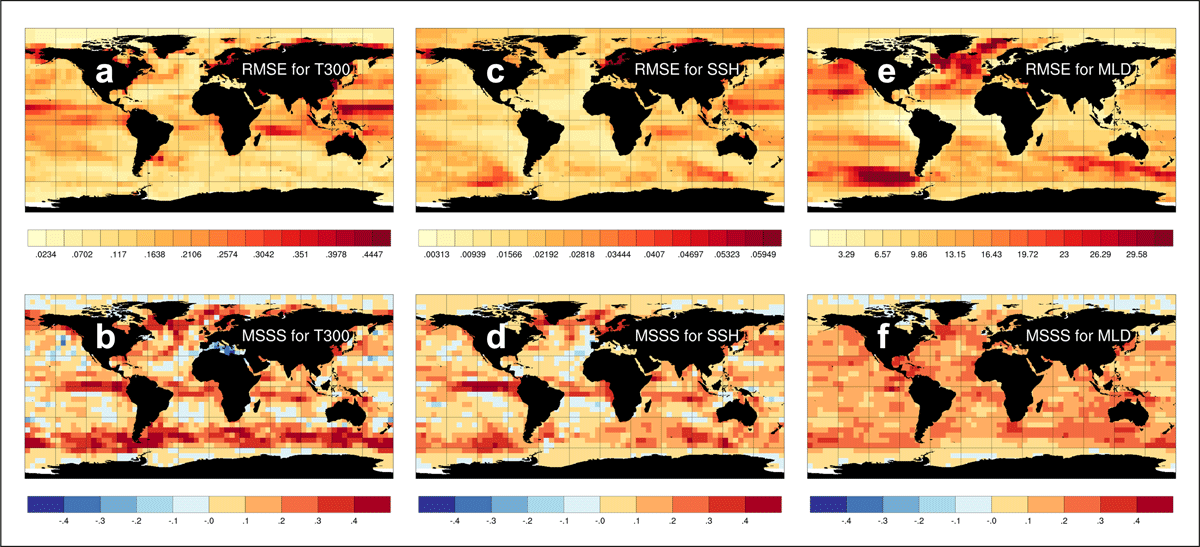
Figure 3
The upper row: the global maps of RMSE for monthly T300 (unit: °C), SSH (unit: meter), and MLD (unit: meter) in the filter analysis (reference). The lower row: the global map of MSSS for monthly T300, SSH, and MLD.
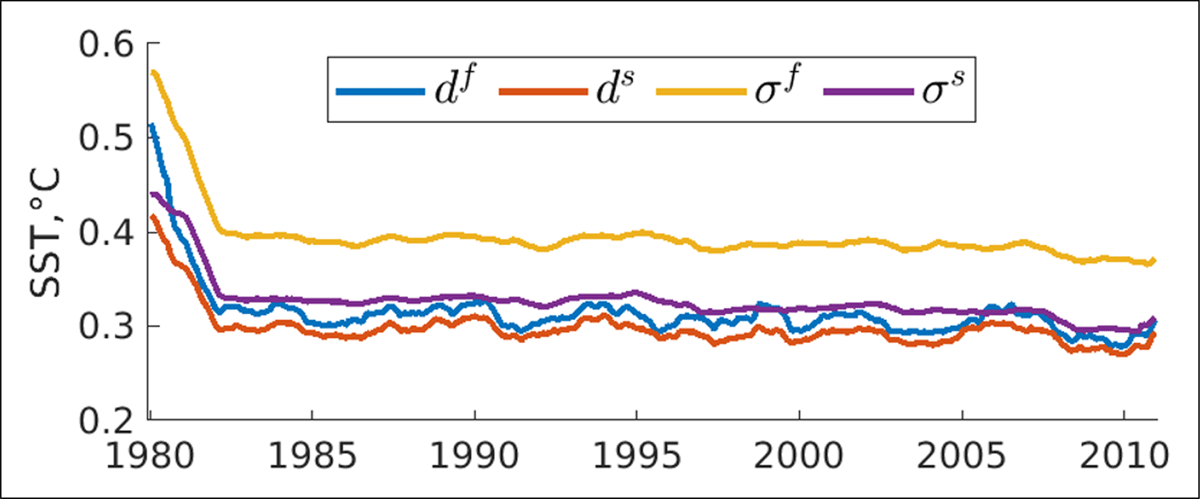
Figure 4
Global assimilation statistics for monthly SST (i.e., assimilated quantity): RMSE for the filter analysis (blue line), RMSE for the smoother analysis (red line), combined error for the filter analysis (orange line), and combined error for the smoother analysis (purple line). The time series is smoothed with a time window of 12 months.
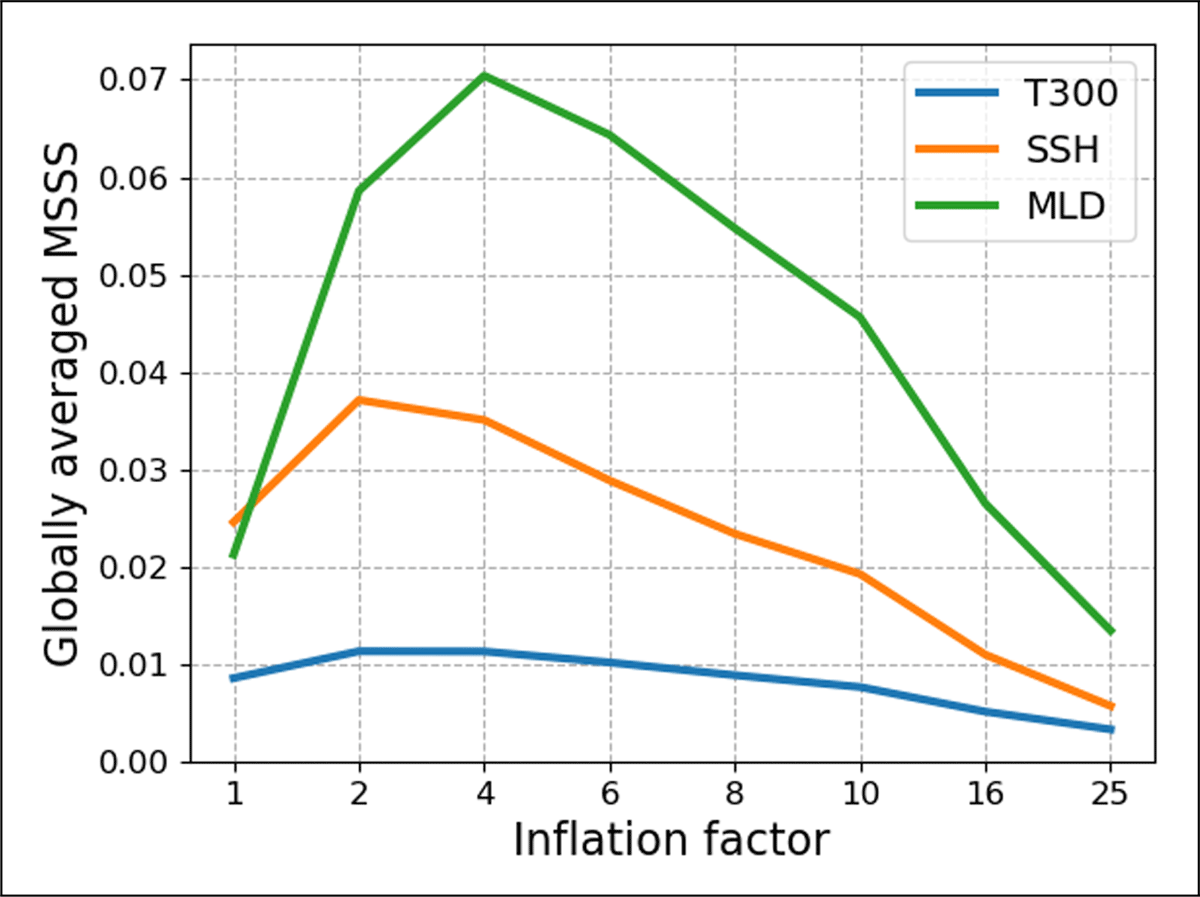
Figure 5
Globally averaged MSSS scores for different real-world experiments for yearly T300 (blue line), SSH (orange line), and MLD (green line) anomalies. In this experiment, γ = 0.1.
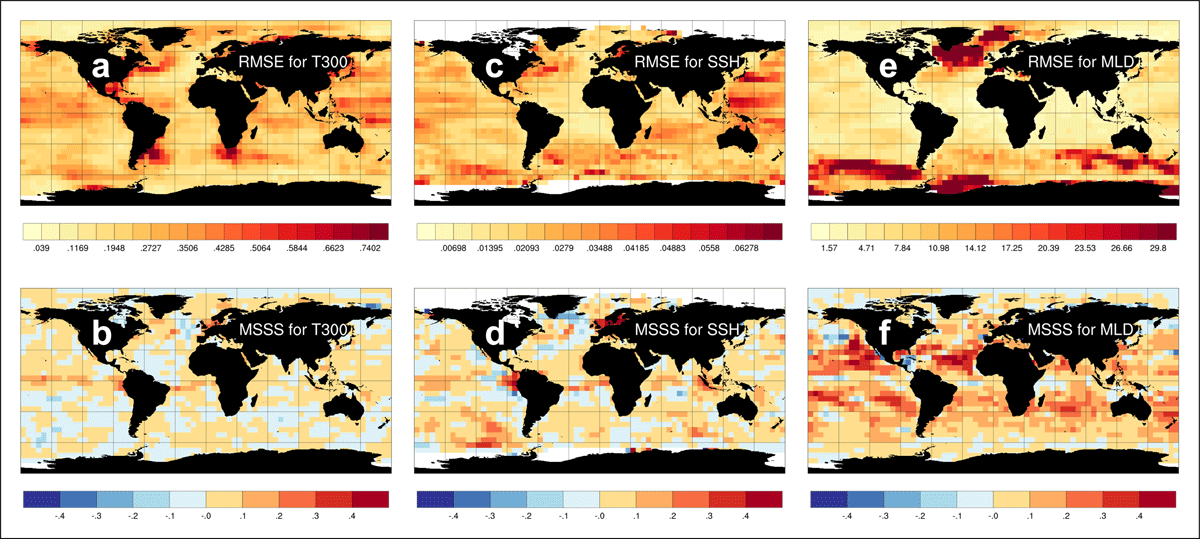
Figure 6
The upper row: the global maps of RMSE for yearly T300 anomalies (unit: °C), SSH anomalies (unit: meter), and MLD anomalies (unit: meter) in the filter analysis (reference). The lower row: the global map of MSSS for yearly T300, SSH, and MLD anomalies. In this experiment, SST observation error variance is inflated by a factor of four.
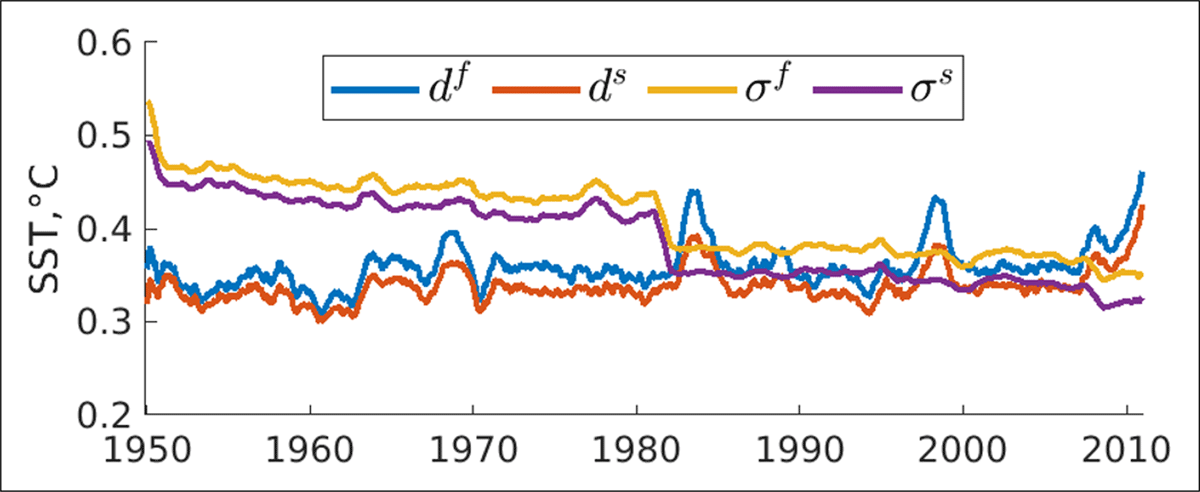
Figure 7
Global assimilation statistics for monthly SST anomalies (i.e., assimilated quantity): RMSE for the filter analysis (blue line), RMSE for the smoother analysis (red line), combined error for the filter analysis (orange line), and combined error for the smoother analysis (purple line). In this experiment, γ = 0.1, and the observation error variance is inflated by four. The time series is smoothed with a time window of 12 months.