
1 Introduction
In the past few decades, the global network of remote sensing passive microwave (MW) and infrared (IR) instruments has been dominated by low earth orbit (LEO) satellites (Kalluri, 2021, 2022) such as the series of National Oceanographic and Atmospheric Administration (NOAA) legacy Polar Orbiting Environmental Satellites (POES), the Joint Polar Satellite Program (JPSS) series of current platforms including the Suomi National Polar-orbiting Partnership (NPP) and JPSS platforms, and the Meteorological Operational (MetOp) satellite series operated by the European Organisation for the Exploitation of Meteorological Satellites (EUMETSAT). These platforms carry microwave instruments such as the Advanced Microwave Sounding Unit (AMSU-A and AMSU-B), the Microwave Humidity Sounder (MHS), the Advanced Technology Microwave Sounder (ATMS), and hyperspectral infrared instruments such as the Cross-track Infrared Sounder (CrIS) and Infrared Atmospheric Sounding Interferometer (IASI). Some newer platforms have been developed to complement these major platforms such as the Global Precipitation Measurement (GPM) Microwave Imager (GMI) instrument on an inclined orbit and the Advanced Microwave Scanning Radiometer 2 (AMSR2) instrument that specializes in measurements of precipitation, water vapor, and surface fields.
New advances in satellite and instrument technology have begun to change the global observing network. Geostationary platforms have long been used to provide atmospheric wind vectors (AMVs) along with visible and infrared (IR) images but geostationary radiance observations for direct assimilation have been limited. A series of geostationary satellites with hyperspectral IR instruments is planned to replace the current suite of geostationary platforms. This “GEO-ring” will be a joint effort between NOAA’s Geostationary Extended Observations (GeoXO, Lindsey et al. (2024)), EUMETSAT’s Meteosat Third Generation (MTG, Holmlund et al. (2021)) hyperspectral infrared sounder (IRS), the China Meteorological Administration (CMA) Geosynchronous Interferometric Infrared Sounder (GIIRS) on the Fengyun 4A and 4B (FY-4A and FY-4B, Yang et al. (2017)) platforms, and the Japan Meteorological Agency (JMA) Geostationary HiMawari Sounder (GHMS, Okamoto et al. (2020)). In addition, Small Satellites (SmallSats) and commercial platforms are increasing in availability, such as with Global Navigation Satellite Systems radio occultations (GNSS-RO). At the same time, it is expected that fewer large LEO platforms will be in orbit in the coming decades. Having a diverse set of LEO orbits is valuable for weather forecasting, particularly for sounders (WMO, 2019; Griffin et al., 2021).
The MetOp satellites have a Local Time of Ascending Node (LTAN) at 2130 hrs and the JPSS satellites’ LTAN is at 1330 hrs. The legacy POES includes the NOAA-15, –18, and –19 satellites that were originally launched in 1998, 2005, and 2009 respectively. The legacy POES satellites have drifted from their original launch orbits and are supplementing the JPSS and MetOp observations (Figure 1). Measurements from legacy POES are still contributing significantly to NWP models (Boukabara et al., 2016) and together the legacy POES, MetOp, and JPSS satellites provide global observations at least every six hours. Since the legacy POES satellites are operating beyond their designed mission life there is a high risk that the global observations would increase beyond six hours to eight hours refresh with only two orbits supported by the JPSS and MetOp constellation. Analysis of observation refresh rate from two orbits (MetOp and JPSS) show that only 81% of the Earth would be covered every six hours and adding a third orbit at 0530 LTAN would increase the coverage to 97%. An analysis of polar orbiting satellites in different orbits and their expected coverage is shown in Table 1. A three orbit sounder backbone providing a 4 hour global refresh capability is considered as a minimum requirement by the NWP community (WMO, 2019) and experiments have shown that additional observations beyond the backbone have positive impact on NWP models (Duncan et al., 2021). Figure 2 compares the coverage of three simulated microwave instruments on LEO platforms for the window from 2100 UTC to 0300 UTC including the NOAA-20 platform (1330 LTAN), the MetOp-B platform (2130 LTAN), and a 0530 orbit platform. The 0530 orbit (blue) fills in the gap between the NOAA-20 (green) and MetOp-B (red) orbits for nearly complete coverage of the globe.
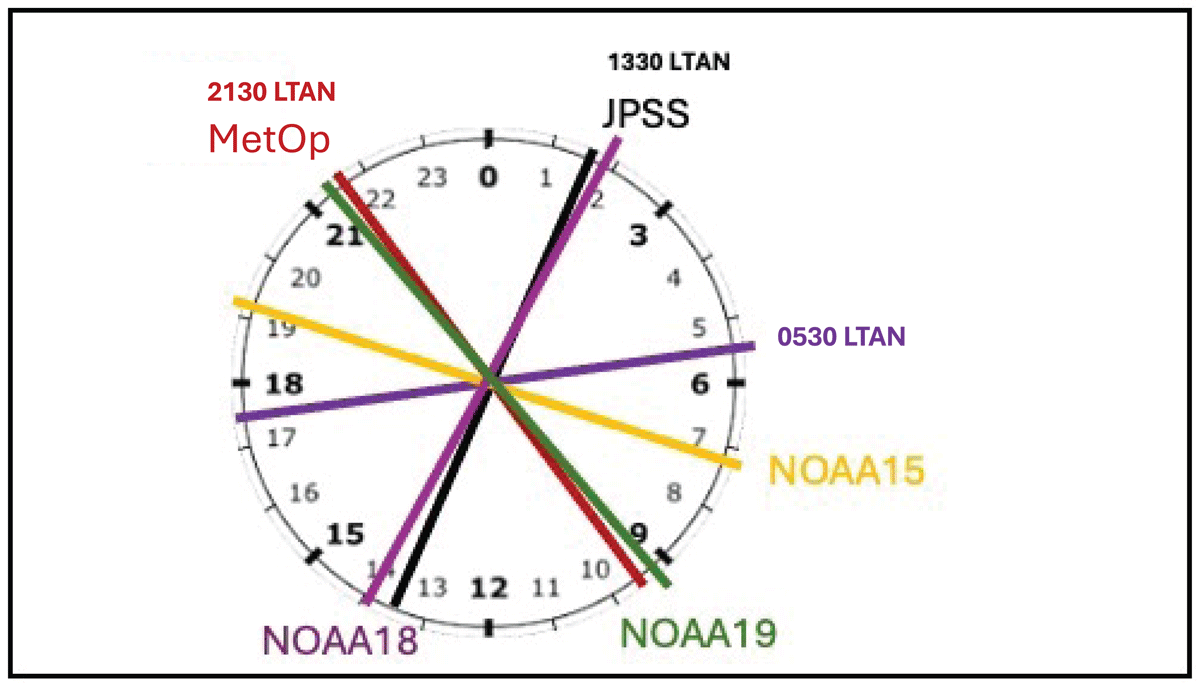
Figure 1
Local Time of Ascending Node (LTAN) of NOAA and EUMETSAT polar orbiting weather satellites as of July 24, 2024.
Table 1
Expected percentage of Earth observed by microwave sounders in a 24 hour cycle by two, three and six satellites in sun synchronous polar orbits, with each satellite at a different local time of ascending node (LTAN).
| REFRESH TIME (hr) | PERCENT OF EARTH COVERED | ||
|---|---|---|---|
| 2 PLATFORMS | 3 PLATFORMS | 6 PLATFORMS | |
| 0.5 | 10.91% | 16.84% | 30.35% |
| 1 | 20.64% | 31.53% | 53.75% |
| 2 | 39.87% | 55.94% | 81.60% |
| 3 | 52.69% | 74.78% | 94.43% |
| 4 | 64.73% | 90.06% | 98.75% |
| 6 | 81.92% | 97.02% | 99.63% |
| 8 | 94.03% | 98.59% | 99.84% |
| 12 | 99.22% | 99.64% | 100% |
| 24 | 100% | 100% | 100% |
| Orbital Planes | 2 | 3 | 6 |
| Orbit LTAN | 1330, 2130 | 0530, 1330, 2130 | 0530, 1330, 2130 |
| 0330, 0730, 1130 | |||
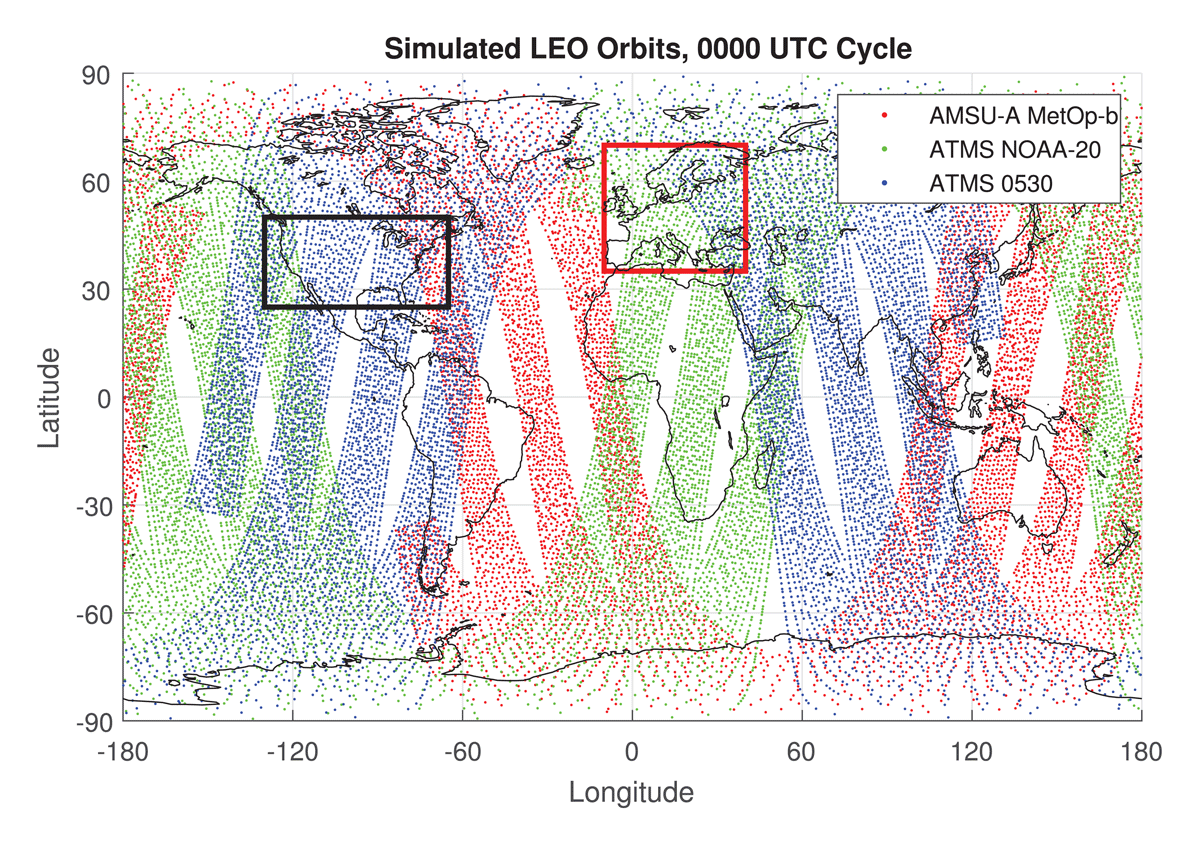
Figure 2
Simulated observation locations for July 1 0000 UTC cycle time (six-hour time window centered on 0000 UTC). Red, AMSU-A MetOp-b; green, ATMS NOAA-20; blue, ATMS 0530. Black box indicates the region used for CONUS calculations, red box indicates the region used for Europe calculations.
The CMA launched Fengyun-3E (FY-3E, Zhang et al. (2022)) in 2021 as suggested by the WMO following an assessment by a Tiger Team (2013). This platform is sun-synchronous with a 0540 LTAN and has 11 instruments. The FY-3E platform includes the Microwave Humidity Sounder-II (MWHS-II) and Microwave Temperature Sounder-III (MWTS-III) and a hyperspectral High Spectral Infrared Atmospheric Sounder-II (HIRAS-II) instrument for NWP (Zhang et al., 2024). Multiple observation impact studies for the MWHS-II and MWTS-III on the FY-3E platform have been performed. In early tests, Kan et al. (2022) examined MWTS-II and MWHS-III observation impacts using the CMA Global Forecast System (CMA-GFS) for one month, finding significant improvement to forecasts in the tropics, with weaker impacts in the extratropics, and overall impacts on par with ATMS. Li et al. (2022) assimilated a month of FY-3E MWTS-III observations into the CMA-GFS and found improvement to the southern hemisphere forecast for the initial one to two day period but neutral impacts in the northern hemisphere and some degradation in the tropics. Xiao et al. (2023) compared impacts of the humidity and temperature channels from FY-2E MWHS-III, with temperature channels at 118 GHz having stronger beneficial impacts than humidity channels at 183 GHz and most beneficial impacts for the combination of both temperature and humidity channels. The largest impacts were found in the southern hemisphere with some improvements also seen in the northern hemisphere and tropics. Li et al. (2024) found that the MWTS-III observations have a beneficial impact that complements data from the MetOp-B and Fengyun-3D (FY-3D, afternoon orbit) microwave instruments. Significant impacts from MWTS-III data were seen in the southern hemisphere extratropics and the tropics, with benefits persisting to the four-day forecast period. Steele et al. (2023) performed impact tests for MWHS-II observations in the European Centre for Medium-Range Weather Forecast (ECMWF) forecasting system for a four-month period. Significant improvements during the one to three day forecast period were found in the southern hemisphere, primarily in the middle and upper troposphere, with some beneficial impacts also seen in the northern hemisphere and more neutral impacts in the tropics.
Additionally, work has been done to evaluate the impact of the HIRAS data from the FY-3E platform. Zhang and Shao (2023) examined HIRAS observation impacts from both FY-3D and FY-3E in the regional United Forecast System Short Range Weather model (UFS-SRW) and found that the HIRAS-II on FY-3E had greater impact over the continental United States than HIRAS-I on FY-2E possibly due to a combination of better instrument quality in HIRAS-II and also due to the different orbital passage time of FY-3E. Liu et al. (2024) ingested HIRAS-II observations into the global CMA-GFS for March 2023. HIRAS-II was found to significantly improve the analysis in the southern hemisphere and tropics with the greatest impacts in the tropics. Forecast impacts were confined to one to two day improvements to tropical winds and temperatures with other impacts largely neutral.
NOAA microwave sounders have been providing global observations for over 40 years and are a critical input to NWP models run by meteorological offices around the world. Because of their critical importance to NWP NOAA’s Near-Earth Orbit Network (NEON) has begun the development of next generation microwave sounders as a high priority for continuity to JPSS. NOAA is conducting Phase-A studies for its next generation of microwave sounders, the “Sounder for Microwave-Based Applications (SMBA),” which is a follow on to the highly successful ATMS sensor. SMBA would fly on NOAA’s NEON program series of LEO satellites with the first launch planned in 2030. SMBA is expected to have several improvements over the current ATMS such as the ability to detect radio frequency interference in satellite measurements, hyperspectral measurement capabilities, and low noise of observations. NOAA is also planning to launch an ATMS in a free flyer mission called Quicksounder in 2026 at an early morning LTAN to support NOAA’s next generation satellite architecture for its future low Earth orbit program and to explore new opportunities in agile and rapid acquisition of commercial flight and ground segment elements.
In support of future LEO planning and to develop a mission/system architecture that is credible and responsive to program expectations, requirements, and constraints on the project, including resources, the LEO program sponsored several Observing System Simulation Experiments (OSSEs) as required by the Weather Reseach and Forecasting Innovation Act (Congress of the United States, 2017) to quantitatively assess the relative value and benefits of observing capabilities and systems. An OSSE is a purely simulated study in which the real atmosphere is replaced by a modeled atmosphere called the Nature Run. Simulations of current and future remote sensing and in situ instruments are generated using the Nature Run for sampling. The simulated observations are then ingested into an operational NWP model and tested in data addition experiments. Because the entire framework is simulated different configurations of proposed instruments can be generated prior to the launch of new platforms. In this study, a speculative future global network is assumed in which there is a reduced constellation of LEO platforms compared to today but a GEO-ring of hyperspectral infrared instruments is available. The instruments on the 0530 platform are modeled after the current ATMS and CrIS instruments and are tested both separately and in combination in the OSSE.
The OSSE framework used for the experiments was developed at the National Aeronautics and Space Administration (NASA) Global Modeling and Assimilation Office (GMAO) and has been extensively calibrated and validated (Errico et al. (2013), El Akkraoui et al. (2023), Privé et al. (2023a)). This framework has been used for numerous instrument studies including the Midwave Infrared Sounding of Temperature and humidity in a Constellation for Winds (MISTiC Winds) instrument (McCarty et al., 2021), additional Global Navigation Satellite System Radio Occultation (GNSS-RO) observations (Privé et al., 2022), the Geostationary eXtended Observations (GeoXO) hyperspectral infrared sounder (GXS) (McGrath-Spangler et al. (2022), McGrath-Spangler et al. (2024)), and spaceborne differential radar for measuring marine surface pressures (Privé et al., 2023b). The framework employs the Gridpoint Statistical Interpolation (GSI) data assimilation system (DAS) along with the Global Earth Observing System (GEOS) forecast model.
One of the advantages of the GMAO OSSE framework is a forecast sensitivity to observation impact (FSOI, Holdaway et al. (2014)) tool that uses a moist adjoint model to simultaneously estimate impacts for all ingested data types. By using the FSOI tool along with data-addition experiments in the OSSE the proposed new instruments can be placed into context with the rest of the global observing network. Another key benefit of OSSEs is that due to the availability of the Nature Run that acts as the “true” state of the atmosphere the analysis error and forecast errors can be explicitly calculated. This allows evaluation of observation impacts in ways that are not possible with real data where the true state of the atmosphere is unknown.
The format of this manuscript is as follows: the OSSE framework and simulation of the 0530 platform are described in Section 2. The results of experiments introducing the 0530 instruments into the future observing scenario are then given in Section 3 and these are discussed further in Section 4.
2 OSSE Framework
The GMAO OSSE framework consists of several components: the Nature Run, the simulated or “synthetic” observations, and the NWP model and DAS that are used to perform the experiments. These components and the calibration and validation of the OSSE are described in detail by Errico et al. (2013), Errico et al. (2017), El Akkraoui et al. (2023), and Privé et al. (2023a). A brief overview of the OSSE framework will be given here.
2.1 Nature Run
The Nature Run used for this version of the GMAO OSSE is the GEOS-5 Nature Run, commonly referred to as the G5NR. This Nature Run is a two year long free forecast using a version of the GEOS model similar to that used for the MERRA-2 reanalysis (Putman, 2014). The spatial resolution of the G5NR is C1440 on the cube-sphere which is approximately 7 km horizontal resolution, with 72 vertical levels and 30 minute temporal output.
The G5NR has been extensively validated (Gelaro et al., 2014) to evaluate the realism of the model forecast. The overall performance of the NR is good, with some differences in climatology compared to the real world that have been identified. For example, there are some unrealistic polar stratospheric clouds located over the winter pole. These differences from reality are taken into account as much as possible when generating the simulated observations and interpreting the OSSE results.
2.2 Forecast Model
A version of the GEOS model that was quasi-operational in 2022–2023 (version 5.29.4, Rienecker et al. (2008)) was used as the forecast model for these experiments. The resolution of the GEOS model was C360 (25 km) in the horizontal with 72 vertical levels. This model has substantially different physics and dynamics from the version of GEOS used to generate the G5NR including updated advection schemes, boundary layer and land model physics, new convective and radiative schemes, and different damping schemes. Privé et al. (2023a) illustrated the improved performance of this version of the GEOS model in the OSSE framework due to these differences with the Nature Run as insufficient model error is a common problem in OSSEs that affects many aspects of OSSE performance.
The hybrid 4-dimensional ensemble variational (4DEnVar) GSI is used for data assimilation. This version of the GSI was also in quasi-operational use at the GMAO in 2022–2023. The ensemble size for the DAS is 32 members and this version of GSI employs an incremental analysis update (IAU) scheme.
2.3 Synthetic Observations
A “future” global observing network scenario is used as the basis for these experiments. In this scenario the main orbital platforms are NOAA-20, MetOp-B, and a ring of three geostationary platforms with hyperspectral infrared sounders (GEO IRS). While two platforms are most often used in the same LEO orbit for redundancy, the use of single platforms represents a minimum acceptable scenario. Additional remote sensing instrument platforms include GMI GPM, AMSR2 GCOM W1, and SSMIS F17. Conventional data types include atmospheric motion vectors (AMVs), rawinsondes, aircraft, surface types, and GNSS-RO. AMVs are from the Himawari, Meteosat, and GOES geostationary platforms as well as polar MODIS data. Radio occultations are simulated for MetOp-A,-B, and -C, TerraSar-X, TanDEM-X, KOMPSAT-5, and COSMIC-2 (E1, E2, E4, E5, and E6) with approximately 6000 soundings per day. The Future Control case includes these data types but omits the 0530 orbit. A full list of the observation types included in the future global network cases is given in Table 2.
Table 2
Simulated observing platforms for the future global observing network experiments.
| INSTRUMENT | PLATFORM | FUTURE CONTROL | CrIS-ONLY | ATMS-ONLY | CrIS+ATMS |
|---|---|---|---|---|---|
| AMSR2 | GCOM W1 | X | X | X | X |
| AMSU-A | METOP-B | X | X | X | X |
| ATMS | NOAA-20 | X | X | X | X |
| ATMS | 0530 | X | X | ||
| CrIS-FSR | NOAA-20 | X | X | X | X |
| CrIS-FSR | 0530 | X | X | ||
| GEO IRS | GeoXO | X | X | X | X |
| GEO IRS | MTG | X | X | X | X |
| GEO IRS | Himawari | X | X | X | X |
| GMI | GPM | X | X | X | X |
| IASI | METOP-B | X | X | X | X |
| MHS | METOP-B | X | X | X | X |
| SSMIS | F17 | X | X | X | X |
| Surface conventional | X | X | X | X | |
| AMV | X | X | X | X | |
| Aircraft | X | X | X | X | |
| Scatterometer | X | X | X | X | |
| RAOB | X | X | X | X | |
| GNSS-RO | X | X | X | X |
For those observing types that are currently in operational use the synthetic observations were based on archived real observations from June–September 2020 as described fully in Errico et al. (2013), Errico et al. (2017), and Privé et al. (2023a). Spatiotemporal locations for data types aside from AMVs were based on the locations of real observations with cloud contamination of clear-sky types determined by the location of clouds and precipitation in the NR using probabilistic methods (Errico et al., 2020). For infrared clear-sky radiance types, probabilistic functions based on the fraction of low, medium, and high altitude clouds were used to determine if a thick cloud affects each radiance observation. If so, the cloud-top temperature was assigned to be the same as the atmospheric temperature at the same elevation and the CRTM was informed that the effective radiative surface occurred at the cloud-top level. The goal of this was to effect the removal of infrared radiances in areas of dense clouds by the quality control of the DAS so as to result in statistically similar quantities of ingested infrared observations. The effects of thin clouds on infrared radiances were accommodated by the addition of simulated observation errors. For clear-sky microwave radiance types contamination by precipitation is handled similarly, using probabilistic functions with the NR precipitation fields for stratiform, convective, and anvil clouds. All-sky microwave observations were simulated for MHS, AMSR-2, and GMI using the NR cloud and moisture fields. For radiance observations the Community Radiative Transfer Model (CRTM, Han et al. (2006); Ding et al. (2011)) version 2.2.3 was used to generate radiances from profiles taken from the G5NR.
The synthetic observations were calibrated to match characteristics of the corresponding real observations. Simulated observation errors were applied to the synthetic observations with partially correlated errors applied to different data types so that the observation correlations matched the correlations of real data (Errico et al. (2013), Errico et al. (2017)). The probability thresholds used to determine cloud contamination for radiances were adjusted to match the counts of ingested simulated observations to that of real observations for each channel or level. The magnitude of simulated observation errors was adjusted so that the standard deviations of observation innovation (O-B) for the ingested simulated observations matched that of real observations. While most data types were calibrated in a bulk global fashion GNSS-RO had observation errors that were latitude-based in magnitude (Privé et al., 2022). These simulated errors were intended to compensate for the lack of sufficient representativeness error, operator error, instrument error, and also slight cloud contamination for radiances. A fraction of the total error added to the simulated observations was set to be correlated with the remainder being uncorrelated. Horizontally correlated errors were added to AMSU-A, ATMS, MHS, SSMIS, AMVs; vertically correlated errors were added to rawinsondes, GNSS-RO, and AMVs, and channel correlated errors were added to AIRS, IASI, and CrIS-FSR. Simulated biases were not added to the simulated observations but the GSI bias correction was allowed to act normally. A multi-week spinup period was implemented during calibration for spinup of the radiance bias coefficients.
The GEO IRS observations were simulated as described by McGrath-Spangler et al. (2022) and McGrath-Spangler et al. (2024). The three GEO IRS platforms had subpoints at 0°, 105°W, and 140°E with 53 temperature sounding channels and 15 water vapor channels assimilated by the DAS. The channel selection used the MTG-S IRS as a baseline with a triangular spectral response function. Hourly full-disk GEO IRS observations were simulated with cloud contamination tuned to the same probabilistic settings as IASI. Simulated observation errors were not added to the synthetic GEO IRS observations but testing has indicated that the standard deviation of the intrinsic representativeness error of the simulated GEO IRS observations ranges from approximately 0.25 K in the upper troposphere to 1–2 K for mid and lower tropospheric levels.
2.4 Calibration
A validation run (“Real”) was performed ingesting the real observations from 2020 into the same version of the GEOS and GSI in order to provide the target statistics for calibration. A 2020 Control OSSE case was run using the simulated 2020 observing network for validation. The resulting calibration and validation of this version of the GMAO OSSE framework is described in full by Privé et al. (2023a).
FSOI estimates of observation impact for the 2020 Control, Future Control, and Real cases are shown in Figure 3. For the Real case, FSOI is calculated using self-analysis for verification while the OSSE Control cases use the NR for verification which results in a small difference in the impacts but generally does not change the relative ranking of data types (Privé and Errico, 2019). In general, observation impacts in the OSSE tend to be weaker than for real observations due to insufficient model error in the OSSE framework, resulting in less work available for the observations to perform. However, the relative ranking of data types is well represented overall. In the 2020 Control case ATMS ranks relatively high in terms of impact but is slightly underweighted in terms of ranking overall. CrIS-FSR has weaker impacts than ATMS but is accurately ranked in the OSSE. AMVs are overweighted in the OSSE while AMSU-A, AIRS, scatterometer winds, and rawinsondes have weaker relative rank than for Real.
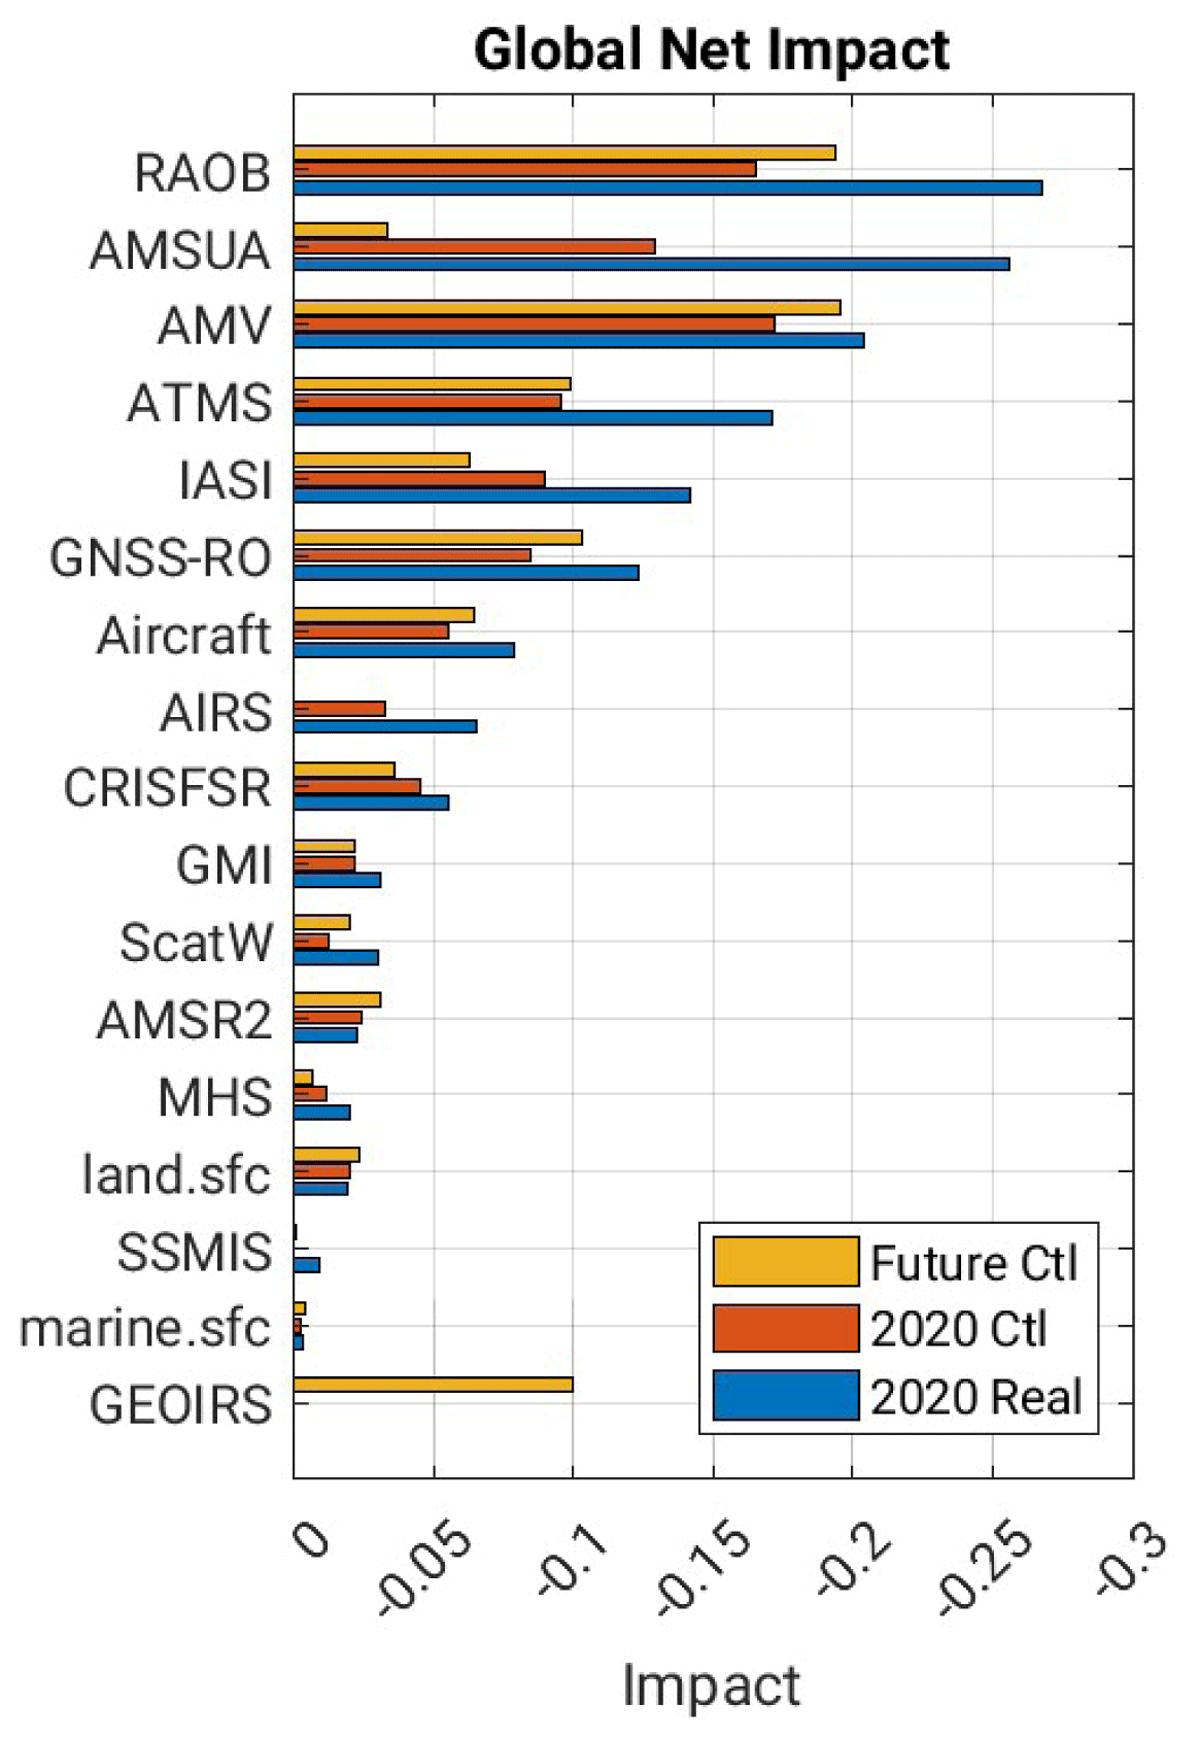
Figure 3
Comparison of FSOI estimates of observation impacts for the 2020 Control and Future Control in July compared to Real observations from 2020. 0000 UTC forecast cycle impacts on the 24-hour forecast of total wet energy error norm.
In the Future Control the GEO IRS has a moderately high ranking, comparable to GNSS-RO. The GEO IRS impacts in this study should be considered as the maximum possible limit for this configuration of the instruments with impacts likely to be somewhat reduced with the addition of observation errors. Despite the loss of one platform ATMS remains highly ranked, possibly compensating for the loss of most AMSU-A platforms. Some conventional observations such as rawinsondes, aircraft, and AMVs see a modest increase in impact in the Future Control compared to the 2020 Control along with GNSS-RO.
2.5 0530 Orbit Simulation
In order to simulate a new platform at 0530 the archived 2020 NPP orbit (1330 LTAN) for ATMS and CrIS-FSR was temporally shifted by eight hours when generating the observations. The cloud thinning and simulated error parameters used to calibrate the CrIS-FSR NPP and ATMS NOAA-20 simulated observations were used for simulations of the 0530 observations. These platforms were chosen because they showed the best calibration compared to real data in prior validation of the 2020 OSSE framework. Channel correlated errors were added to the CrIS-FSR observations and horizontally correlated errors were added to the ATMS observations. Both CrIS-FSR and ATMS were assimilated for clear-sky only in accordance with the use of real observations in this version of the DAS. Simple geometric thinning was used with thinning box sizes of 145 km for ATMS and 180 km for CrIS-FSR.
Figure 4 shows calibration of CrIS-FSR and ATMS data on the 0530 orbit compared to the Real validation case. CrIS-FSR has relatively good matching of ingested observation counts in the lower troposphere but lower counts in the upper levels (channels 1–50) and some mismatches in counts in mid-troposphere. The deficiency in counts for stratospheric channels is possibly due to the pre-thinning methods used for simulated data (Errico et al., 2017). ATMS has somewhat lower counts of ingested observations than Real which is thought to be due in part to difficulties in simulating the super-obbing methods used with real ATMS data. The ATMS ingested observation counts for the 0530 orbit are slightly lower than the ATMS-NOAA20 counts which could reflect differing cloud coverage at the respective overpass times. Both CrIS-FSR and ATMS have relatively close matching of observation innovation statistics.
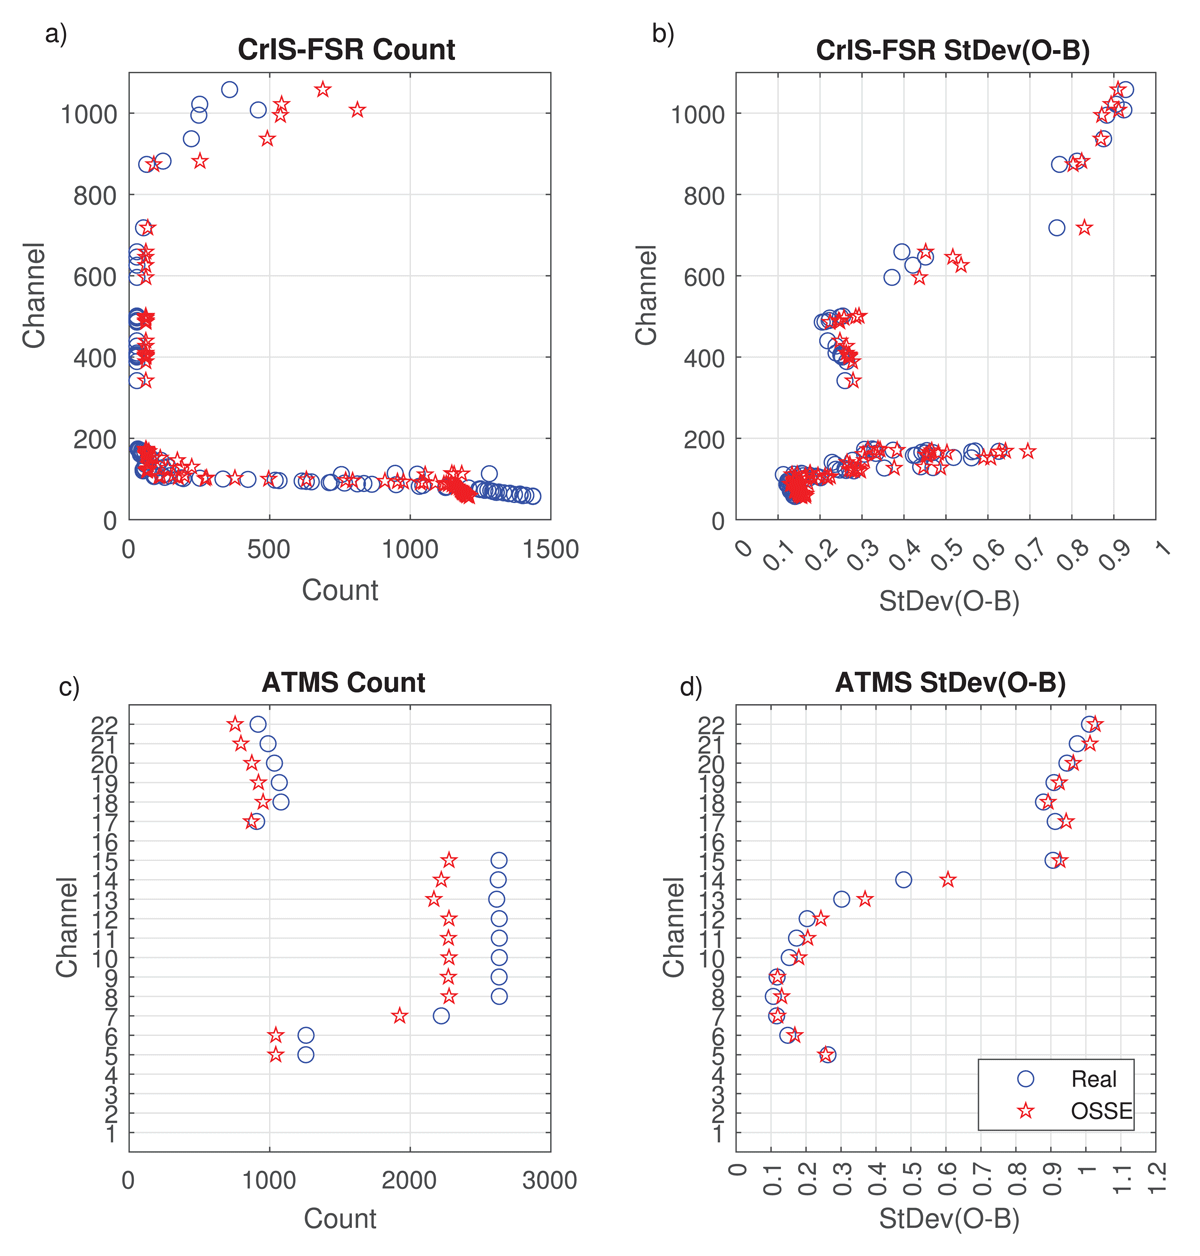
Figure 4
Calibration of simulated 0530 orbit CrIS-FSR and ATMS observations compared to real data. Blue circles, real data; red stars, simulated observations. One month of four times daily statistics of observation ingestion in the CrIS+ATMS case for July compared to the Real validation run using 2020 real data. a,b) CrIS-FSR NPP Real versus 0530 CrIS-FSR; c,d) Real ATMS NOAA-20 versus 0530 ATMS. a,c) Mean count of ingested observations per cycle time. b,d) Standard deviation of observation innovation (O-B).
2.6 Experiment Setup
Four experiment cases were performed, each for a three-month period from July to September. The cases were initialized on 1 July after a spinup period in June for the OSSE framework during which the satellite bias coefficients and the background state were allowed to adjust. The full ensemble for the hybrid 4DEnVar was not run for each experiment but was instead taken from a prior OSSE run for the same time period of the G5NR (Privé et al., 2023a). Once-daily extended forecasts were performed, initialized at 0000 UTC, and extended for a 7-day forecast.
The four experiments consist of the Future Control case which did not include a 0530 orbit platform, the CrIS-Only case in which CrIS-FSR on the 0530 orbit was included in addition to the Future Control observation network, the ATMS-Only case in which ATMS on the 0530 orbit was included in addition to Future Control, and the CrIS+ATMS case in which both CrIS-FSR and ATMS on the 0530 orbit were included in addition to Future Control. The observations used are shown in Table 2 for all four cases.
3 Results
Analysis and forecast impacts are calculated by comparing the error of the Future Control run to the error of each of the three experiments with added 0530 orbit instruments. The analysis and forecast errors are calculated using the Nature Run regridded to the same resolution as the experiment model for verification.
3.1 Analysis Impacts
Analysis impacts are calculated using the root-temporal-mean-square analysis errors (RTMSE), using four times daily analysis states at 0000, 0600, 1200, and 1800 UTC. In order to put the impacts into context with the magnitude of the Future Control analysis errors the impacts are normalized by the RTMSE for the Future Control (RTMSEControl):
where RTMSEN is the normalized analysis error impact for a particular experiment case with non-normalized RTMSEExp. Therefore a normalized analysis impact of –0.01 corresponds to a 1% reduction in the analysis error compared to the Future Control analysis error.
Figure 5 compares the zonal mean normalized analysis temperature impact versus Future Control of the 0530 orbit platform instruments for the three experiments. The largest beneficial (blue) temperature impacts are seen for the CrIS+ATMS case with impact magnitudes of greater than 5% in some regions such as near the south pole and the upper equatorial troposphere. There is a small region of degradation (orange) near the surface over Antarctica; note that the vertical axis is in native model η level equivalent pressure which is surface-following. Modest beneficial impacts on the order of 0.5–2% are found throughout most of the troposphere.
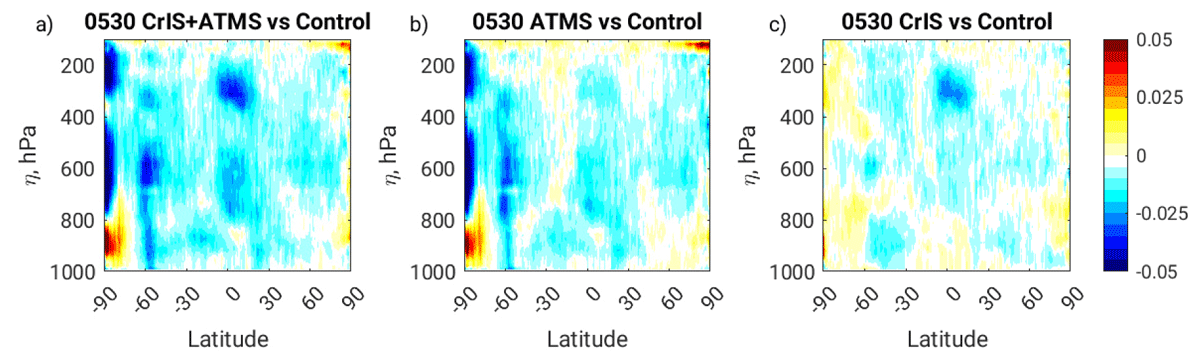
Figure 5
Fractional change to zonal mean temperature analysis RMSE compared to Future Control, July–Sept. Ordinate in model η level equivalent pressure. a) CrIS+ATMS case; b) ATMS-Only case; c) CrIS-Only case.
Comparing Figures 5b and 5c, the ATMS 0530 instrument has overall greater beneficial impacts than CrIS-FSR, especially in the southern hemisphere extratropics. However, CrIS-FSR has a more strongly beneficial impact in the tropical upper troposphere. CrIS-FSR is not assimilated over land or sea ice regions which contributes to the weaker impacts compared to ATMS especially near the south pole as there are minimal CrIS-FSR observations ingested poleward of 60°S.
The specific humidity analysis impacts are shown in Figure 6 with beneficial impacts due to the addition of the 0530 platform except for in the lower stratosphere. ATMS shows the greatest impacts in the lower troposphere and in the southern hemisphere extratropics while CrIS-FSR has the largest beneficial impacts in the upper tropical troposphere and the lower troposphere. The pattern of humidity impacts is somewhat similar to that seen with temperature impacts with the exception of better humidity impacts from ATMS in the boundary layer and degradation in the lower stratosphere. Stratospheric degradation of humidity fields is commonly seen in the GEOS/GSI system from the addition of any new data in the real world, indicating that this may be a feature of the forecast system and not particular to the 0530 ATMS and CrIS-FSR.
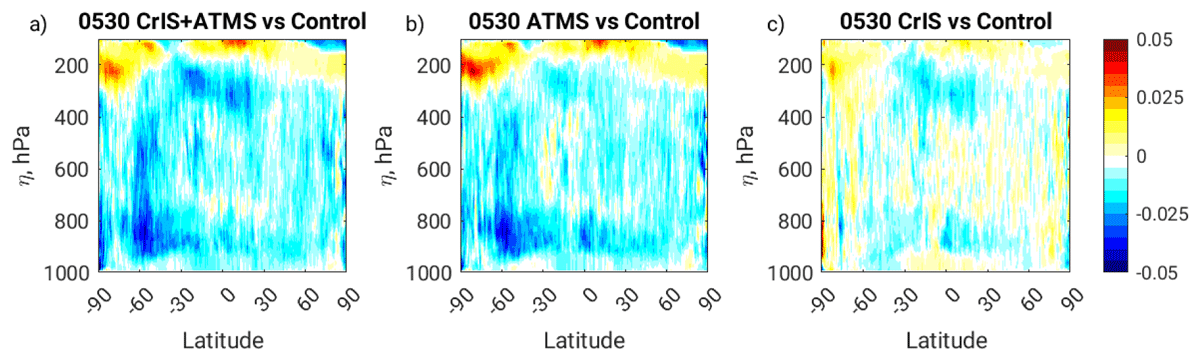
Figure 6
Fractional change to zonal mean specific humidity analysis RMSE compared to Future Control, July–Sept. Ordinate in model η level equivalent pressure. a) CrIS+ATMS case; b) ATMS-Only case; c) CrIS-Only case.
Zonal wind analysis impacts are shown in Figure 7. For ATMS the wind impacts are similar to those seen for temperature, with greatest impacts in the southern hemisphere extratropics. However for CrIS-FSR the zonal wind field does not have the local maximum in beneficial impact in the upper tropical troposphere seen for temperature and humidity. Wind is not directly observed by radiance instruments so wind increments are determined by the covariances employed by the DAS. Near the equator the wind and temperature fields are decoupled so the beneficial temperature impacts for CrIS in this region do not translate directly to wind impacts.
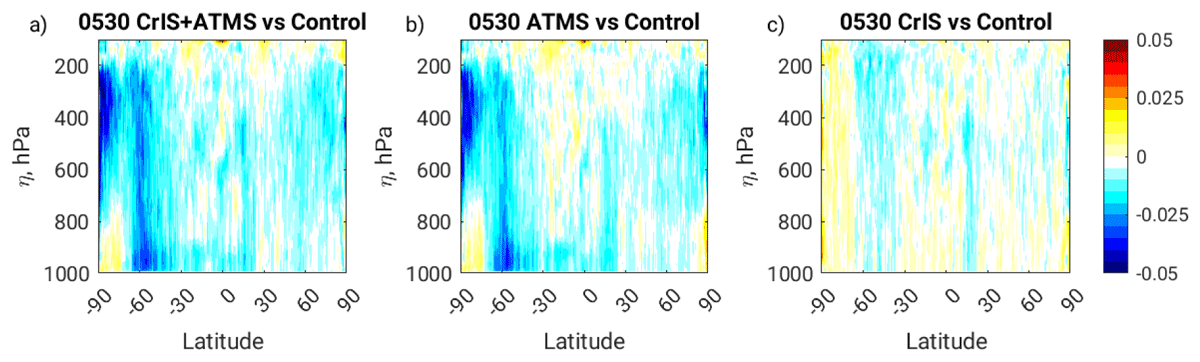
Figure 7
Fractional change to zonal mean zonal wind analysis RMSE compared to Future Control, July–Sept. Ordinate in model η level equivalent pressure. a) CrIS+ATMS case; b) ATMS-Only case; c) CrIS-Only case.
In order to evaluate the redundancy of the CrIS-FSR and ATMS observations on the 0530 platform the impacts of the CrIS-Only and ATMS-Only cases can be compared to the CrIS+ATMS case. While it is not expected that observations with completely orthogonal information content would necessarily have purely additive impacts this comparison can give an estimation of the degree to which the observations are complementary. Figure 8 shows the global mean RMS analysis error impacts for each of the three experiment cases compared to Control as well as the sum of impacts in the CrIS-Only (dashed line) and ATMS-Only cases (dotted line). Comparing the CrIS+ATMS case (heavy solid line) to the sum of impacts in the CrIS-Only and ATMS-Only cases (dot-dashed line) the CrIS+ATMS case impacts are in general only slightly weaker than the sum of the individual instrument impacts, implying that redundancy of the two instruments is small. However, humidity below 750 hPa shows much greater impacts from the sum of individual instruments with ATMS-Only impacts actually more beneficial than in the CrIS+ATMS case. This is possibly due to over-weighting of CrIS-FSR water vapor sensitive channels along with undiagnosed error correlations between CrIS-FSR channels.
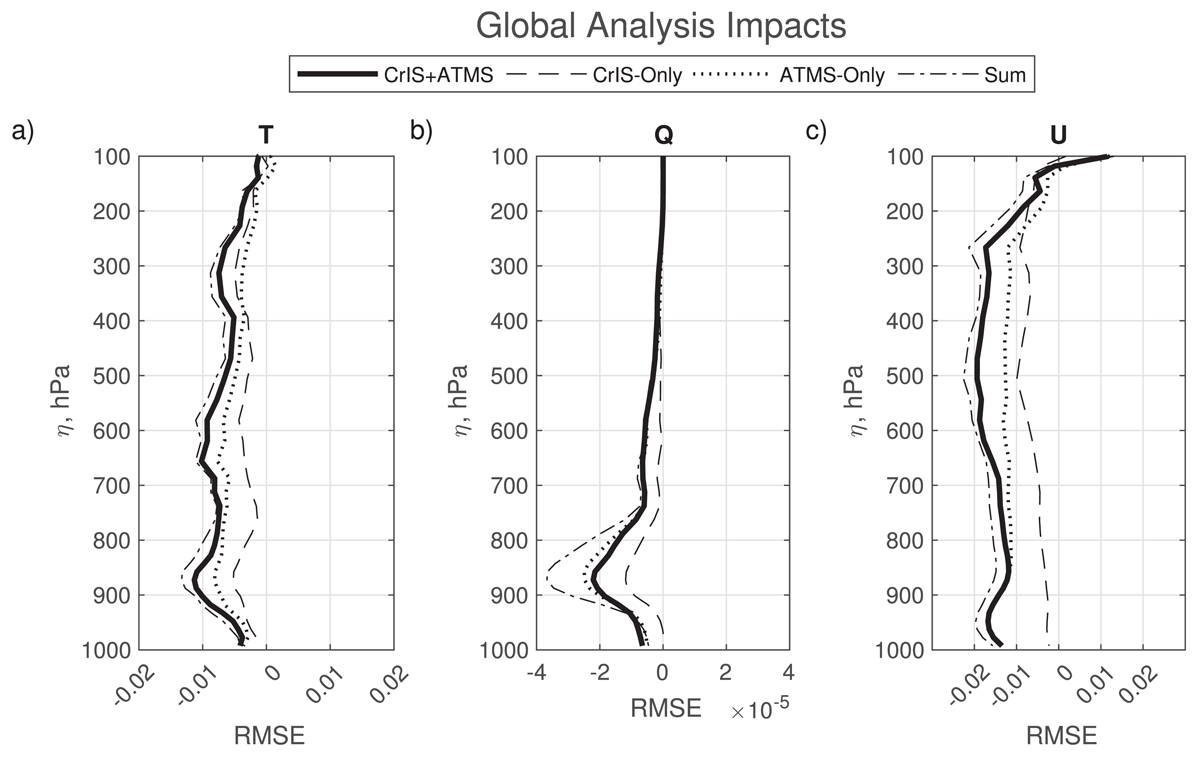
Figure 8
Difference in globally averaged temperature analysis RMSE compared to Future Control, July–Sept. Ordinate in model η level equivalent pressure. Heavy solid line, CrIS+ATMS; dashed line, CrIS-Only; dotted line, ATMS-Only; dot-dash line, sum of CrIS-Only and ATMS-Only. a) temperature, K; b) specific humidity, kgkg–1; c) zonal wind, ms–2.
In order to investigate the effects of filling in a gap in the LEO constellation a smaller region that is only intermittently overpassed by LEO platforms in the Future Control can be examined. Of particular interest is the conterminous United States region (CONUS), here defined for purposes of calculation as a box between 130°W and 65°W, and 25°N and 50°N, indicated by the black box in Figure 2. The 0530 orbit directly overpasses the CONUS region during the 0000 UTC and 1200 UTC cycle times, clips a corner of the CONUS region during the 0600 UTC cycle, and does not cross over the bounding box during the 1800 UTC cycle.
Figure 9 compares the time mean fractional analysis impacts calculated over the CONUS region for the four different cycle times using root-areal-mean-square forecast error (RAMSE) instead of the RTMSE in order to allow for significance testing over multiple forecasts. Levels with statistically significant differences at the 90% level are indicated with heavy line segments. While it might be expected that the analysis impacts would have the greatest magnitudes during the 0000 (black solid line) and 1200 UTC (blue dot-dash line) cycles when there is a direct overpass, with near zero impacts at other times, this is not the case. In the lower troposphere the impacts for all four cycle times are clustered, showing largest beneficial impacts near 900 hPa and 700 hPa for temperature and humidity including for the 1800 UTC cycle time during which no data from the 0530 orbit is ingested in this region. The mid troposphere shows less clustering although the humidity field near 300 hPa shows a peak in beneficial impact at all cycle times. This result implies that some of the information from the overpass times at 0000 and 1200 UTC is retained to the 0600 and 1800 UTC cycles.
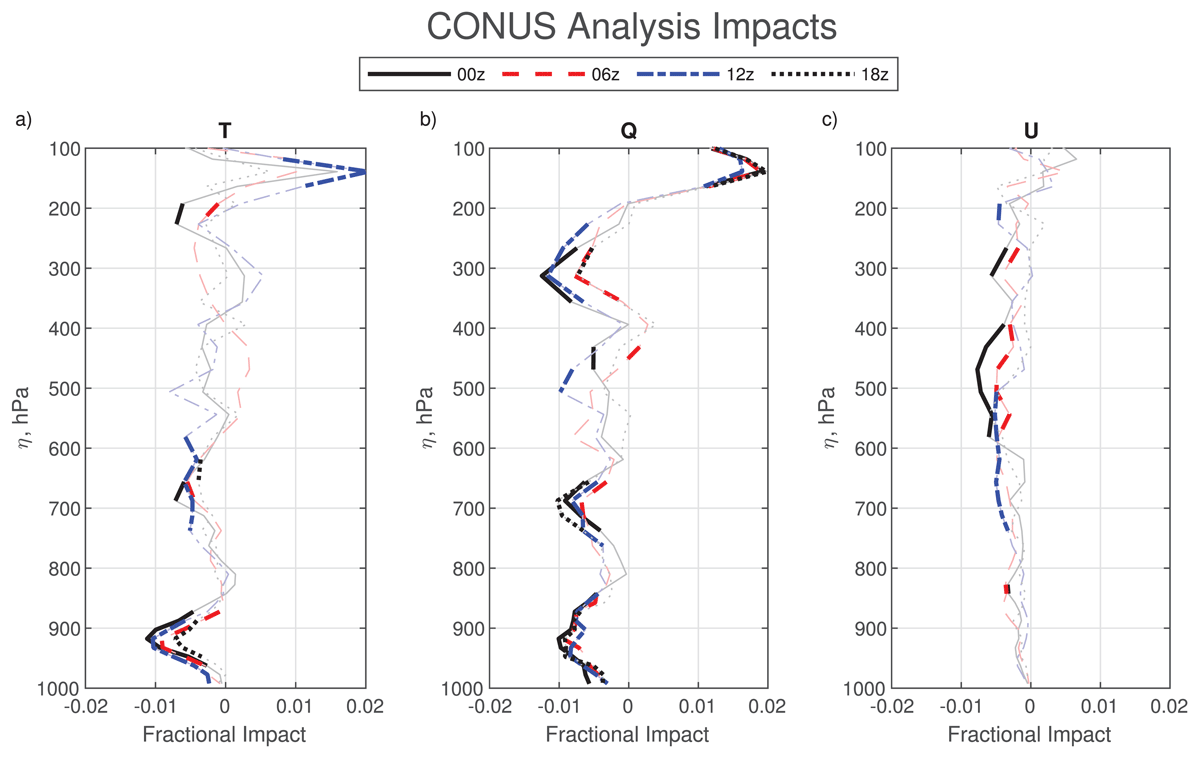
Figure 9
Fractional difference in globally averaged temperature analysis RMSE compared to Future Control over the CONUS region, July–Sept. Ordinate in model η level equivalent pressure. Heavy lines indicate significance at the 90% level. Solid black line, 0000 UTC cycle; dashed red line, 0600 UTC cycle, dash-dot blue line, 1200 UTC cycle; dotted black line, 1800 UTC cycle. a) temperature; b) specific humidity; c) zonal wind.
3.2 Forecast Impacts
Extended forecasts were generated once daily, initialized at 0000 UTC and integrated for seven days. Regional forecast impacts were calculated for three different regions: 20°N–90°N (NHEX), 20°S–90°S (SHEX), and 20°S–20°N (Tropics). Normalized forecast impacts were calculated similar to the analysis impacts using the NR fields regridded to the same resolution as the forecast for verification. However, for the calculation of fractional forecast impacts the RAMSE was used in order to determine statistical significance. The calculation for normalized forecast error for each region at each forecast time is the same as for Equation 1 but replacing RTMSE with RAMSE. Significance testing was performed using the Student’s t test at the 90% level and accounting for temporal autocorrelation of forecasts (Wilks, 2011).
Figure 10 shows normalized temperature forecast impacts for the three cases in each of the three regions with negative values indicating a reduction in forecast error when the 0530 orbit was included compared to Future Control. The largest beneficial impacts are seen in the SHEX region with improvements of 1–2% extending out to the seven day forecast – these improvements are largely due to observations from the ATMS instrument. This finding of larger, more durable forecast improvements in the SHEX region has been common to previous studies with the same OSSE framework (Privé et al., 2022, 2023b) and is thought to be due to the combination of the sparsity of in situ observations and the strongly baroclinic nature of error growth in the winter hemisphere extratropics.
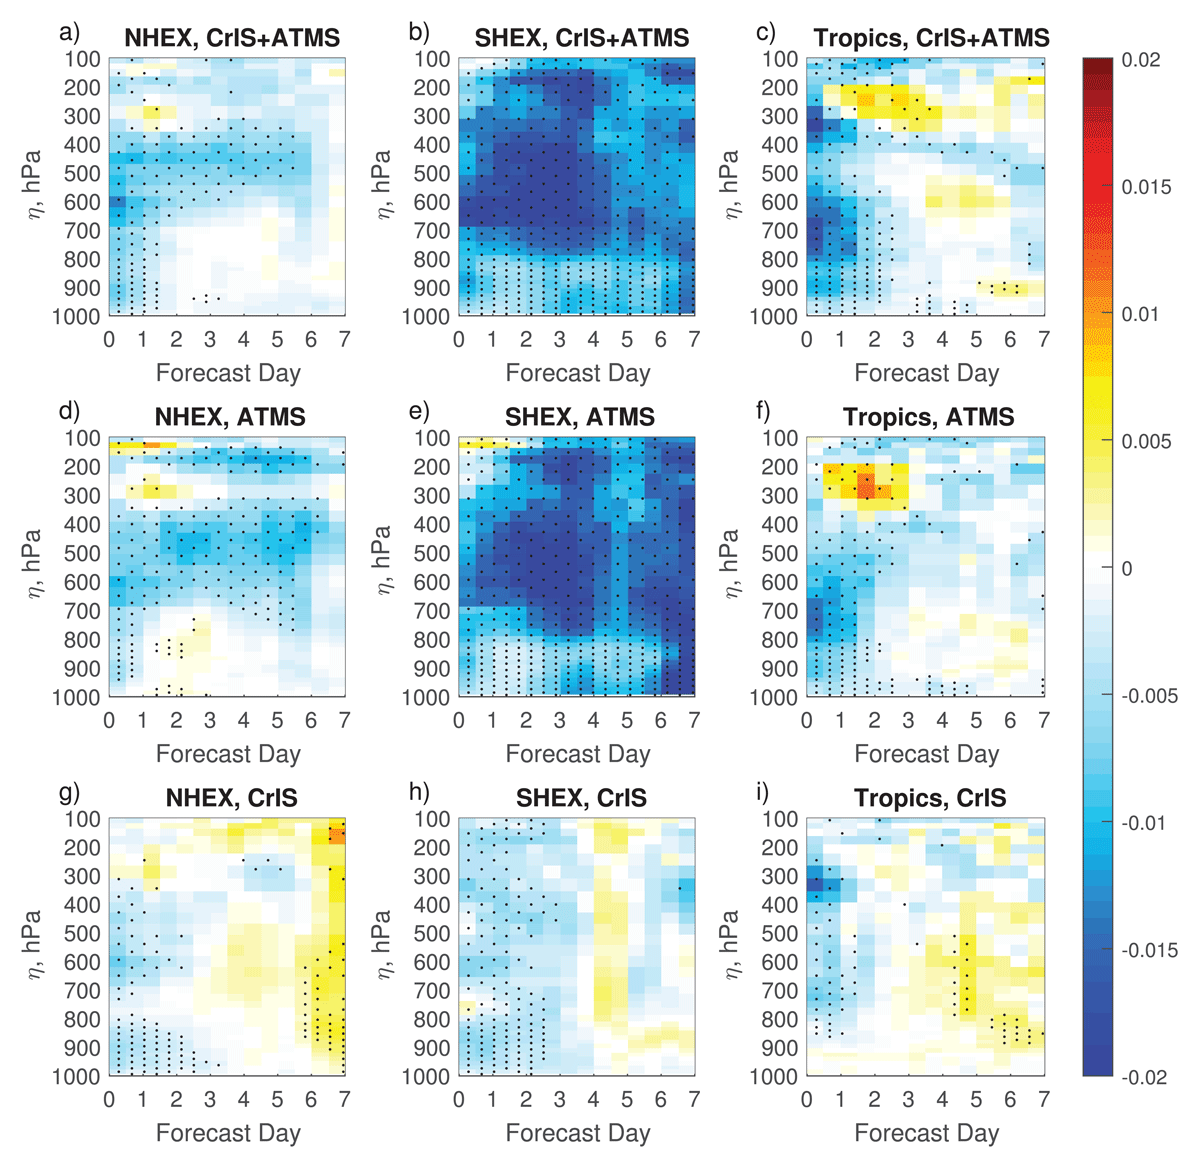
Figure 10
Fractional difference in regionally averaged temperature forecast RTMSE compared to and normalized by the Future Control RTMSE, July–Sept. Negative values indicate a reduction in forecast error compared to control. Stippling indicates 90% statistical significance. Ordinate in model η level equivalent pressure. a,b,c) CrIS+ATMS case; d,e,f) ATMS-Only case; g,h,i) CrIS-Only Case. a,d,g) NHEX region; b,e,h) SHEX region; c,f,i) Tropics region.
Forecast improvements are weaker and of shorter duration in the NHEX region and Tropics although there is some improvement in the mid-troposphere temperature of the NHEX region out to six days. While there are initially substantial improvements in the Tropics region for both ATMS and CrIS-FSR these improvements only persist for one to two days into the forecast and some areas of forecast degradation are observed beginning with the 12-hour forecast period. Both the Tropics and summer NHEX region have weak baroclinic dynamics while convection plays a strong role resulting in error growth that has a short timescale with a substantial component of model error growth. In this convective regime improvements to the initial forecast are quickly overwhelmed by fast-acting physics processes in the model. In highly convective regions a model feedback can occur in which even neutral changes to the analysis state set off deep convection, and leading to a delayed model response in which heating and cooling at different vertical levels can induce a bias in the temperature field in the 12hr to mid-range forecast period as seen near 200–300 hPa in the Tropics region and to a lesser degree in the NHEX region. This has been observed for other instrument types in previous OSSEs.
Specific humidity forecast impacts are shown in Figure 11 and overall these impacts persist for longer duration into the forecast period than the temperature impacts. For the CrIS+ATMS and ATMS-Only cases humidity improvements are statistically significant out to day seven in all three regions while for the CrIS-Only case improvements are seen to day three in the extratropics and day four to five in the Tropics. Both the humidity bias and error variance are improved into the medium range (not shown) with somewhat stronger improvements to the error variance compared to the bias. Improvements of up to 1% are seen overall while some larger improvements of 2% are found in the upper and lower troposphere of the short term forecast. The different forecast response for humidity compared to temperatures implies that the additional information ingested from water vapor channels augments the improvements to the humidity fields that result merely from covariance with the temperature fields. The humidity field is also not affected by convective feedback processes in the same way seen for temperatures in the Tropics and summer hemisphere.
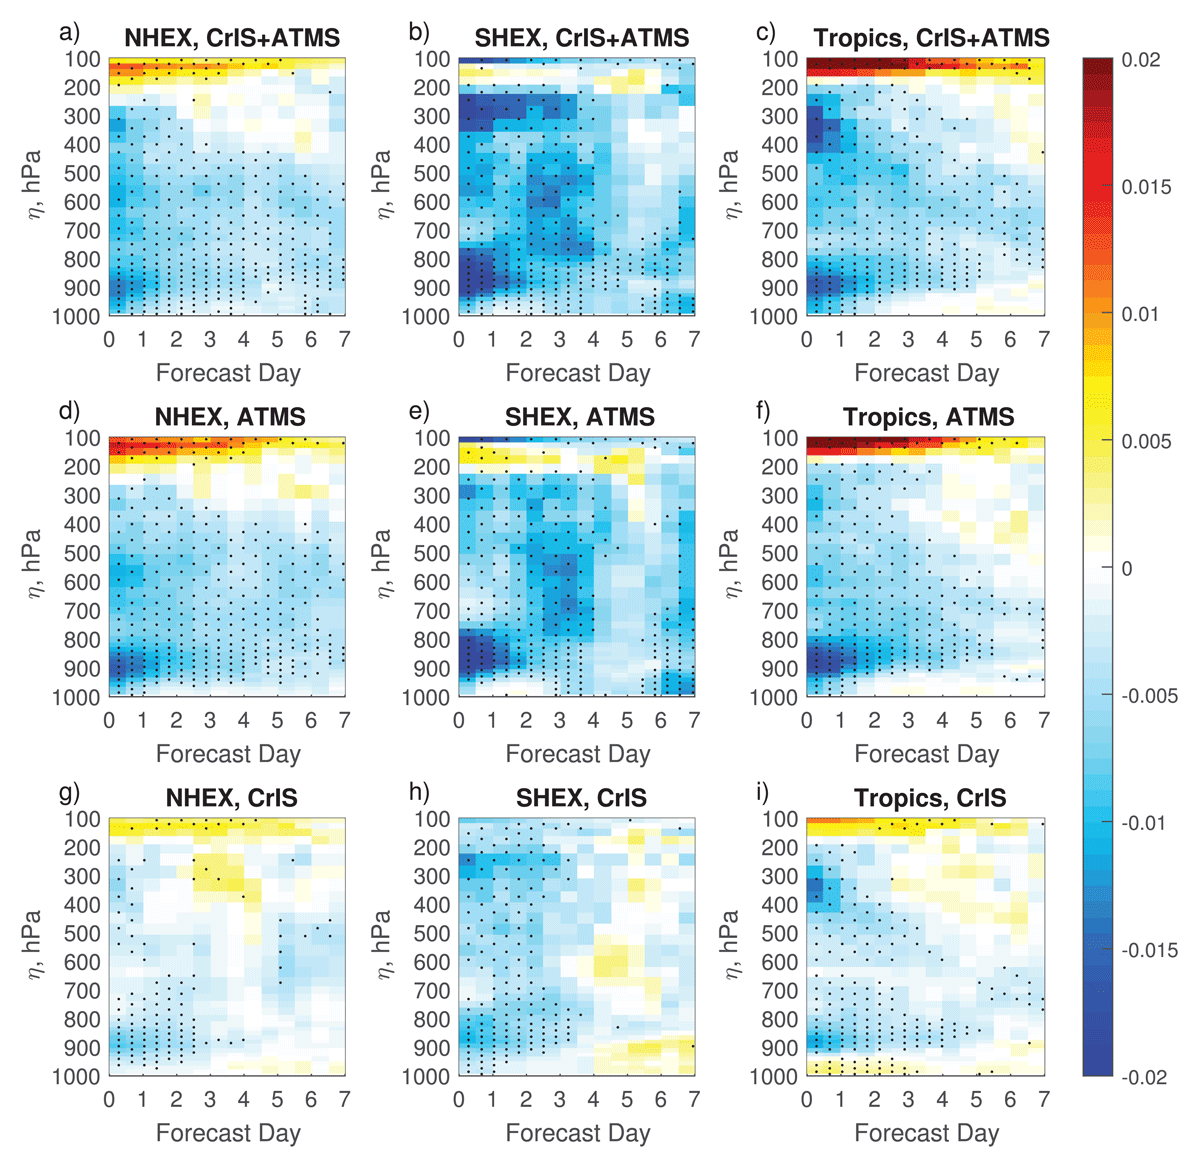
Figure 11
Fractional difference in regionally averaged specific humidity forecast RTMSE compared to and normalized by the Future Control RTMSE, July–Sept. Negative values indicate a reduction in forecast error compared to control. Stippling indicates 90% statistical significance. Ordinate in model η level equivalent pressure. a,b,c) CrIS+ATMS case; d,e,f) ATMS-Only case; g,h,i) CrIS-Only Case. a,d,g) NHEX regiona; b,e,h) SHEX region; c,f,i) Tropics region.
Figure 12 shows zonal wind forecast impacts as in Figures 10 and 11. Impacts are very similar for the CrIS+ATMS and ATMS-Only cases with improvements of up to 1% in the NHEX and Tropics regions and impacts up to 2% in the SHEX region, persisting for 4–7 days. The delayed degradations at some vertical levels in the Tropics and NHEX seen for temperatures are not observed for the wind field. For CrIS-Only improvements are weaker and more short-lived, lasting 2–3 days in all three regions.
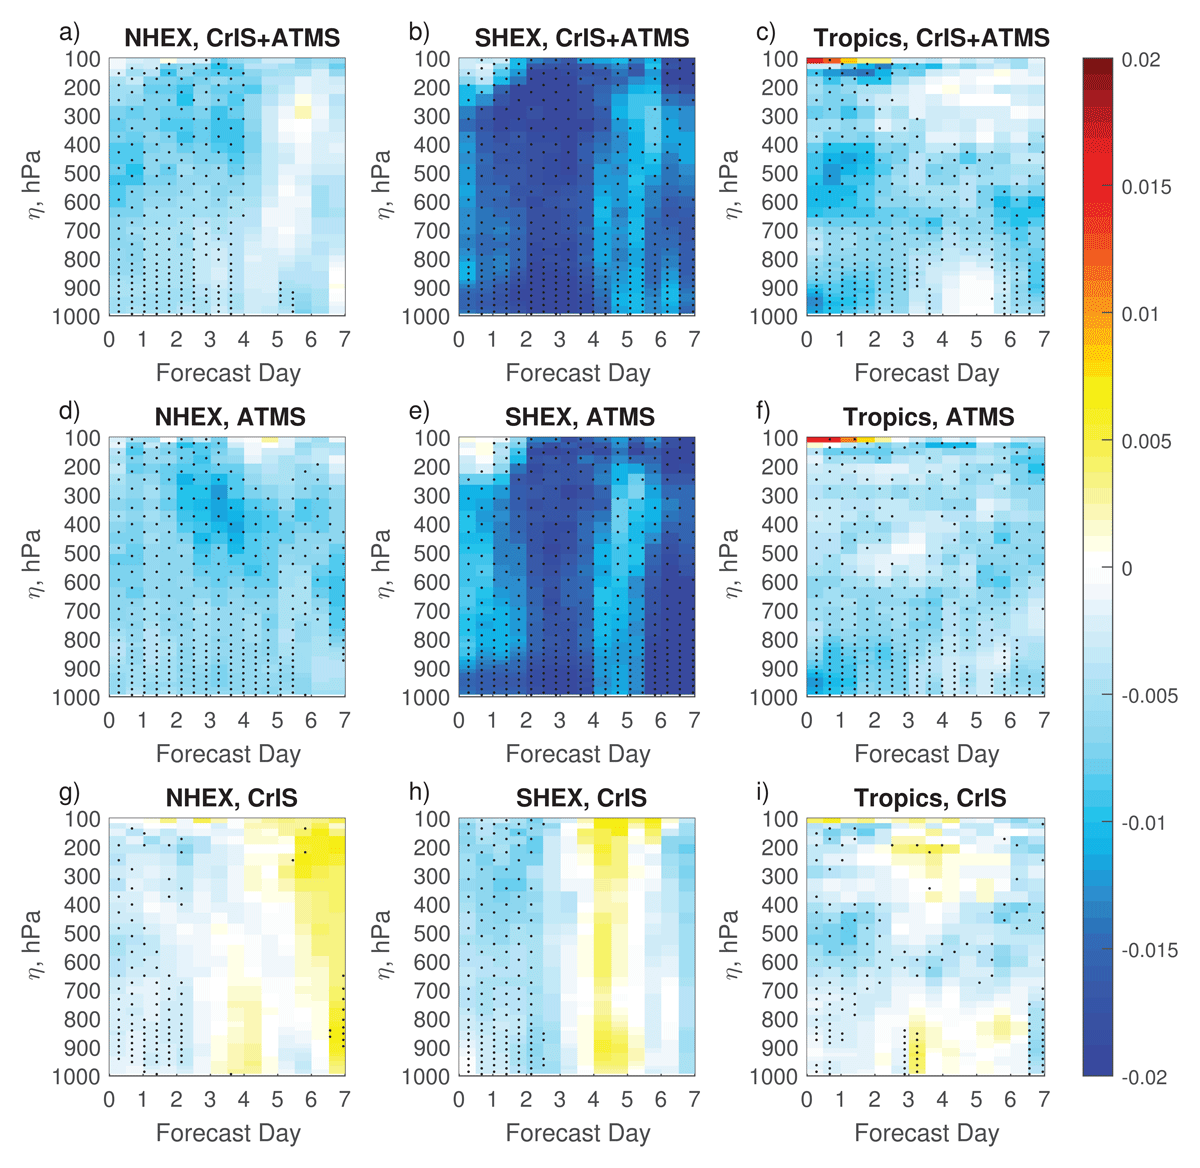
Figure 12
Fractional difference in regionally averaged zonal wind forecast RTMSE compared to and normalized by the Future Control RTMSE, July–Sept. Negative values indicate a reduction in forecast error compared to control. Ordinate in model η level equivalent pressure. Stippling indicates 90% statistical significance. a,b,c) CrIS+ATMS case; d,e,f) ATMS-Only case; g,h,i) CrIS-Only Case. a,d,g) NHEX region; b,e,h) SHEX region; c,f,i) Tropics region.
3.3 Forecast Sensitivity Observation Impact
FSOI uses a linearized, or adjoint, version of the NWP model to provide estimates of the observation impact for all ingested data types on a single metric of forecast error. Because nonlinear terms are neglected FSOI is generally used for forecast errors at 48 hour or shorter time windows. In these experiments a moist adjoint that includes convective processes is used (Holdaway et al., 2014) with the 24-hour forecast of total wet energy error as the forecast error norm, using the Nature Run for verification when calculating errors. Previous studies have shown that at this forecast time length the FSOI captures approximately 75% of the total nonlinear observation impact (Privé et al., 2020) when the Nature Run is used for verification. FSOI is calculated four times daily, at each cycle time.
FSOI produces complementary information to the data-addition tests previously presented. While data-addition shows the impacts of select observations on all aspects of the analysis and forecast states FSOI estimates the impact of all observation types used simultaneously on a single metric – the 24 hour forecast of total wet energy error. Previous work has shown that data denial experiments and FSOI yield roughly similar impact rankings for each observation type (Gelaro and Zhu, 2009). However, FSOI is sensitive to the optimality of the observation errors assumed by the DAS (Eyre, 2024) and may not accurately reflect observation impacts if the assumed errors are smaller in magnitude than the actual observation errors. FSOI can also be subject to numerical instabilities of the linearized model. For any cycle times where instabilities of the FSOI tool were suspected the FSOI results were excluded from calculations for all data types but these instabilities can be more difficult to identify in regional evaluation of FSOI. These limitations should be noted when considering the following FSOI analysis, particularly for regional and channel results.
Figure 13 shows the mean net observation impact for the three regions calculated per cycle time for the three month experiment period in the CrIS+ATMS case where negative values indicate a reduction in the forecast error due to the observations. In the NHEX region where there is substantial landmass surface coverage and extensive commercial aircraft routes it is seen that rawinsondes (RAOB), aircraft, and atmospheric motion vectors (AMVs) are the most impactful data types. ATMS NOAA-20 is the most beneficial radiance data type with the ATMS 0530 having a somewhat weaker impact. CrIS-FSR ranks between AMSU-A and AMSR2 with less overall impact, in line with the findings from the analysis and forecast impacts discussed previously and with the impacts of these data types in the 2020-based observing network.
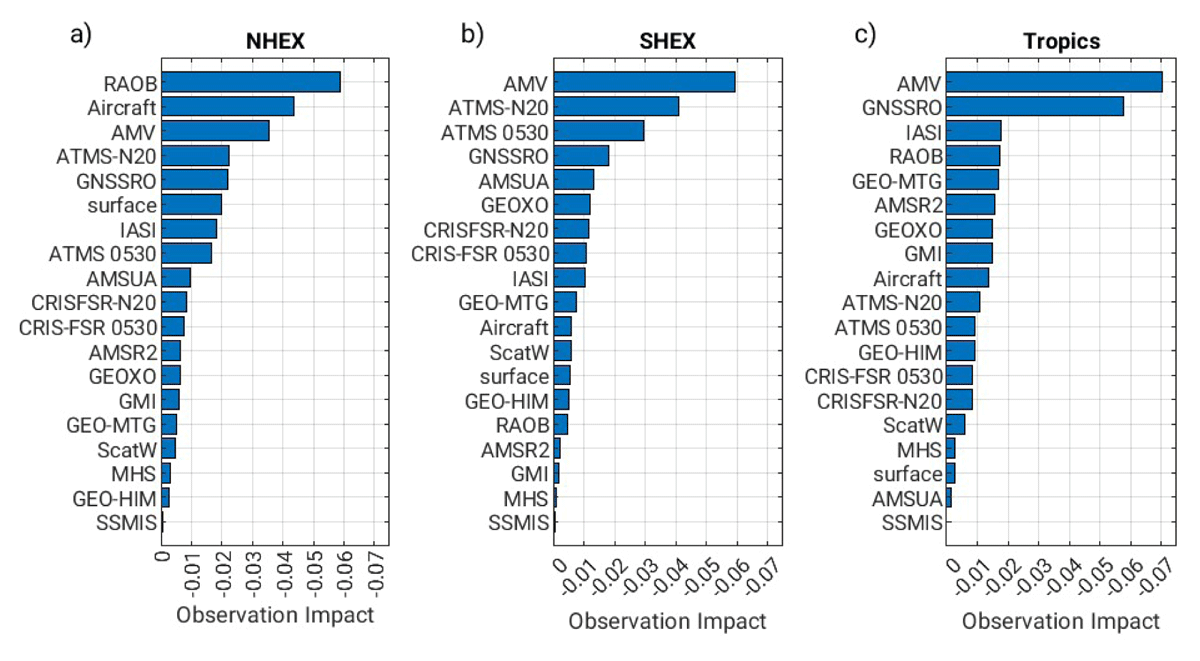
Figure 13
Four times daily forecast sensitivity observation impact for the CrIS+ATMS case using a 24-hour total wet energy error norm. July–September cycle mean net impact. Negative values indicate a reduction in forecast error, i.e. beneficial impact.
In the SHEX region where there are few rawinsondes and aircraft ATMS impacts are second only to AMVs with the ATMS NOAA-20 providing greater impacts than the ATMS 0530. CrIS-FSR instruments have impacts similar to IASI and the GeoXO platform located near the Americas. In the Tropics AMVs and GNSS-RO bending angle observations have by far the greatest observation impacts. ATMS and CrIS-FSR have similar impacts in the Tropics. Differences in the impact of similar instruments on different orbits, such as ATMS on the 0530 orbit compared to the NOAA-20 orbit, are believed to be due to variations in both the background errors related to the diurnal cycle and to the presence of other observation types when an orbit passes over a region where sensitivities may be larger or smaller.
FSOI provides granular information about impacts down to the level of individual observations. The global per-channel impacts of the ATMS and CrIS-FSR data on the 0530 orbit are shown in Figure 14. The per-channel impacts for ATMS and CrIS-FSR on NOAA20 (not shown) are quite similar to those for the same instruments on the 0530 platform. For ATMS, the largest impacts are seen for channels 5–9 which are tropospheric temperature channels. Somewhat weaker beneficial impacts are found for channels 17–20 which are water vapor sensitive channels. The CrIS-FSR per-channel FSOI also has the most beneficial impacts for tropospheric temperature channels. Several water vapor sensitive ATMS and CrIS channels have a positive FSOI indicating degradation rather than improvement. Channels 21–22 on ATMS show slightly positive FSOI while CrIS-FSR channels 152, 153, and 1008 (GSI index 117, 118, and 301, respectively) also show indications of degradation. While these values border on significance, given the suspect CrIS-FSR channels are sensitive below 700 hPa, it is suggestive along with reduced impact in water vapor for the ATMS+CrIS case shown Figure 8 that there may be sub-optimal implementation in the DAS regarding water vapor sensitive channels.
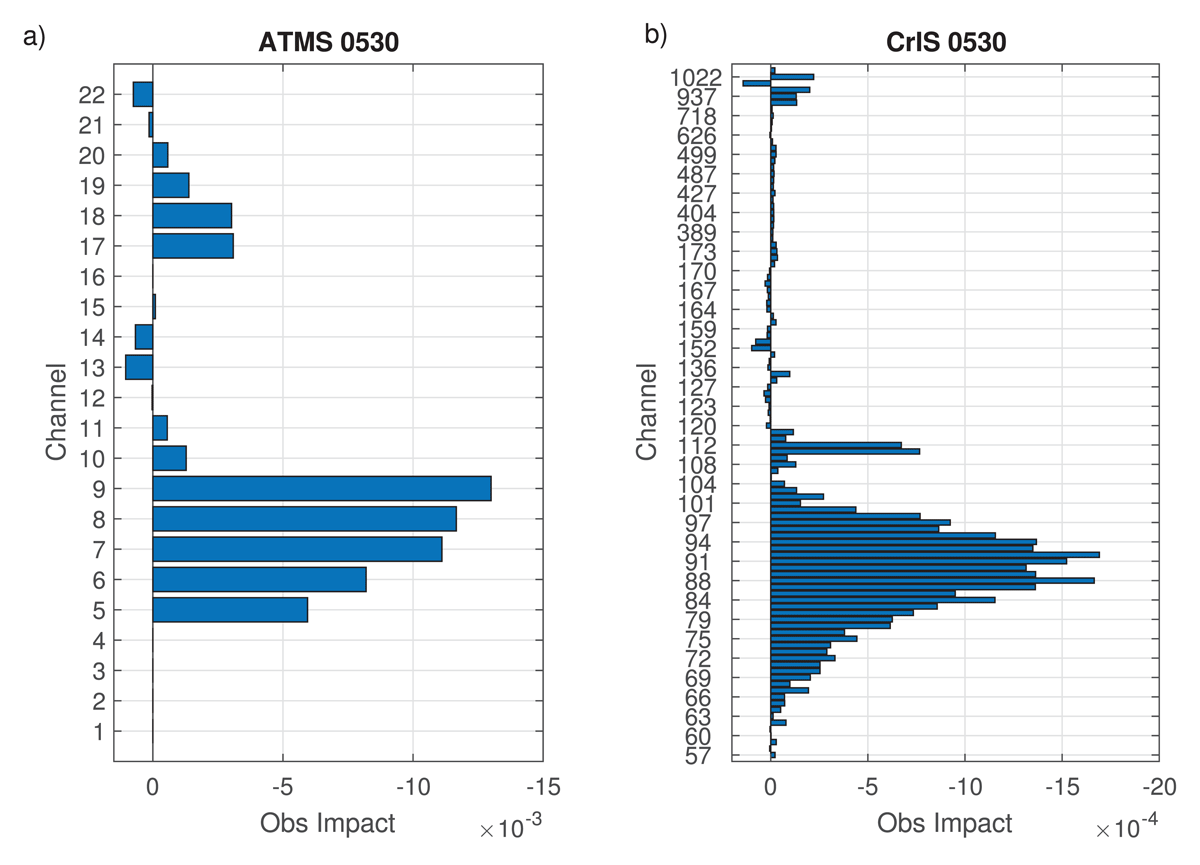
Figure 14
Four times daily forecast sensitivity observation impact per channel for the CrIS+ATMS case using a 24-hour total wet energy error norm. July–September cycle mean net impact. Negative values indicate a reduction in forecast error, i.e. beneficial impact. a) ATMS 0530 orbit; b) CrIS-FSR 0530 orbit.
The global FSOI impacts for the 0000 UTC cycle time are compared for the four cases in Figure 15. For the ATMS-Only and CrIS+ATMS cases the impact of ATMS-NOAA20 is substantially reduced due to the addition of the ATMS-0530 instrument. Other data types show a small weakening of impact when the 0530 instruments are included especially for the CrIS+ATMS case. This can be due to either or both redundancy between the observations or reduction in error growth due to the improved initial conditions.
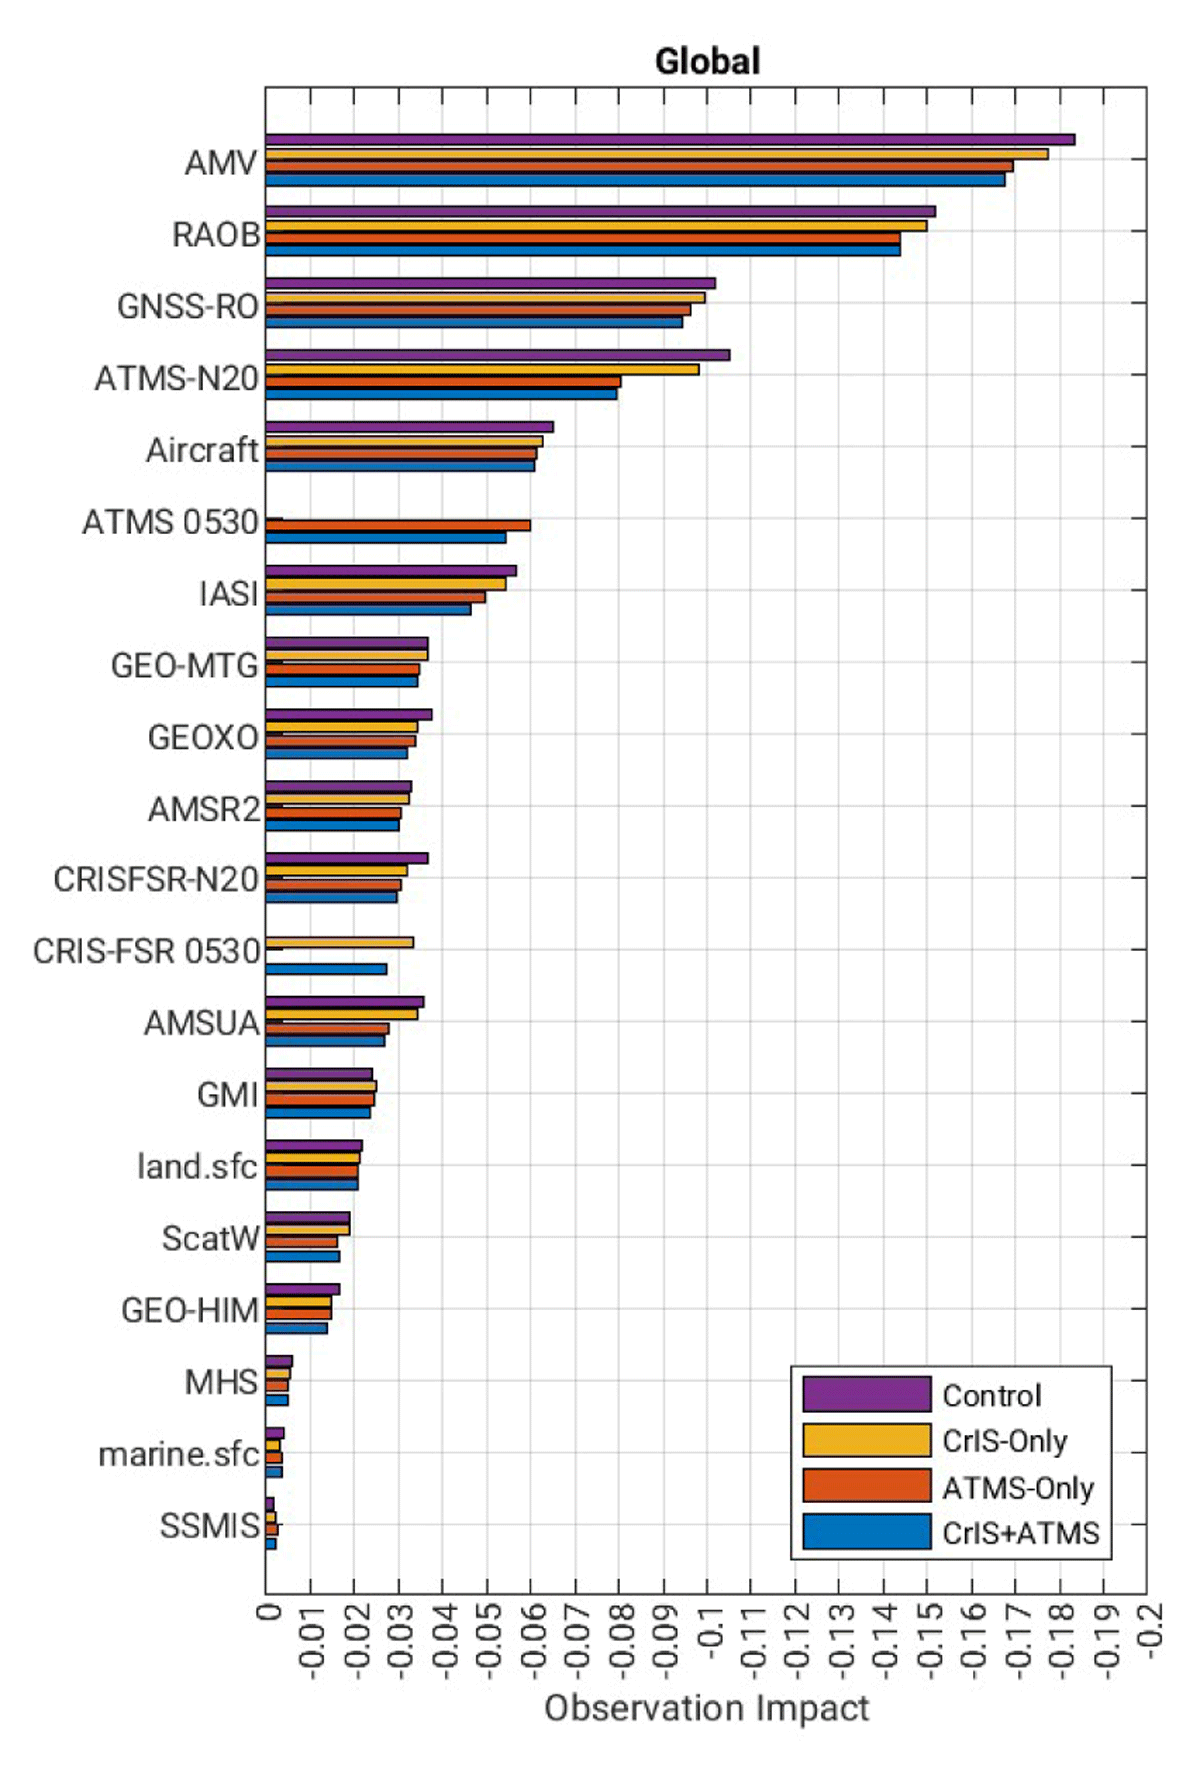
Figure 15
0000 UTC cycle forecast sensitivity observation impact using a 24-hour total wet energy error norm. July–September cycle mean net impact. Negative values indicate a reduction in forecast error, i.e. beneficial impact. Purple bars, Future Control case; yellow bars, CrIS-Only case; red bars, ATMS-Only case; blue bars, CrIS+ATMS case.
In order to understand short-term impacts over the CONUS region the FSOI is broken down by cycle time in Figure 16, along with the observation counts of ingested data types over the CONUS domain. There are strong temporal differences in the availability of some in situ observation types, in particular rawinsondes which are primarily launched at 0000 and 1200 UTC, and a diurnal cycle in aircraft data, with a minimum occurring for the 0600 UTC cycle. The 0530 orbit overpasses directly over CONUS during the 0000 and 1200 UTC cycles, coinciding with the release of rawindsondes. The NOAA-20 orbit overpasses during the 0600 and 1800 UTC cycles while the geostationary GeoXO platform provides similar observation quantities for all cycle times along with surface in situ observations. Note that the FSOI results only pertain to the 24-hour forecast impacts while longer lead times are likely to be affected by non-local upstream observations. It is also important to focus only on general findings and not analyze small differences too closely when examining more granular FSOI results over a smaller region such as this.
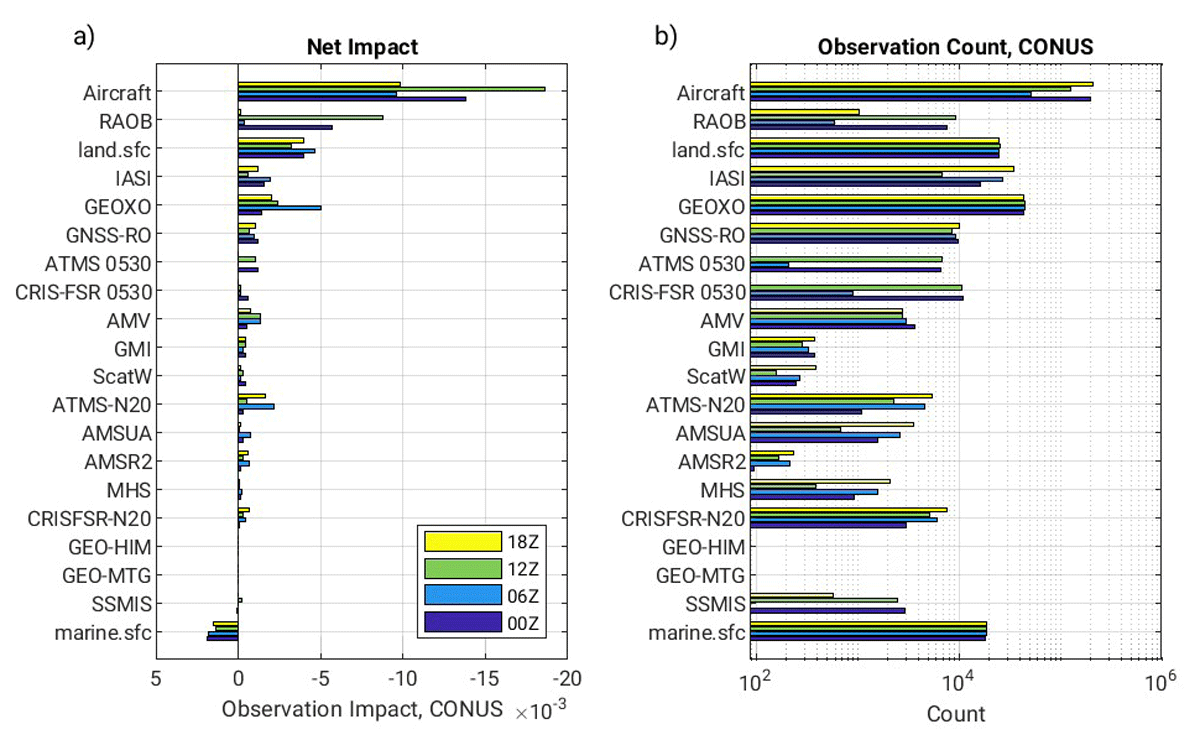
Figure 16
Comparison of forecast sensitivity observation impact over the CONUS region at different cycle times for the CrIS+ATMS case using a 24-hour total wet energy error norm. July–September cycle mean net impact. Negative values indicate a reduction in forecast error, i.e. beneficial impact. a) Net impacts; b) Observation counts (note semi-log).
The FSOI for GeoXO provides information on the relative impact of data as the atmospheric state and available observations change at each cycle time. The greatest impacts for GeoXO over CONUS occur at the 0600 UTC cycle when there are few rawinsondes and the smallest number of aircraft observations, although the NOAA-20 platform overpasses at this cycle. The weakest GeoXO impacts occur at the 0000 UTC cycle time when there are large quantities of rawinsondes and aircraft. Comparing the ATMS impacts for the 0530 orbit with the NOAA-20 orbit, the observation impacts peak for overpass cycle times of each instrument. However, the 0530 orbit overpasses coincide with the twice-daily rawinsonde release and also periods of high counts of aircraft observations while the NOAA-20 orbit coincides with the cycle times when there are few rawinsondes and when there is a lull in aircraft activity. This contributes to a larger overall impact for the NOAA-20 platform ATMS and CrIS compared to the same instruments on the 0530 orbit.
For comparison, FSOI for the region of Europe as defined by the red box in Figure 2 is shown in Figure 17. For the European region the main overpass times for the 0530 orbit are 0600 and 1800 UTC with partial coverage during the 0000 UTC cycle and minimal coverage for the 1200 UTC cycle. The largest impact for ATMS 0530 and CrIS-FSR 0530 occurs for the 1800 UTC cycle when observation counts are the highest, however, the second largest impact occurs for the 0000 UTC cycle even though the orbital coverage is only partial. This is likely due to the lack of aircraft observations for the 0000 UTC cycle time. The GEOIRS platform, GEO-MTG, only partially covers the Europe region and plays a weaker role than GeoXO plays over CONUS.
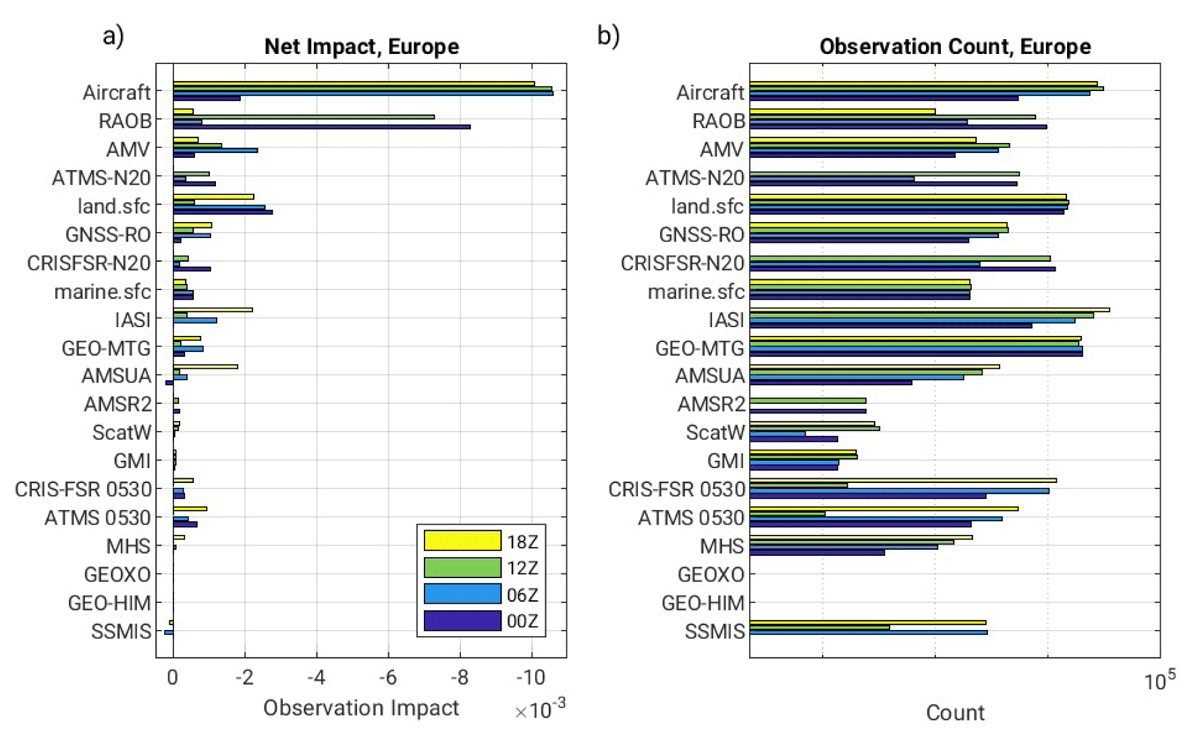
Figure 17
Comparison of forecast sensitivity observation impact over the Europe region at different cycle times for the CrIS+ATMS case using a 24-hour total wet energy error norm. July–September cycle mean net impact. Negative values indicate a reduction in forecast error, i.e. beneficial impact. a) Net impacts; b) Observation counts (note semi-log).
Figure 18 shows the accumulated FSOI for the ATMS and CrIS-FSR on the 0530 orbit over the entire three month forecast period, binned by location, as well as the mean count of ingested radiance observations per bin per cycle. The total accumulated FSOI for all other conventional and remote sensed data types aside from the 0530 orbit and associated observation counts are shown in Figure 18e and f for comparison. Regions of greater magnitude FSOI for the baseline set of observations may indicate a combination of both sensitivity of the forecast to observations as well as coverage by the global observing network. Continental areas that are well-observed by in situ observations, such as the CONUS, Europe, and Australia, may be less sensitive to any particular observation type due to the redundancy of the observing network.
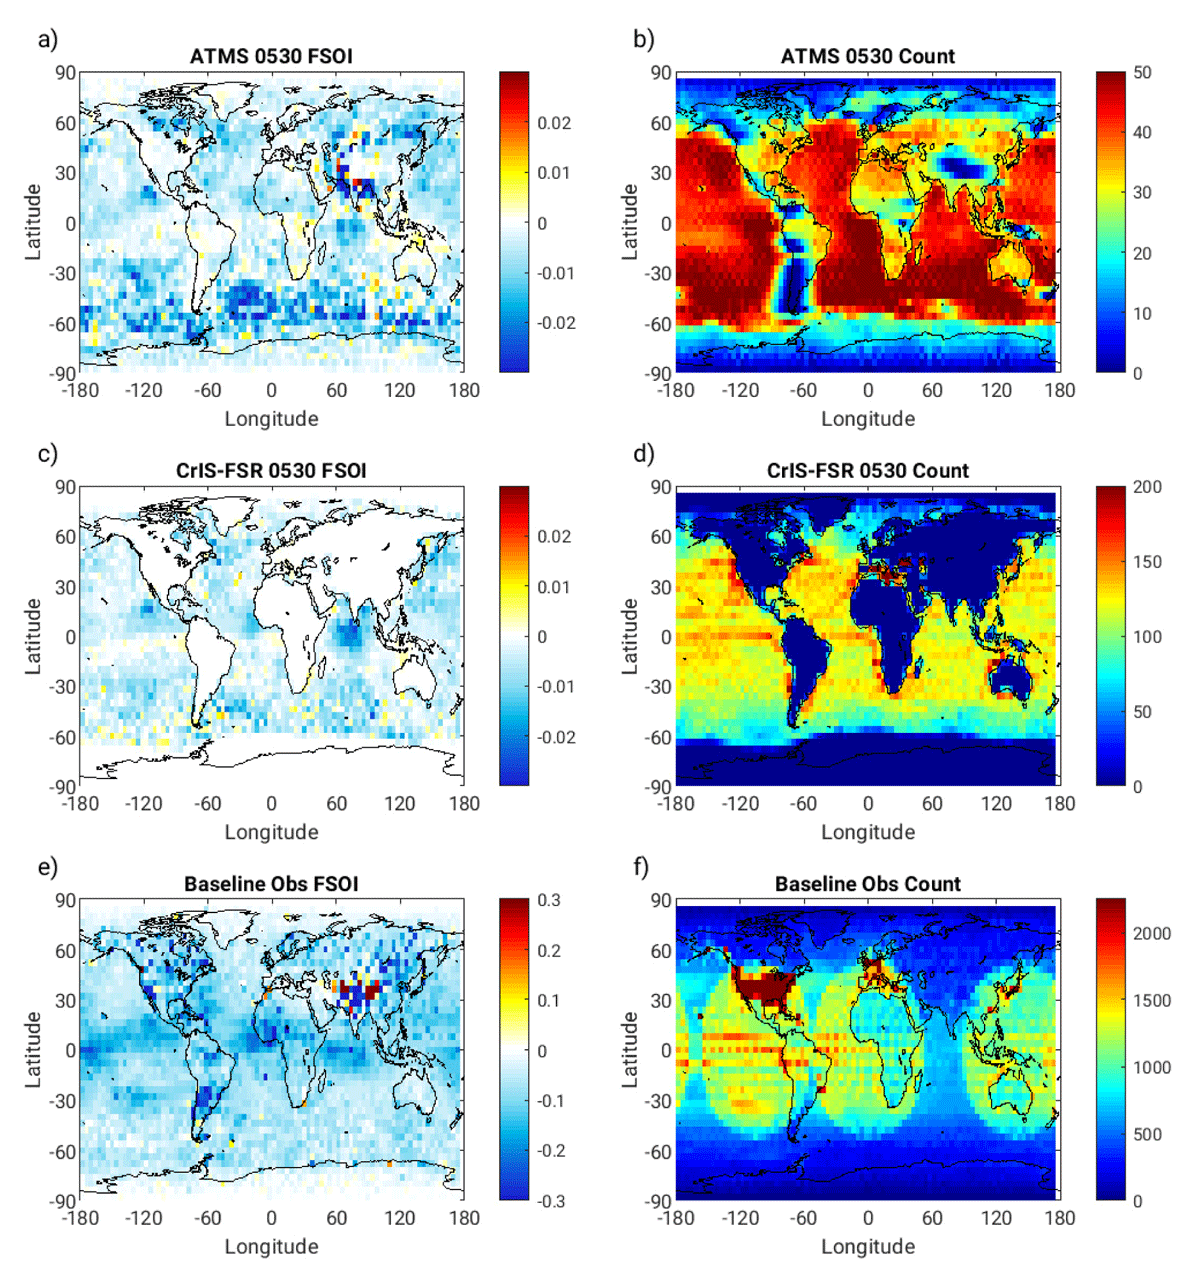
Figure 18
a,c,e) Sum of FSOI estimates of observation impact binned by location over the July–September period, 4 times daily FSOI data, CrIS+ATMS case. Negative values indicate a reduction in forecast error, i.e. beneficial impact. b,d,f) mean number of radiance observations ingested per cycle in bins of 4° latitude by 4° longitude. a,b) ATMS 0530 instrument; c,d) CrIS-FSR 0530 instrument; e,f) set of all conventional and remote sensed data types except for the 0530 platform.
In the tropics and subtropics both ATMS and CrIS-FSR on the 0530 platform have regional areas of enhanced FSOI impact that are similar to the distribution for the baseline observing network – the eastern Pacific off the coast of Mexico, the Atlantic off the coast of West Africa, and the Indian Ocean. The Indian Ocean feature is especially prominent for CrIS-FSR, with a somewhat weaker local extrema in this area for ATMS, and is strongest in July and August (not shown), hinting at possible relation to the Asian monsoon circulation. The Indian Ocean also falls into a gap between the GEO Ring of hyperspectral infrared sounders as can be inferred from Figure 18f. ATMS has stronger FSOI impacts in the Southern Ocean compared to most of the rest of the globe while for CrIS-FSR the FSOI extrema over the subtropical and tropical oceans are stronger than over the Southern Ocean. This difference between the two platforms is likely due to the reduced number of CrIS-FSR observations between 40–60S where IR observations are affected by clouds in active convective regions.
4 Discussion
The goal of this study was to evaluate the impact of adding a microwave radiance and a hyperspectral infrared radiance instrument onto a platform with an 0530 LTAN orbit given a future global observing network scenario. In this future scenario the number of low earth orbit platforms is fewer than in the current network and a global ring of geostationary hyperspectral infrared platforms provides partial coverage of the tropics. The 0530 orbit would fill a gap in the coverage of the LEO platforms in the future scenario. ATMS and CrIS-FSR were selected for the 0530 platform instruments and were tested both individually and in conjunction to determine their impacts.
The results of these experiments show that both ATMS and CrIS-FSR on an 0530 orbit would have beneficial impacts on a global scale. ATMS has larger impacts than CrIS overall due in part to the rejection of CrIS-FSR for assimilation over land. The implementation of CrIS-FSR in the real system is somewhat sub-optimal and the weak performance of real CrIS-FSR data in comparison to other hyperspectral IR instruments can be noted in Figure 3. The simulated characteristics of both ATMS and CrIS-FSR in the OSSE are based on the performance of these instruments in the current real world assimilation system so these challenges for real CrIS-FSR data are mimicked in the OSSE framework. As noted in Figure 3 the simulated CrIS-FSR impacts in the OSSE framework are well in line with real CrIS-FSR impacts but ATMS shows somewhat weaker impacts in the OSSE compared to the real world. This should be kept in mind when interpreting the OSSE results although the future global observing network used in these experiments differs significantly from the 2020-based framework used to calibrate and validate the OSSE framework (Privé et al., 2023b).
For ATMS, the largest beneficial impacts are seen in the southern hemisphere extratropics, a region where there are few in situ observations and where baroclinic processes in the winter hemisphere dominate the mid-range forecast period. In the tropics and northern hemisphere extratropics ATMS impacts are weaker due in part to the availability of in situ data but also due to the large role played by rapid error growth related to moist convection and minimal role of baroclinic processes. This finding of greater impacts in the SH extratropics is in line with results from some tests of the microwave sounders on FY-3E (Li et al., 2022; Xiao et al., 2023; Steele et al., 2023). Steele et al. (2023) also compared the impact of MWHS-II humidity channels on the FY-3E platform with the impact of MWHS-I humidity channels on the FY-3D platform (1340 LTAN) in a situation where other microwave satellites not on an 0930 or 1330 LTAN orbit were excluded. They found a larger impact for MWHS-II than for MWHS-I, particularly in the southern hemisphere extratropics, which was ascribed to the absence of other early morning orbit platforms, while FY-3D shares the early afternoon orbit with the ATMS instruments on NPP and NOAA-20. The impact for MWHS-II in this reduced microwave instrument scenario was also greater than that found when MWHS-II was added to the full current global observing network.
Unlike ATMS, the strongest CrIS-FSR impacts are seen in the equatorial region. In the southern hemisphere extratropics cloud contamination significantly reduces the number of ingested CrIS-FSR observations in the region where ATMS has a large impact. Liu et al. (2024) also found the largest impacts for HIRAS on FY-3E in the short-term forecast period to occur in the tropics.
As noted previously in the discussion of Figure 8 there is relatively little apparent redundancy between ATMS and CrIS-FSR on the 0530 platform. Although ATMS has greater global coverage over land and cloudy areas CrIS-FSR still has a substantial additional contribution to the observation impact in the presence of ATMS, especially for temperature and winds. CrIS-FSR is particularly impactful in the upper troposphere with a larger global contribution to analysis improvement than ATMS for temperatures above 350 hPa and for winds above 250 hPa. The combined impacts of CrIS-FSR and ATMS are generally equal to or less than the sum of their individual impacts in this data-addition case. If instead the impacts are calculated as data denial from the CrIS+ATMS case the sum of impacts of individually denying CrIS or ATMS (not shown) is generally 10–40% smaller than the impact of denying both. Bormann et al. (2019) performed data denial experiments in the ECMWF assimilation system in which all MW and/or all IR instruments were omitted. They found that the sum of individually derived MW and IR impacts was at least 50% smaller than the combined impact of all MW and IR instruments together at the early forecast period.
A regional rather than global evaluation is helpful to determine how the 0530 orbit helps to fill in gaps in the LEO constellation. A consideration of FSOI in the CONUS region found that the 0530 orbit platform had significant impacts on the 24-hour forecast error for the 0000 and 1200 UTC cycle times when there is a direct overpass of the platform but the impacts are weaker than for ATMS and CrIS-FSR on the NOAA-20 platform. The NOAA-20 platform overpasses at 0600 and 1800 UTC, when there are very few rawinsondes, plus the 0600 UTC cycle has the fewest aircraft observations which are highly impactful for the CONUS region. Because the 0530 orbit overpass coincides with the twice-daily rawinsonde launch cycle there is greater redundancy with in situ observations and thus weaker impacts compared to the NOAA-20 platforms. It was noted that the 0530 orbit impacts were retained into the 0600 and 1800 UTC analysis cycle by improving the quality of the background field at these cycle times.
The 0530 orbit crosses North America and Asia during the 0000 and 1200 UTC cycles and Europe, Africa, and Australia during the 0600 and 1800 UTC cycles. While rawinsondes are released globally primarily at 0000 and 1200 UTC aircraft activity is generally based on the local time with a minimum during the overnight hours. The impact of the LEO platforms is modulated by the cycle time of local overpass, and whether the overpass coincides with a minimum in rawinsonde, and particularly aircraft observations. Thus, the local impact of the 0530 orbit platform will depend on both the availability of in situ observational coverage and also, although to a lesser extent, whether the area is within the GEO-Ring footprint.
Interestingly, the observation impacts on specific humidity and zonal wind are retained more strongly into the mid-range forecast compared to temperature impacts, especially in the tropics and northern hemisphere. Temperature forecasts have been noted in previous OSSE studies to be affected by convective feedback that can cause delayed degradation of the temperature fields, particularly in two layers near 200 hPa and from 700–800 hPa, despite initial improvement of the temperature field during the early forecast. For example, this same behavior was found for an OSSE study of additional GNSS-RO profiles with a similar pattern of forecast degradation to that found here (Privé et al., 2023b). The cause of this feedback appears to be an atmospheric response of increased deep convection that peaks approximately 24 hours into the forecast period, resulting in heating and cooling of different layers of the atmosphere. Once the convective activity settles there is a slower response for the temperature field to readjust, resulting in the pattern of delayed forecast temperature degradation that persists into the medium range forecast. The humidity and wind fields are not as strongly affected by this convective response and a similar degradation of these fields is not observed.
This OSSE study is a speculative exercise and there are multiple unknowns that might affect the robustness of the results. First, the platforms on the 0530 LTAN orbit were modeled after the 2020-based ATMS and CrIS-FSR instruments but future instruments may differ in terms of channels, scans, or other characteristics. If the future instruments have worse or better performance than the 2020-based platforms the observation impacts might be weaker or stronger, respectively. The simulated ATMS observations have some deficiencies in representation of the super-obbing that affect the count of ingested observations and also the observation impacts. There are several known issues with the CrIS-FSR GSI implementation including a quality control decision that unnecessarily reduces the number of assimilated surface channels and additionally, as seen in this study, there may be some sub-optimal usage of water vapor channels. Contamination by thin clouds or light precipitation of simulated infrared and microwave observations in the OSSE framework is treated in a simplified, bulk fashion in the OSSE framework where these effects are not co-located with the NR cloud or precipitation fields. More realistic treatment of cloud contamination may affect observation impacts. Second, the future global network was represented by a reduced set of the 2020 LEO platforms plus the three-satellite GEO-ring. However, the future observing network may differ from this scenario – for example, it is reasonable to expect that there might be considerably more GNSS-RO observations from commercial sources and other smallsat platforms that are not simulated in this OSSE. Even so, this study helps to place a potential 0530 orbit platform into context with anticipated changes to the future global observing network.
Data Accessibility Statement
The full GEOS-5 Nature Run Global Modeling and Assimilation Office, NASA (2014) is available for download from a portal at https://gmao.gsfc.nasa.gov/global_mesoscale/7km-G5NR/.
The codes used to generate simulated observations are available on zenodo at https://doi.org/10.5281/zenodo.11387384.
The GEOS/GSI version used for the experiment runs is available on zenodo at https://doi.org/10.5281/zenodo.11387002.
Acknowledgements
The authors would like to thank Ron Errico (retired) for his longstanding efforts in developing the GMAO OSSE framework and most recently in implementing the simulated all-sky observation types used in this manuscript. Resources supporting this work were provided by the NASA High-End Computing (HEC) Program through the NASA Center for Climate Simulation (NCCS) at GSFC. The software for simulating GNSS-RO observations was provided by the Radio Occultation Processing Package (ROPP) of the Radio Occultation Meteorology (ROM) Satellite Applications Facility (SAF) of EUMETSAT with the assistance of Sean Healy at ECMWF. We would also like to thank the two anonymous reviewers who provided comments leading to improvement of the manuscript.
Funding Information
Support for this project was provided by NASA Goddard Space Flight Center (GSFC) and the NOAA/NESDIS office of Low Earth Observations.
Competing Interests
The authors have no competing interests to declare.
Author Contributions
NCP generated synthetic observations, ran two of the experiment cases, and contributed to writing the manuscript. BMK ran two of the experiment cases and contributed to writing the manuscript. EMS generated the GeoXO observations and contributed to writing the manuscript. SK provided funding and guidance for this project and contributed to writing the manuscript.