
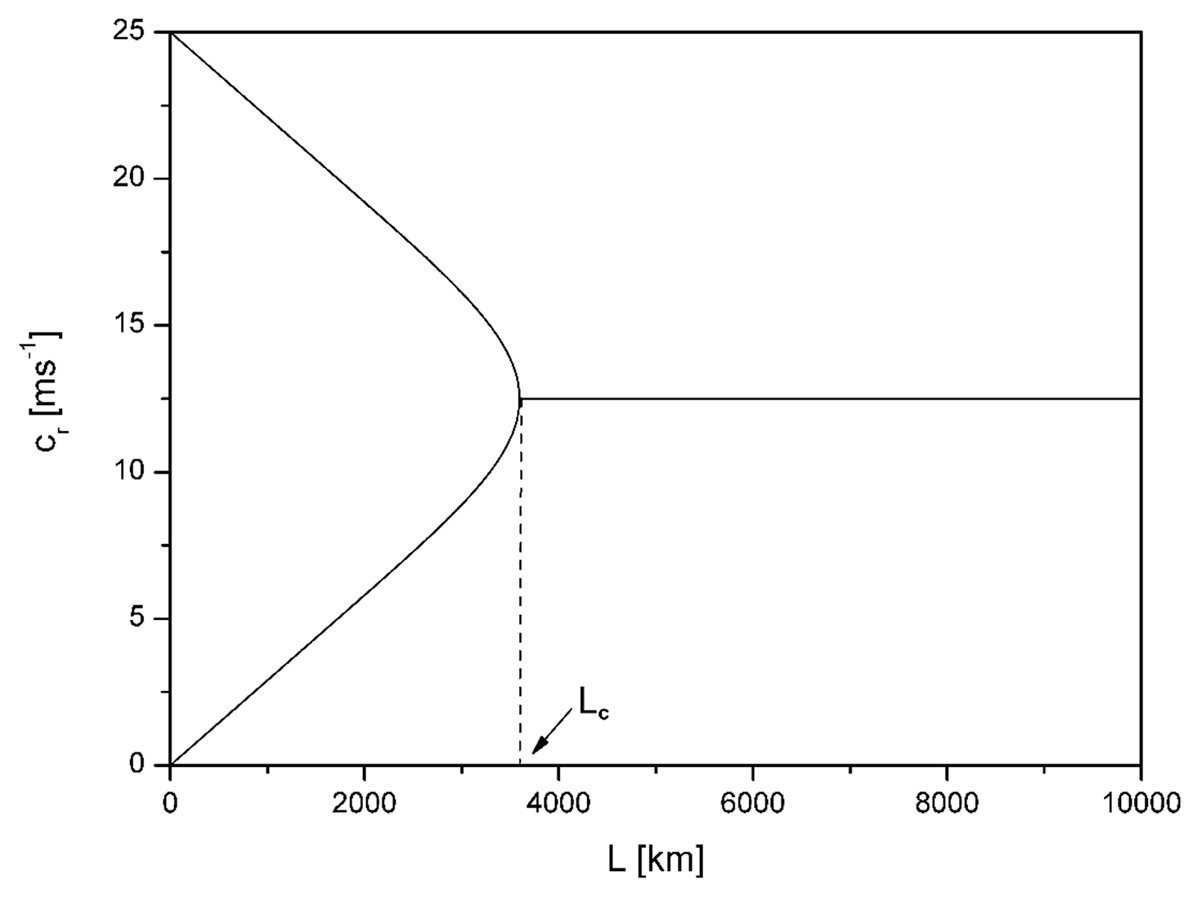
Figure 1
The dependence of the real part of the phase speed cr on the wavelength L of disturbances. Lc denotes the critical wavelength.
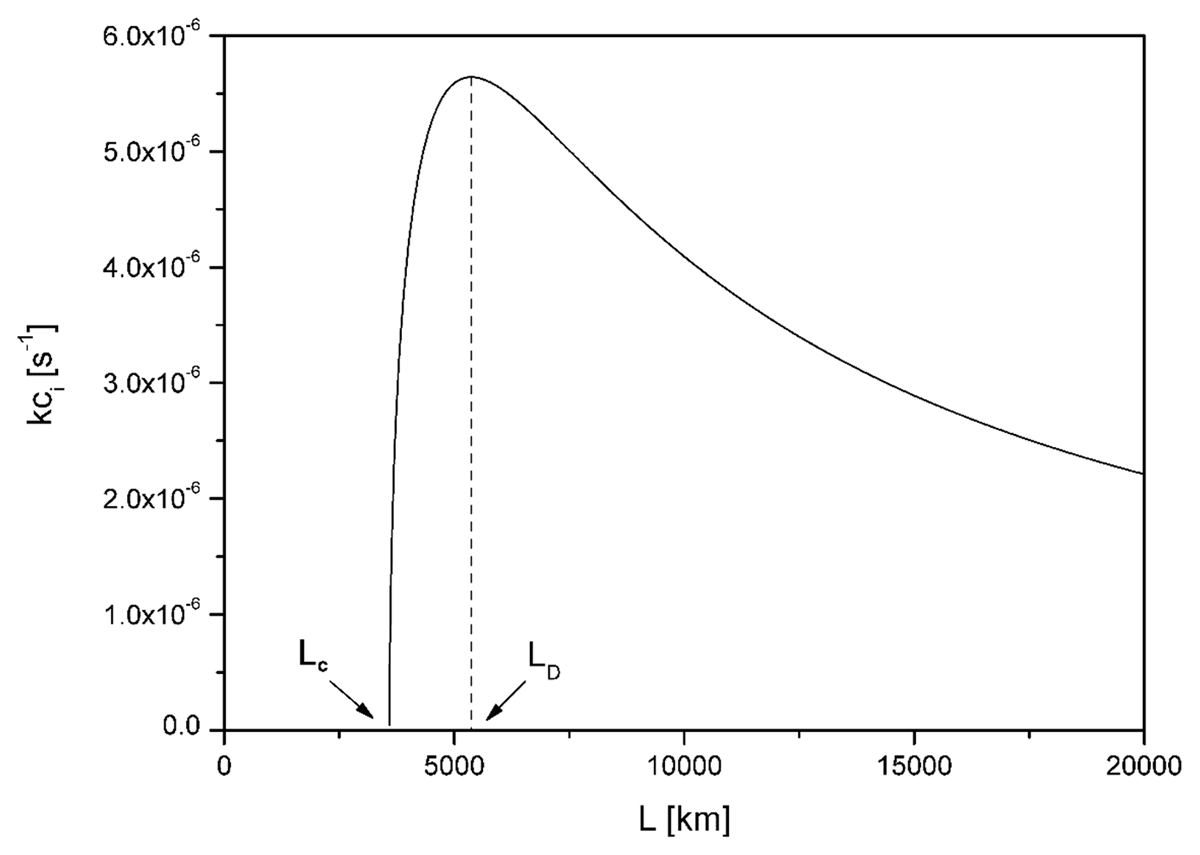
Figure 2
The dependence of the growth rate kci of the perturbations on the wavelength L. LD denotes the wavelength of the dominant perturbation, Lc is the critical wavelength.
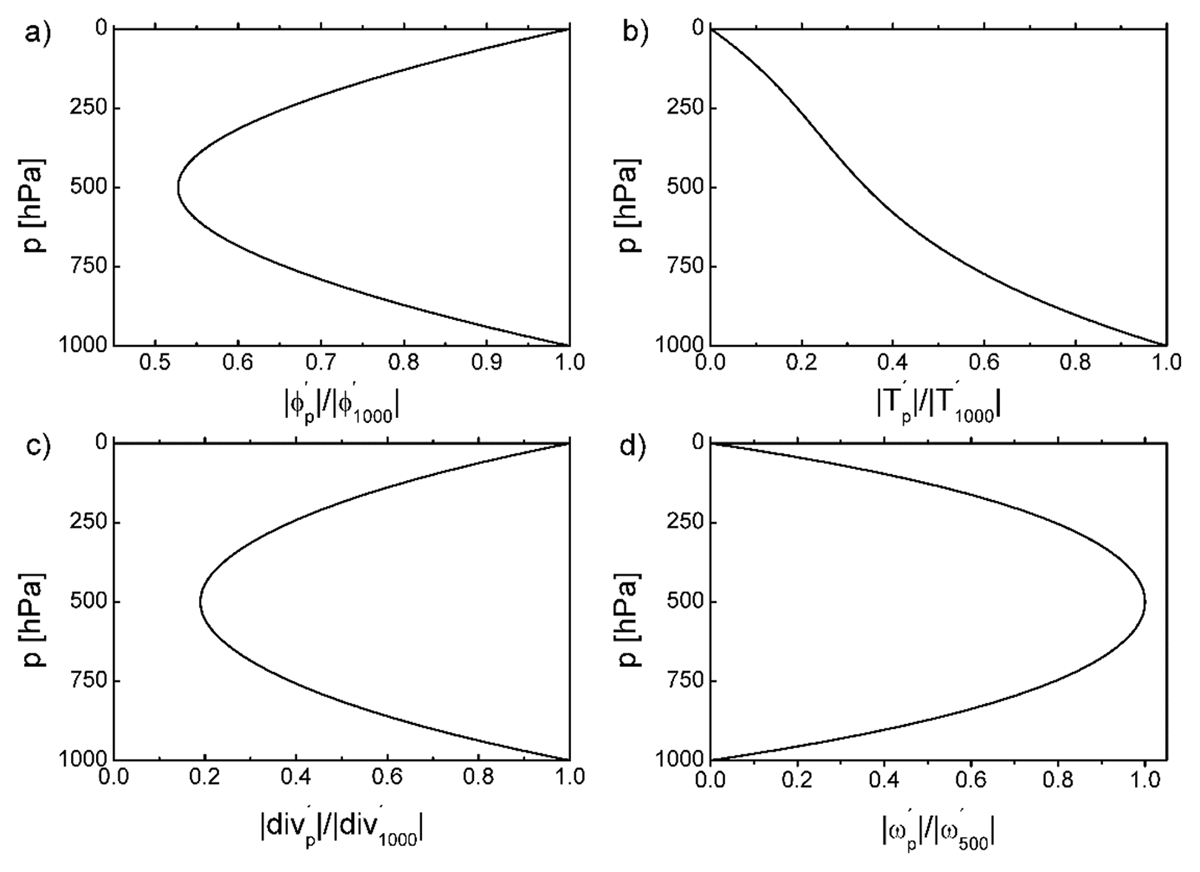
Figure 3
Vertical profile of amplitude of the dominant perturbation in the geopotential (a), temperature (b), isobaric divergence (c), and generalized vertical velocity (d).
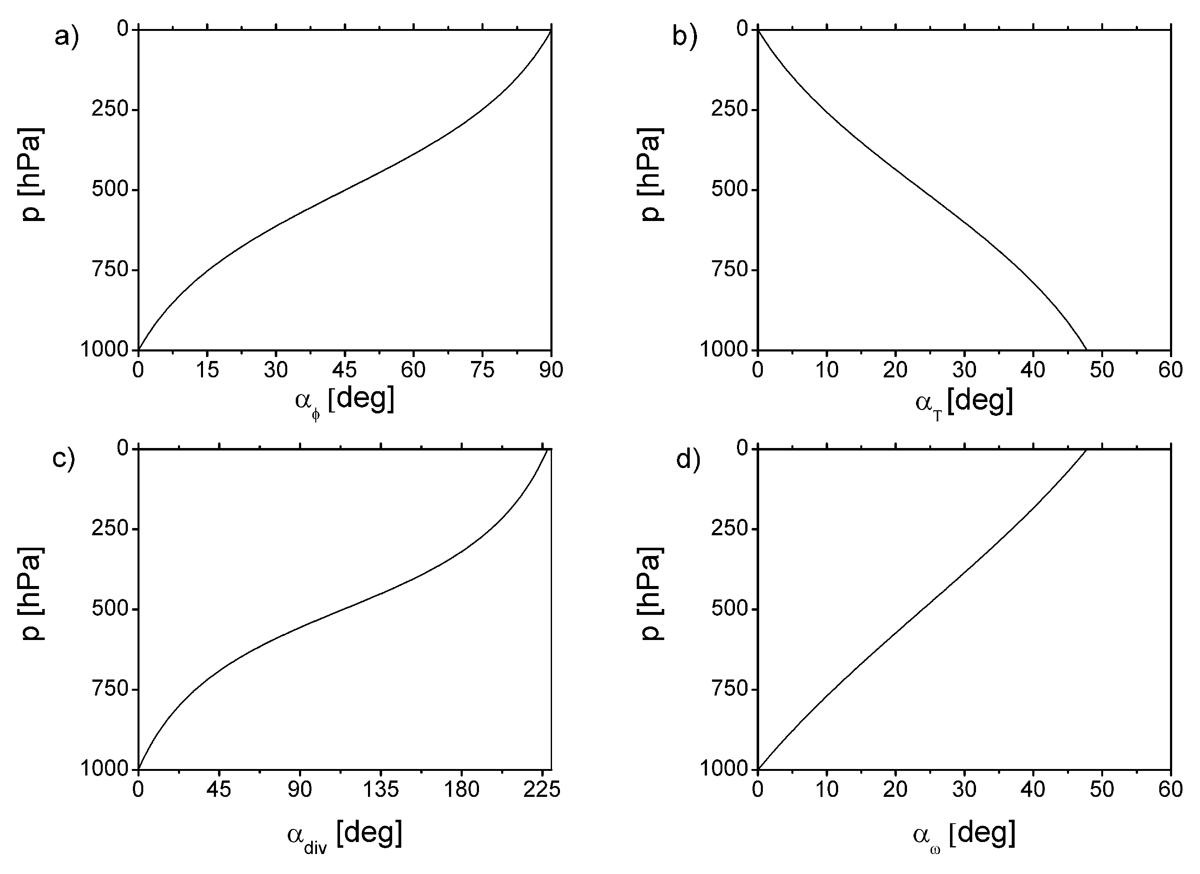
Figure 4
Vertical profile of phase angle of dominant perturbation in the geopotential (a), temperature (b), isobaric divergence (c), and generalized vertical velocity (d).
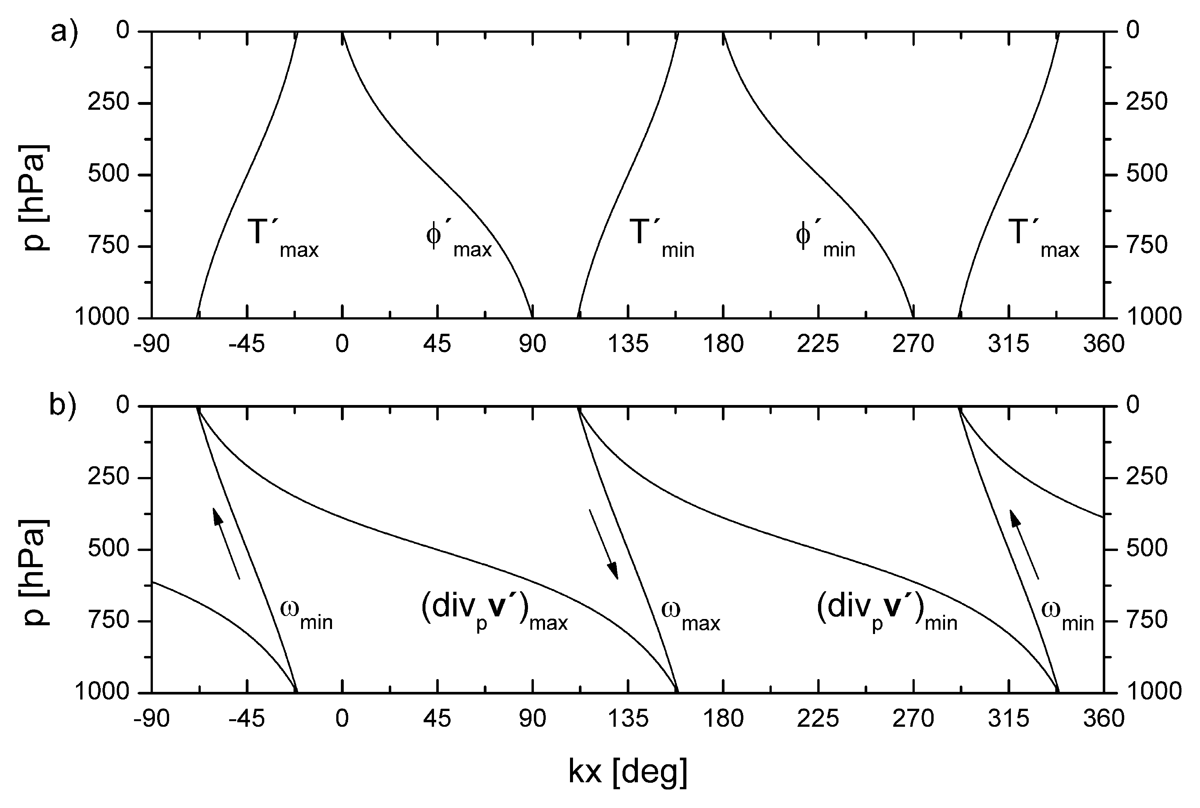
Figure 5
Positions of maxima and minima of the dominant perturbation in the geopotential and temperature fields (a), and isobaric divergence and generalized vertical velocity fields (b).
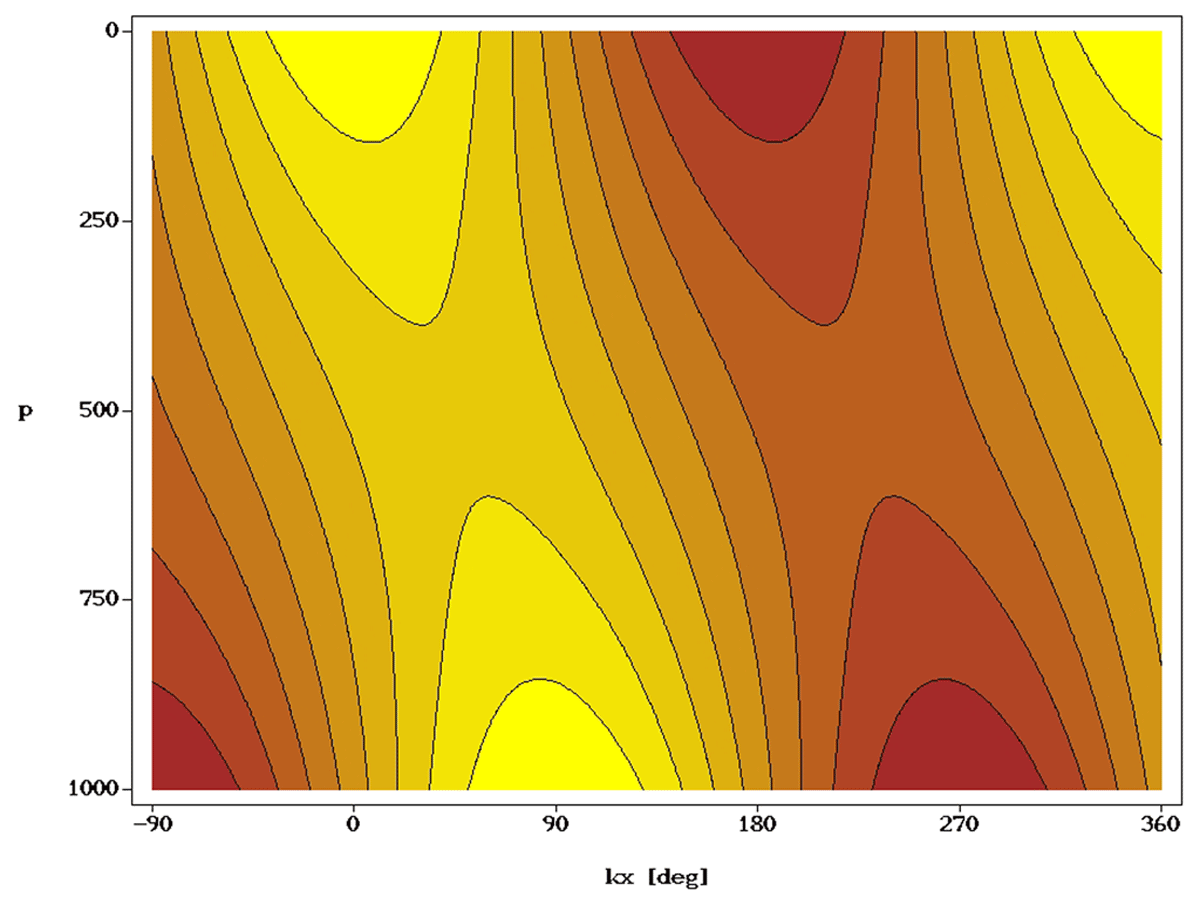
Figure 6
The geopotential field of the dominant perturbation. The high-pressure region is shown in yellow, the low-pressure region in brown.
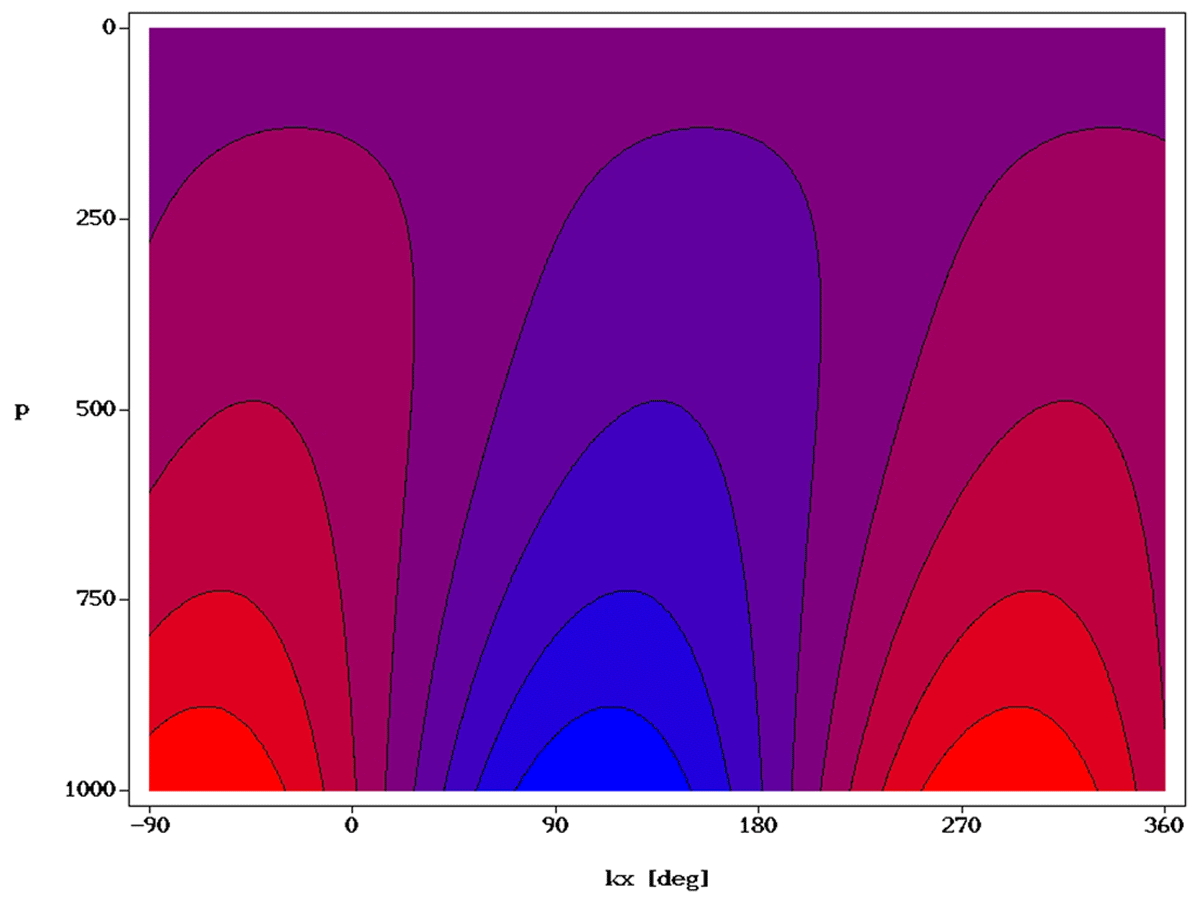
Figure 7
Temperature field of the dominant perturbation. The coldest air region is plotted in blue, the warm air region in red.
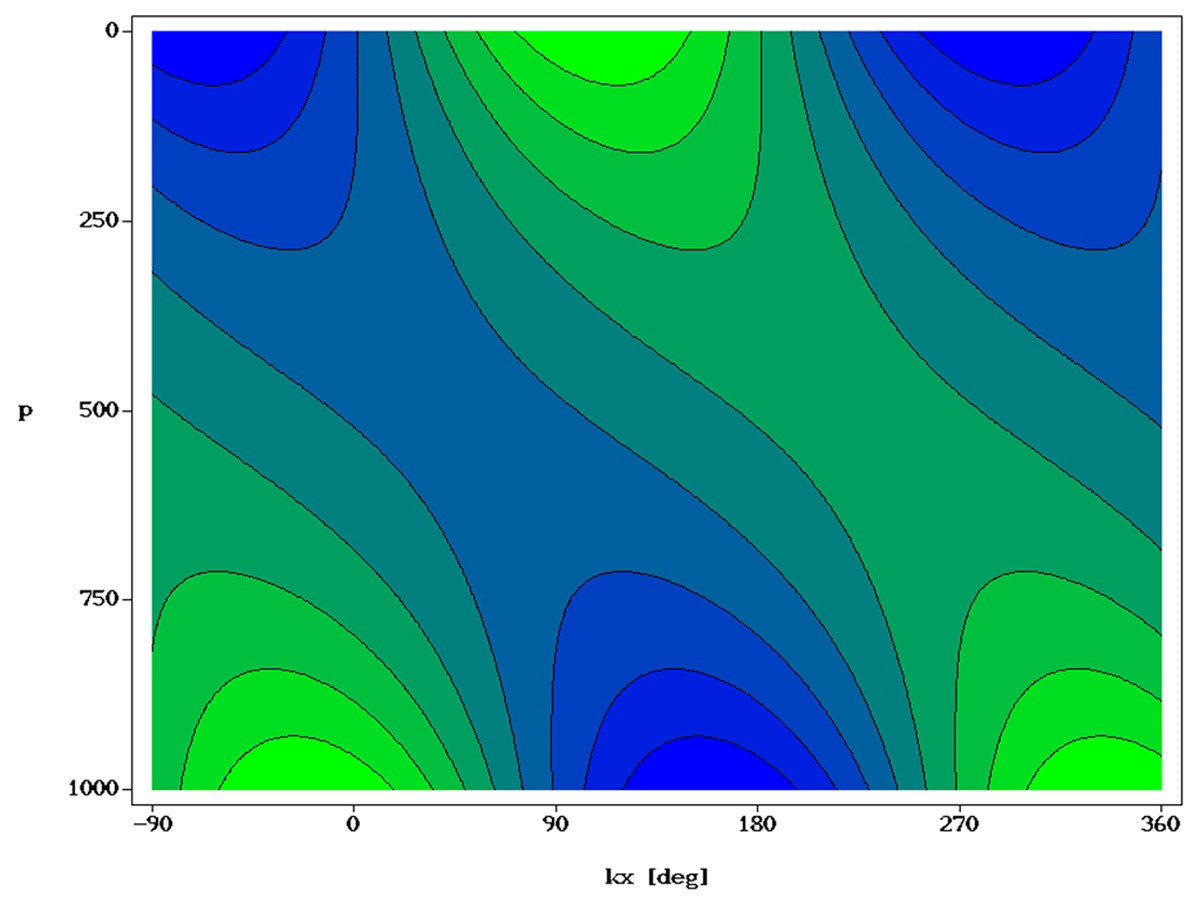
Figure 8
The isobaric divergence field of the dominant perturbation. The region of isobaric divergence is plotted in blue, the region of isobaric convergence in green.
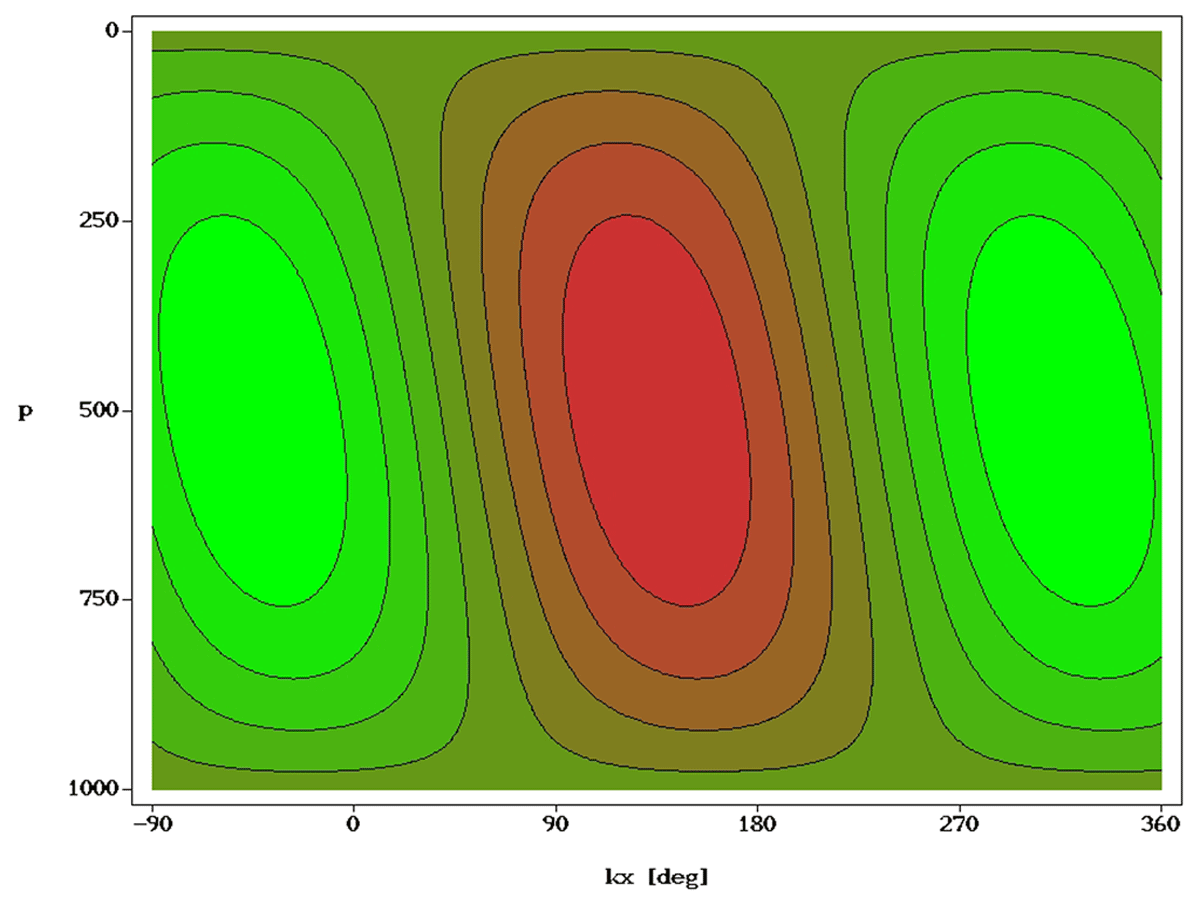
Figure 9
The generalized vertical velocity field of the dominant perturbation. The region of downward motions is plotted in brown, the region of upward motions in green.