
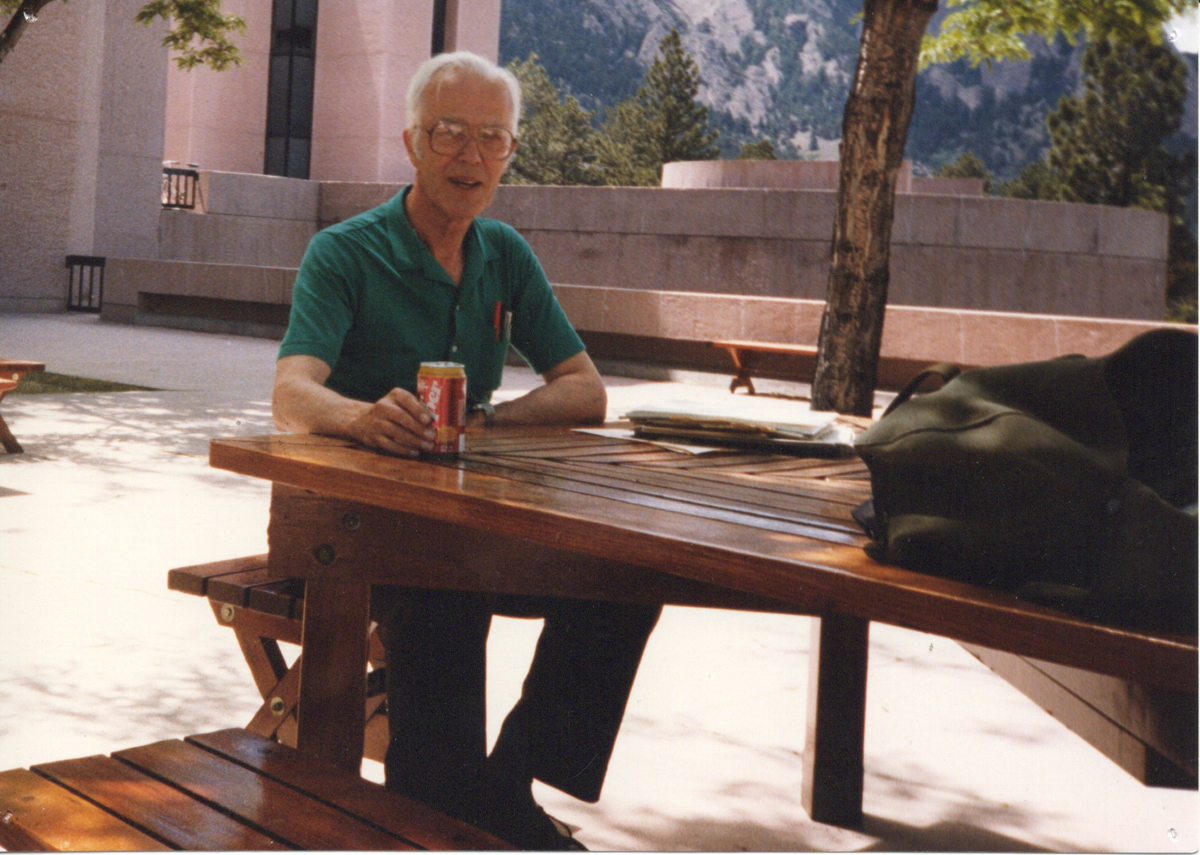
Figure 1
Chester Newton seated on a bench outside NCAR’s Mesa Laboratory.
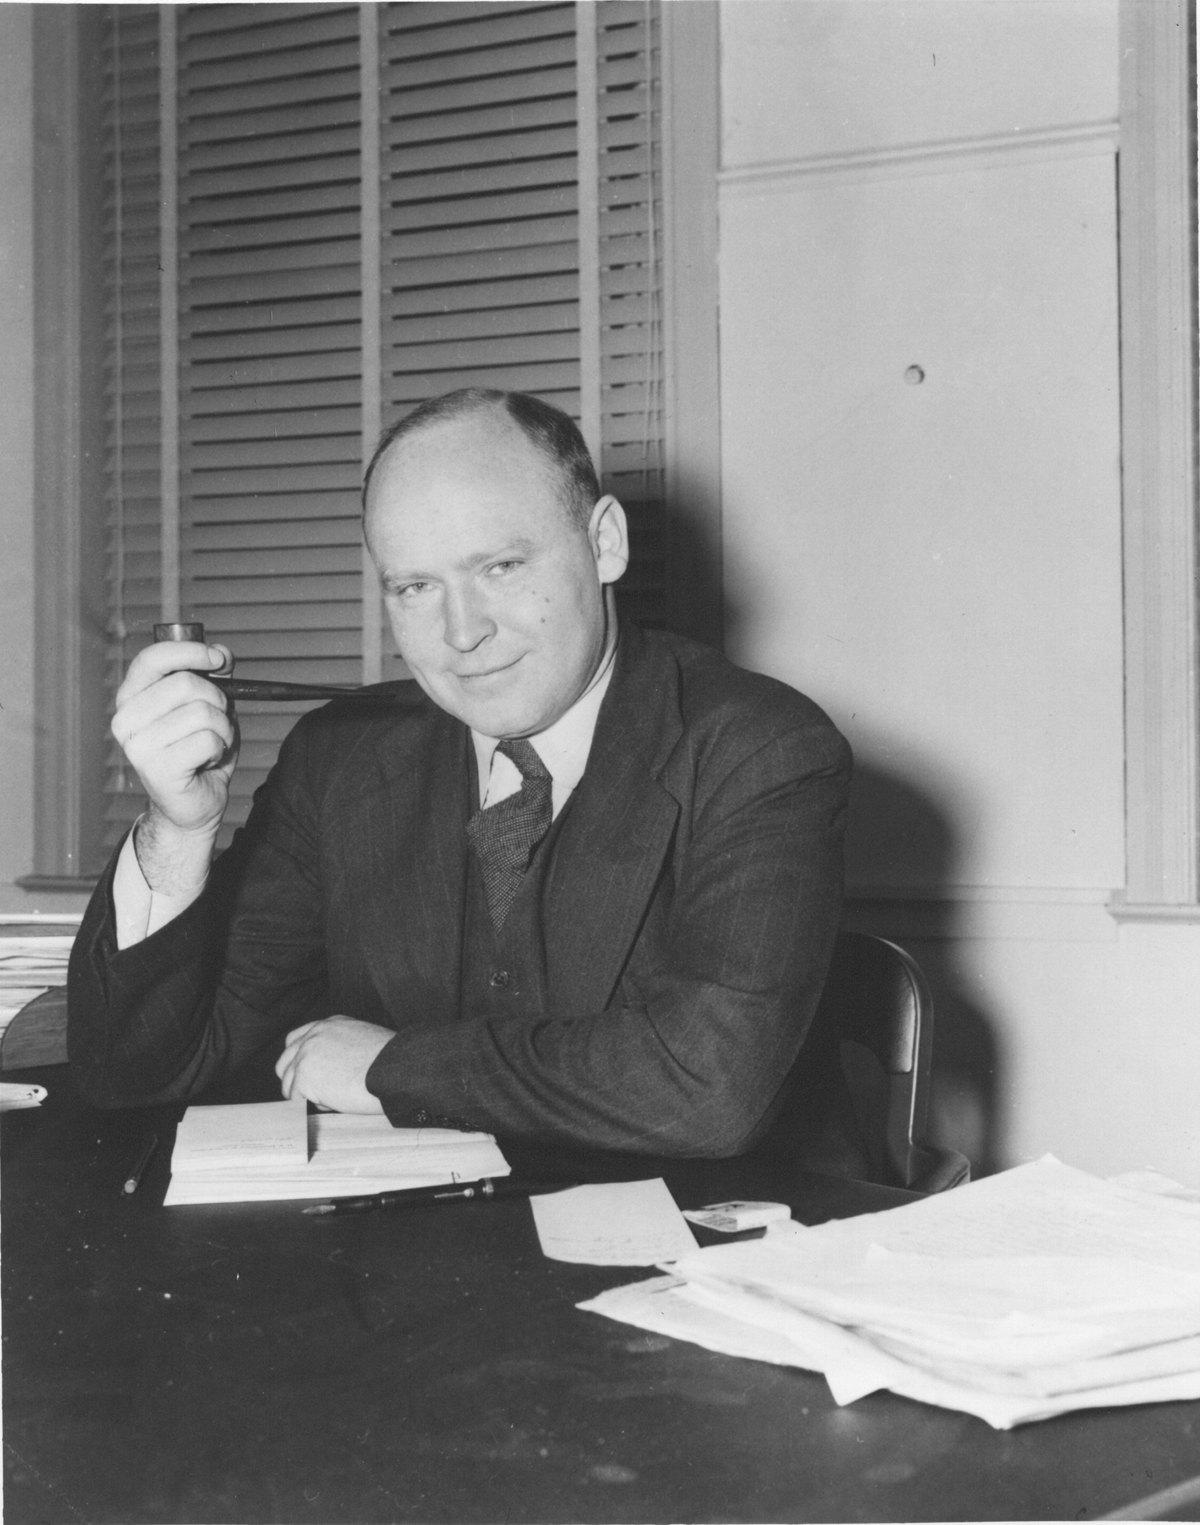
Figure 2
Carl-Gustaf Rossby at his desk in the USWB building (ca. 1939). Reproduced with permission of Library of Congress, Manuscripts Division.
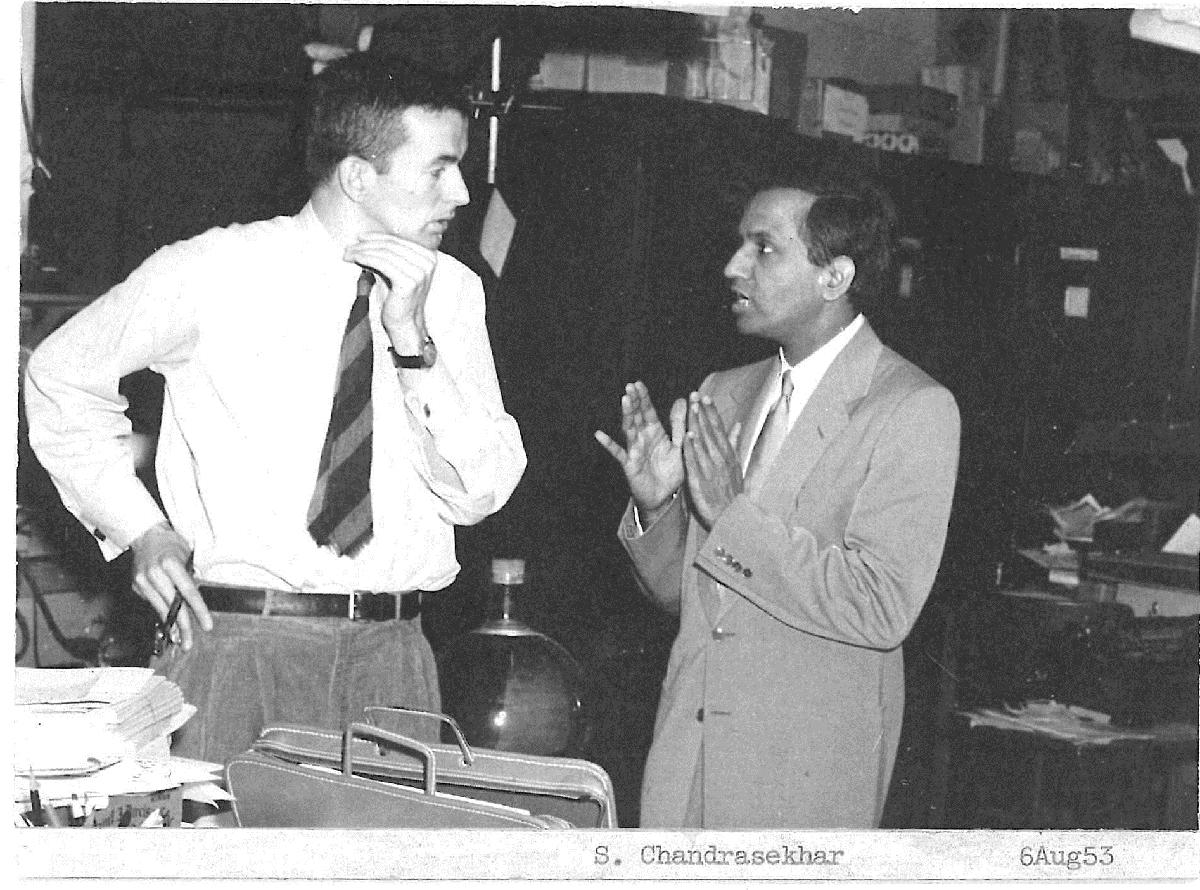
Figure 3
Discussion between Professors Dave Fultz (left) and Subramanyan Chandrasekhar (right) in the Hydrodynamics Lab, the laboratory used for instruction in geophysical fluid dynamics starting in the late-1940. Reproduced with permission courtesy of Dave Fultz.
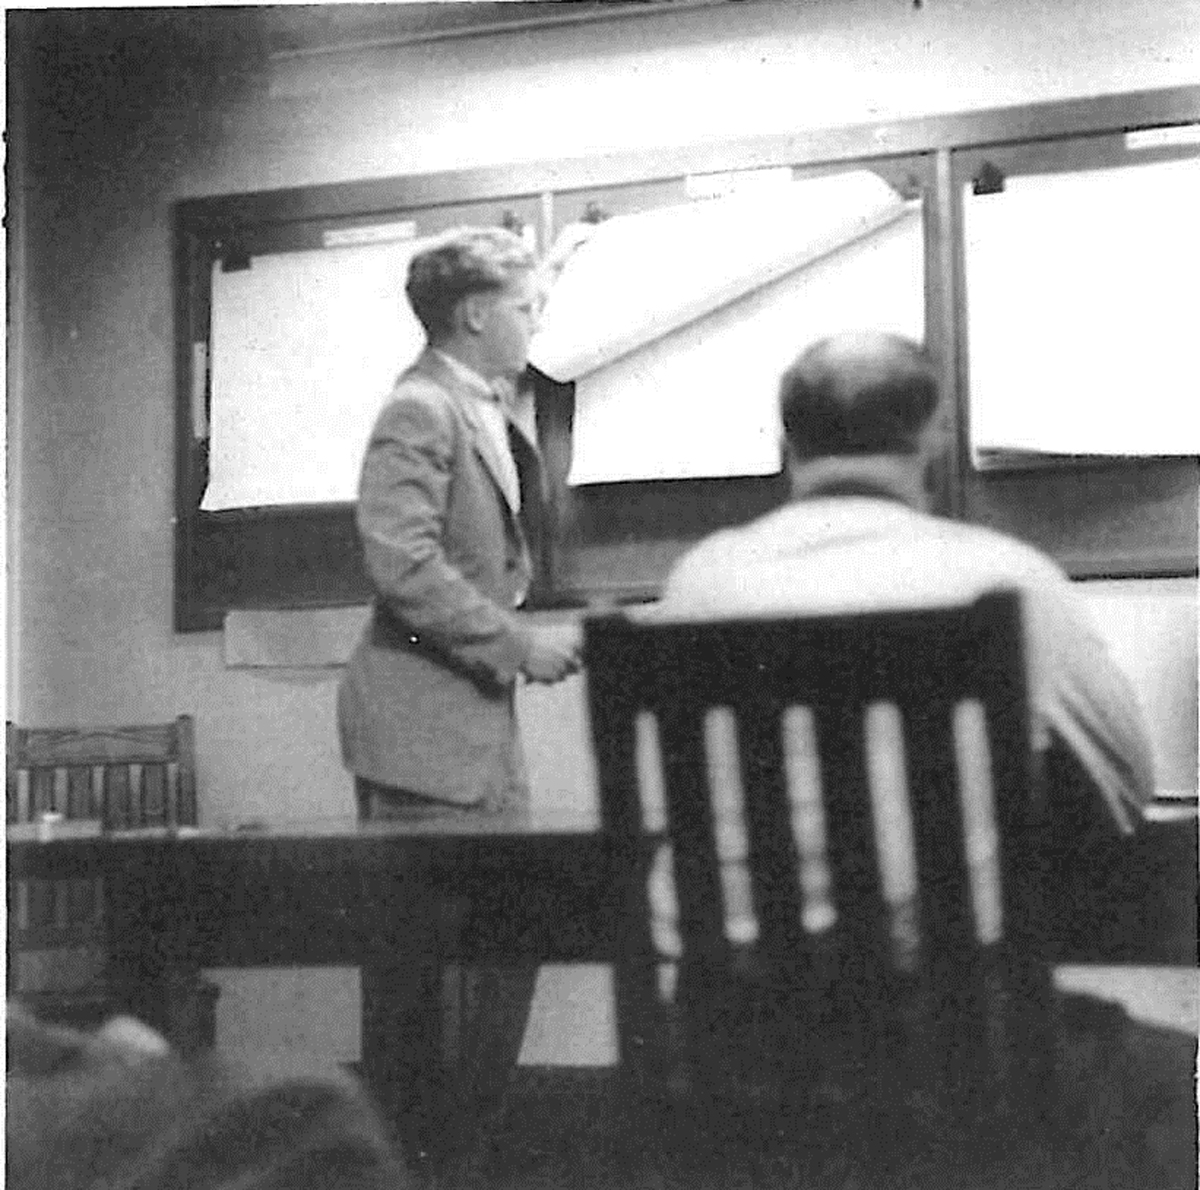
Figure 4
George Cressman leading a map discussion at 5727 University Avenue, Institute of Meteorology, University of Chicago. Seated in the first row (back turned) is Erik Palmén (ca. 1947). Reproduced with permission courtesy of Department of Geophysical Sciences, University of Chicago).
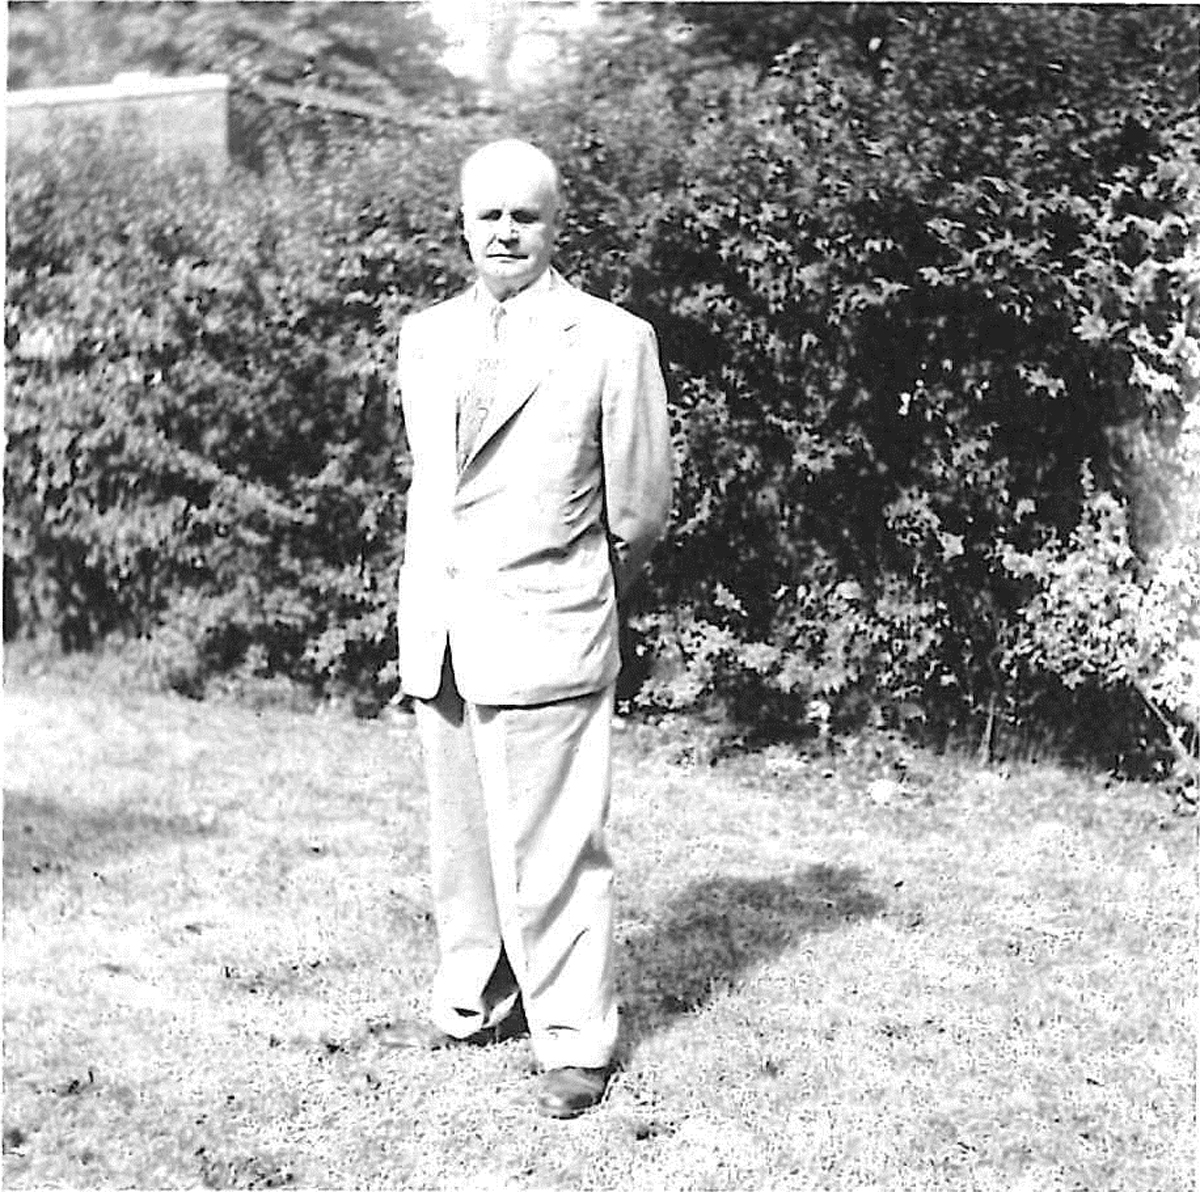
Figure 5
Erik Palmén standing outside the Institute of Meteorology building (ca. 1947). Reproduced with permission courtesy of G. Platzman.
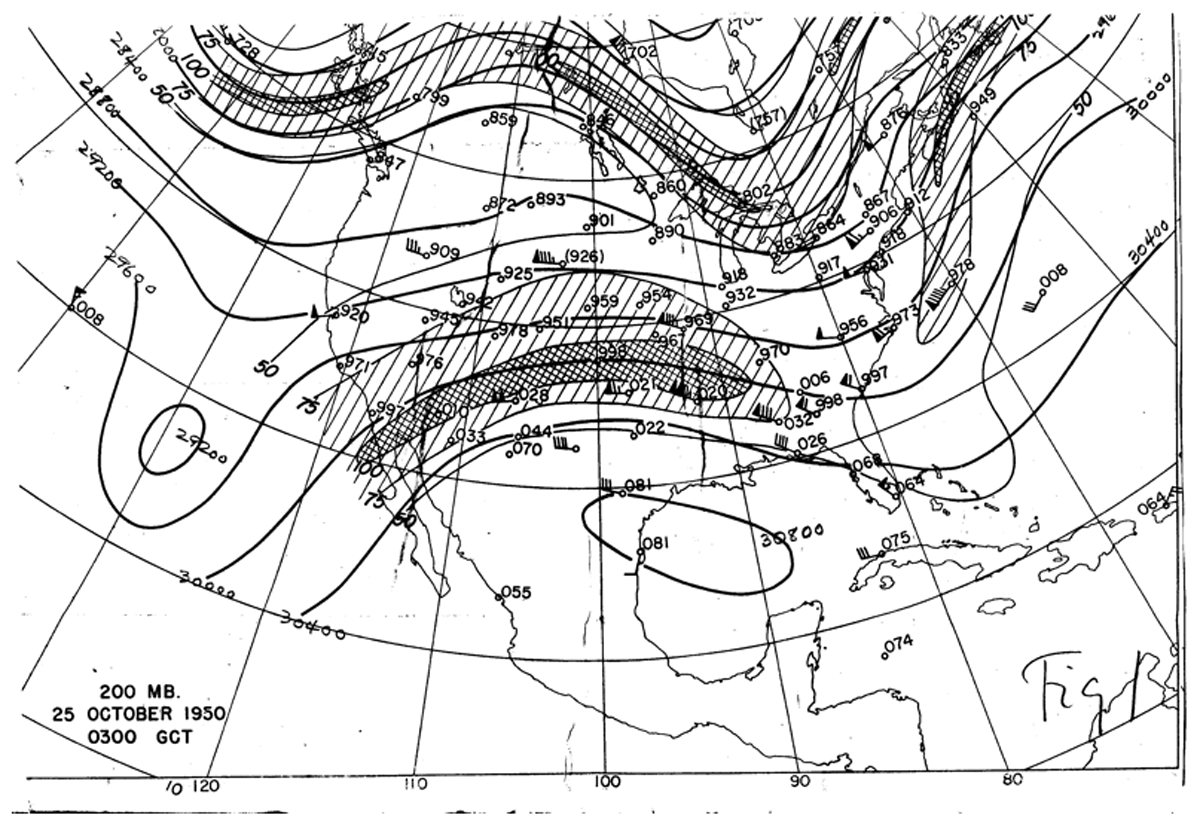
Figure 6
Weather map drawn by Newton at the 200 hPa level on 25 October 1950, 0300 UTC, showing geopotential contours (meters), wind observations (standard flag format), and isotachs (wind speeds). The hatched zones outline winds greater that 100 kt. Rossby’s hand labeled the figure, Figure 1, in the lower right corner. Reproduced with permission courtesy of C. Newton.
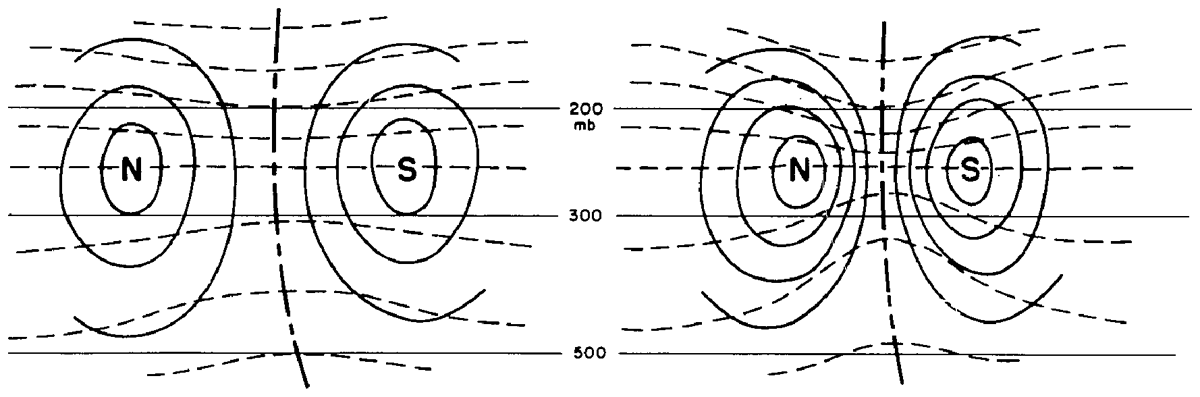
Figure 7
Figure 2 in Newton’s dissertation (Newton, 1951a) showing local changes in the isotach field (solid lines, N: North wind, S: South wind) during formation of a shear line near the tropopause. Dashed lines are isentropes. Reproduced with permission courtesy of University of Chicago Archives).
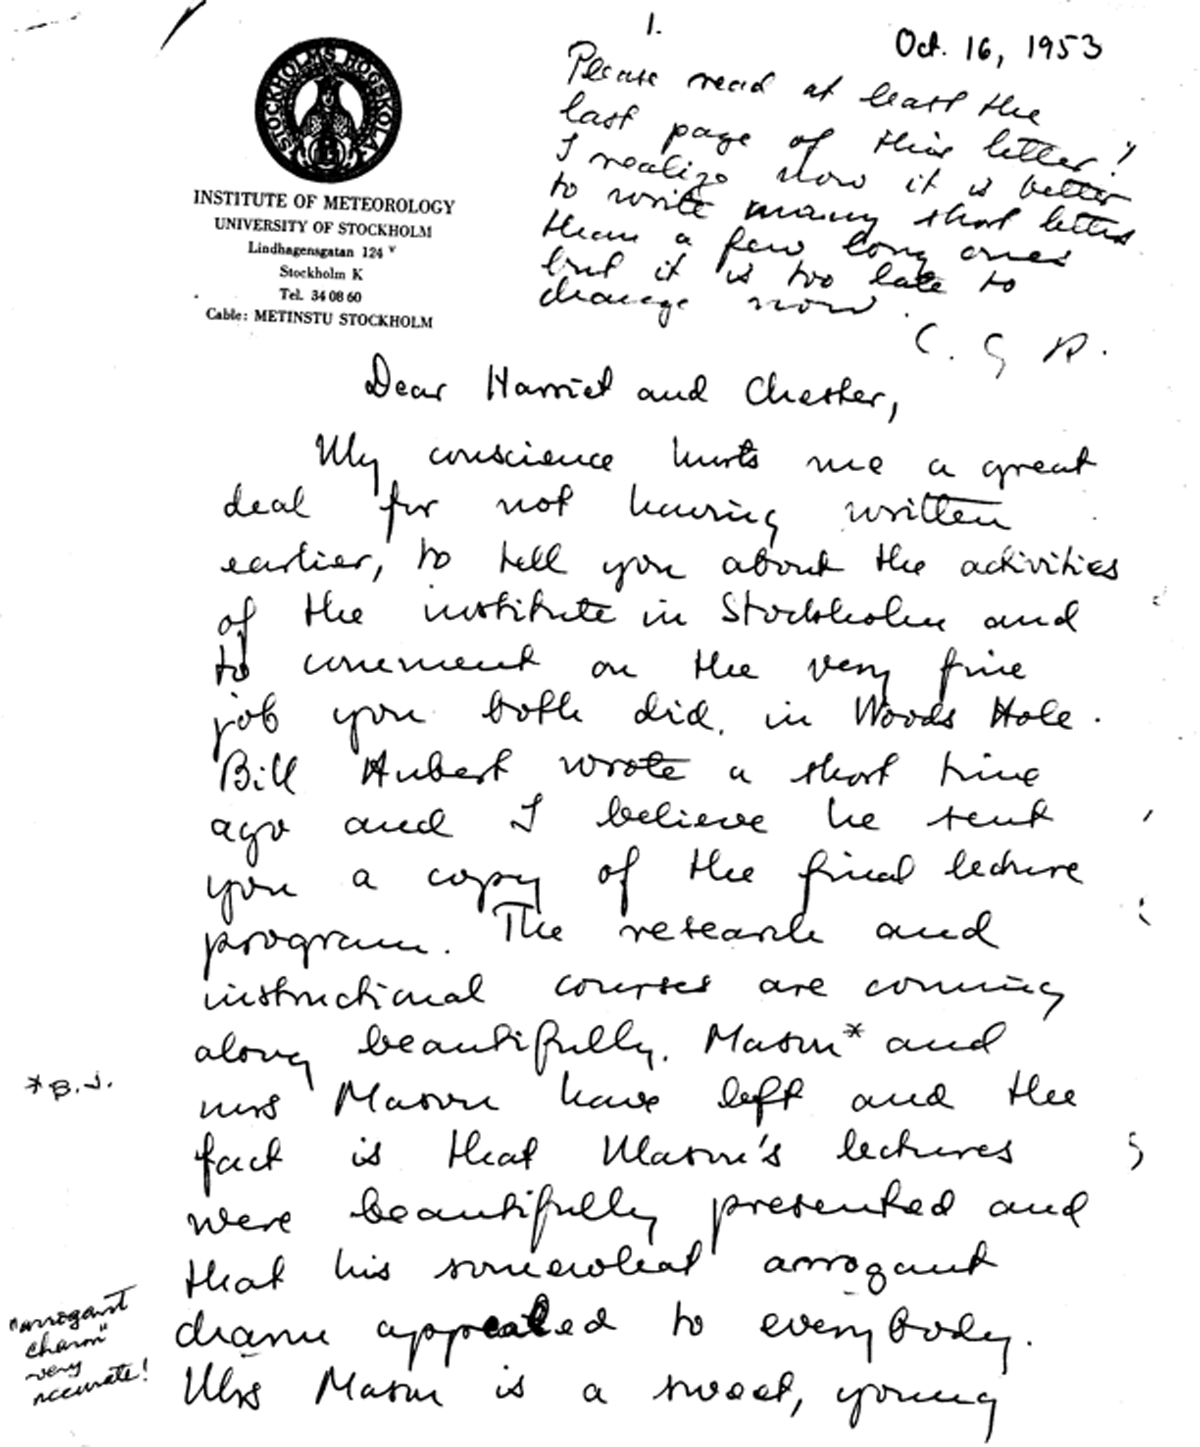
Figure 8
First page of a 10-page hand-written letter from Rossby to Harriet and Chester Newton on October 16, 1953. Reproduced with permission courtesy of C. Newton.
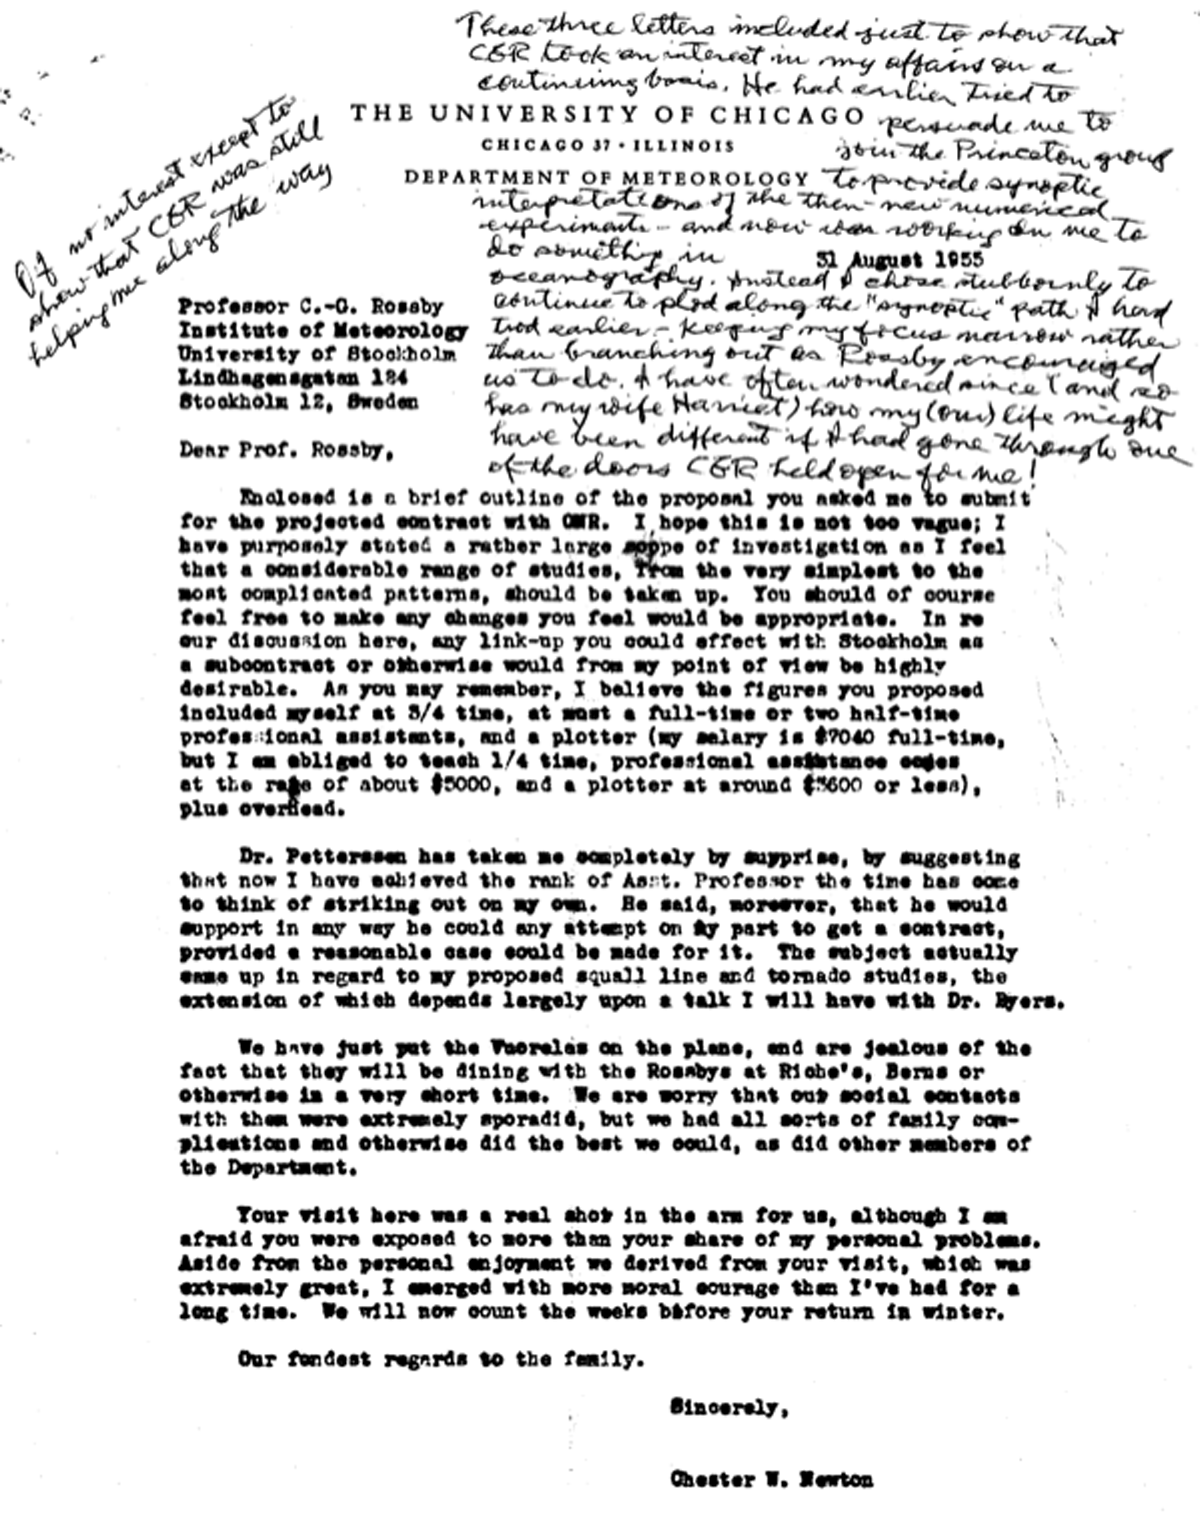
Figure 9
Letter from Newton to Rossby on 31 August 1955. Reproduced with permission courtesy of C. Newton.