
Figure 1
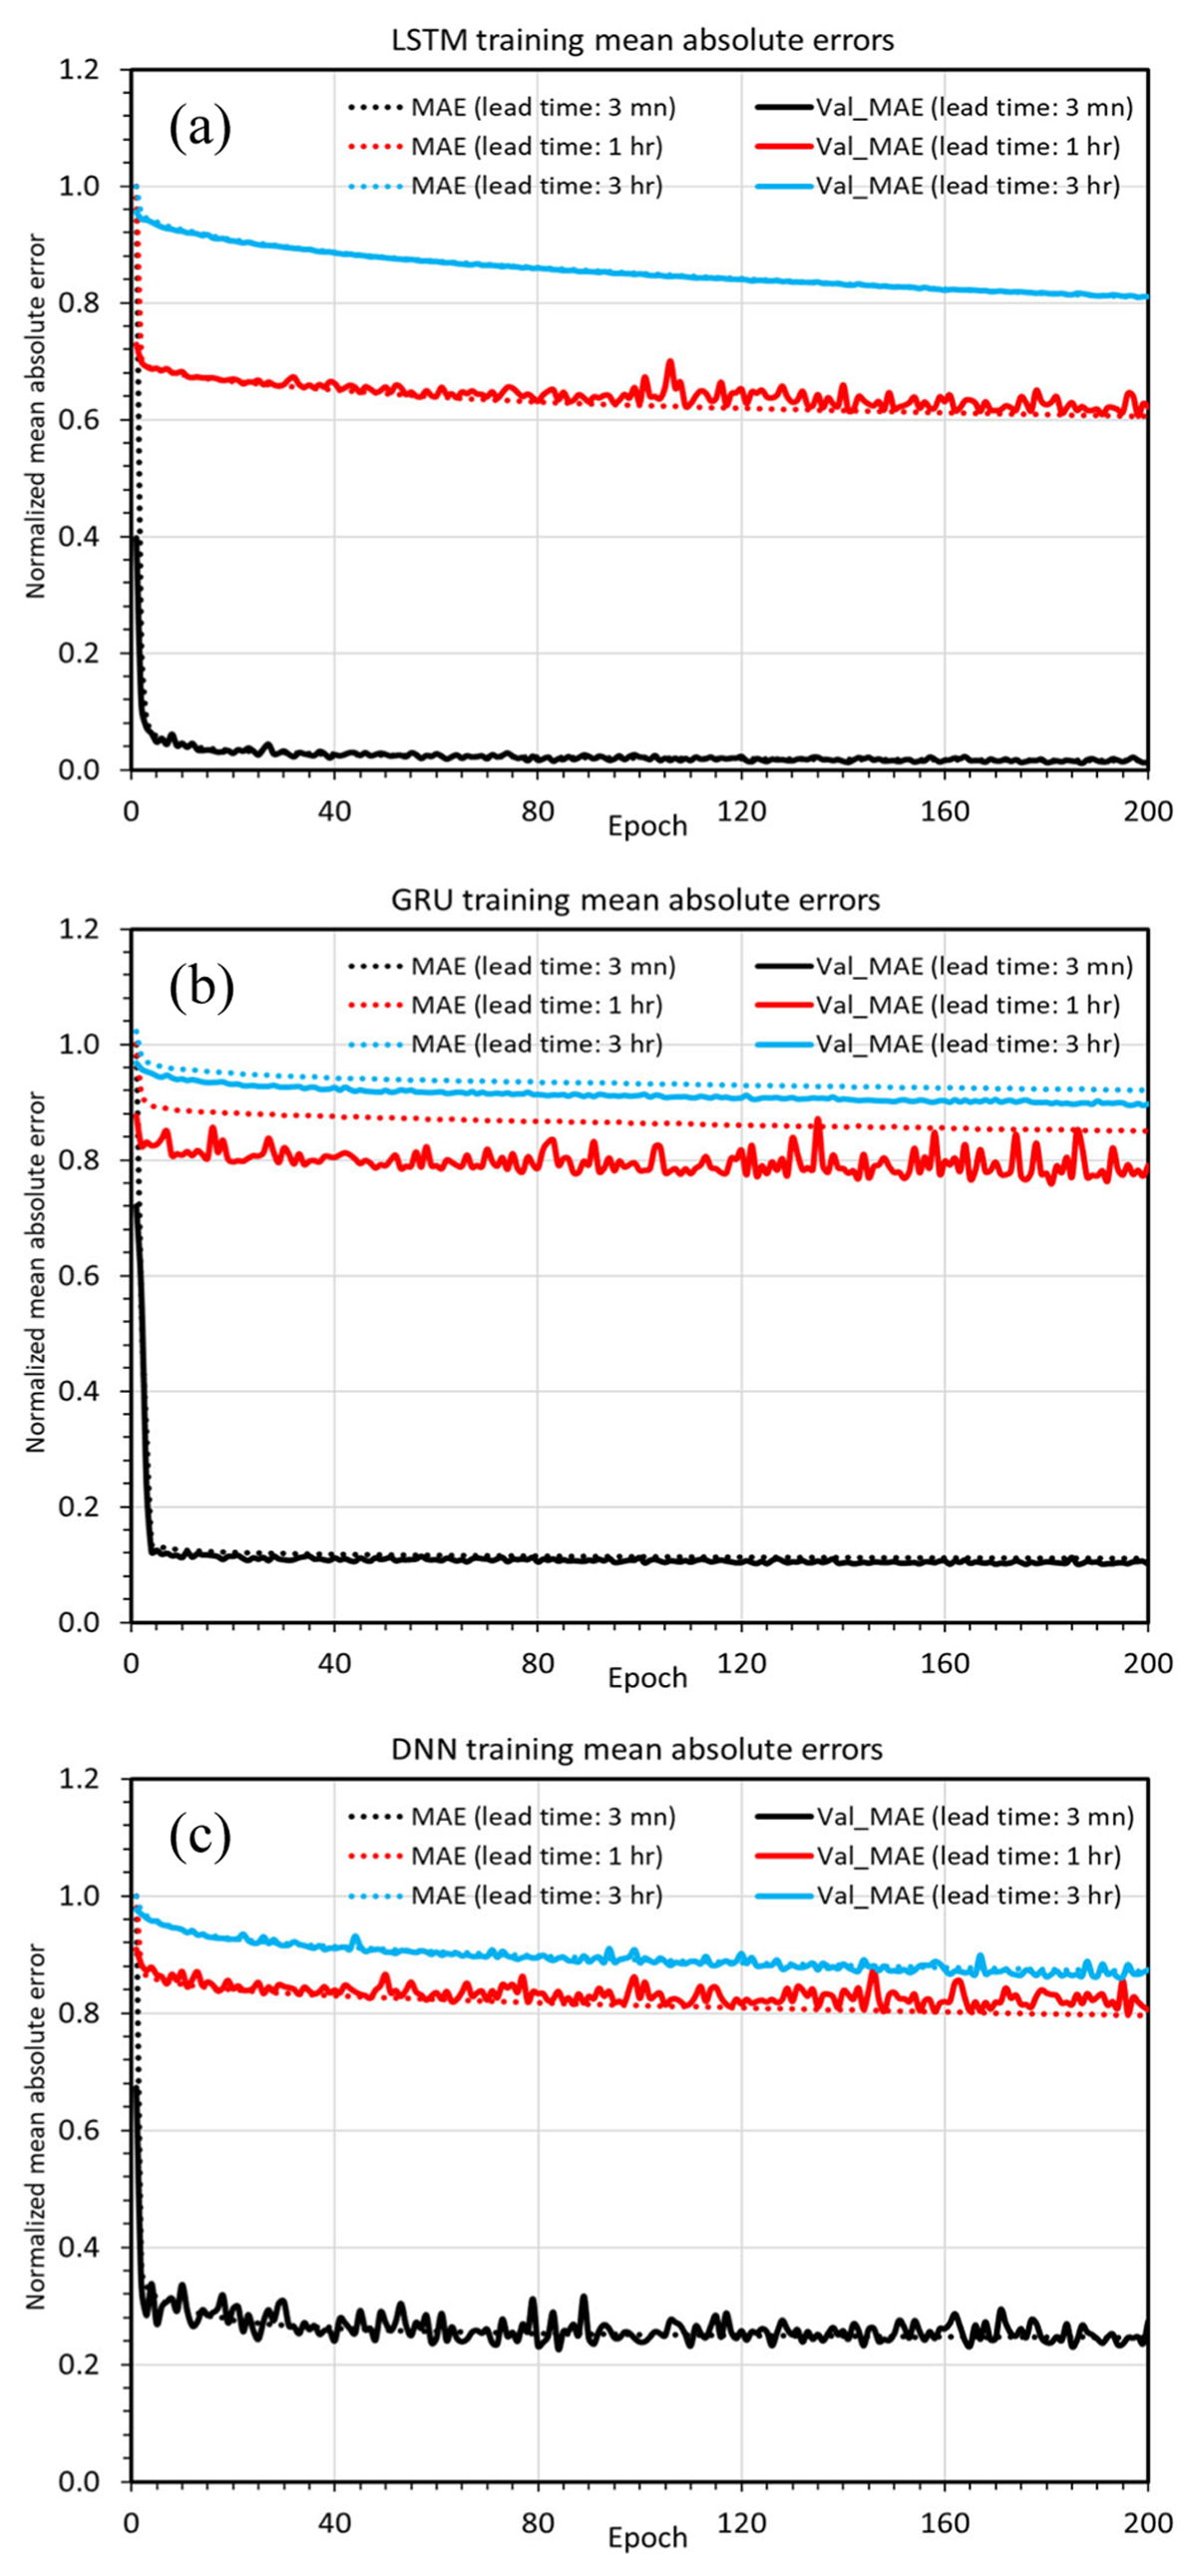
ML accuracy metric based on the mean absolute error (dotted lines) during the training process as a function of iterations (epochs) for three different ML models a) LSTM, b) GRU, and c) DNN at forecast lead times of minutes (black), 1 hour (red), and 3 hours (blue). All absolute errors are normalized by the errors at the first iteration (epoch 1) for better comparison among different lead times. Solid lines denote the mean absolute errors for the corresponding validation dataset in each training process, and the recurrent timesteps M = 5.
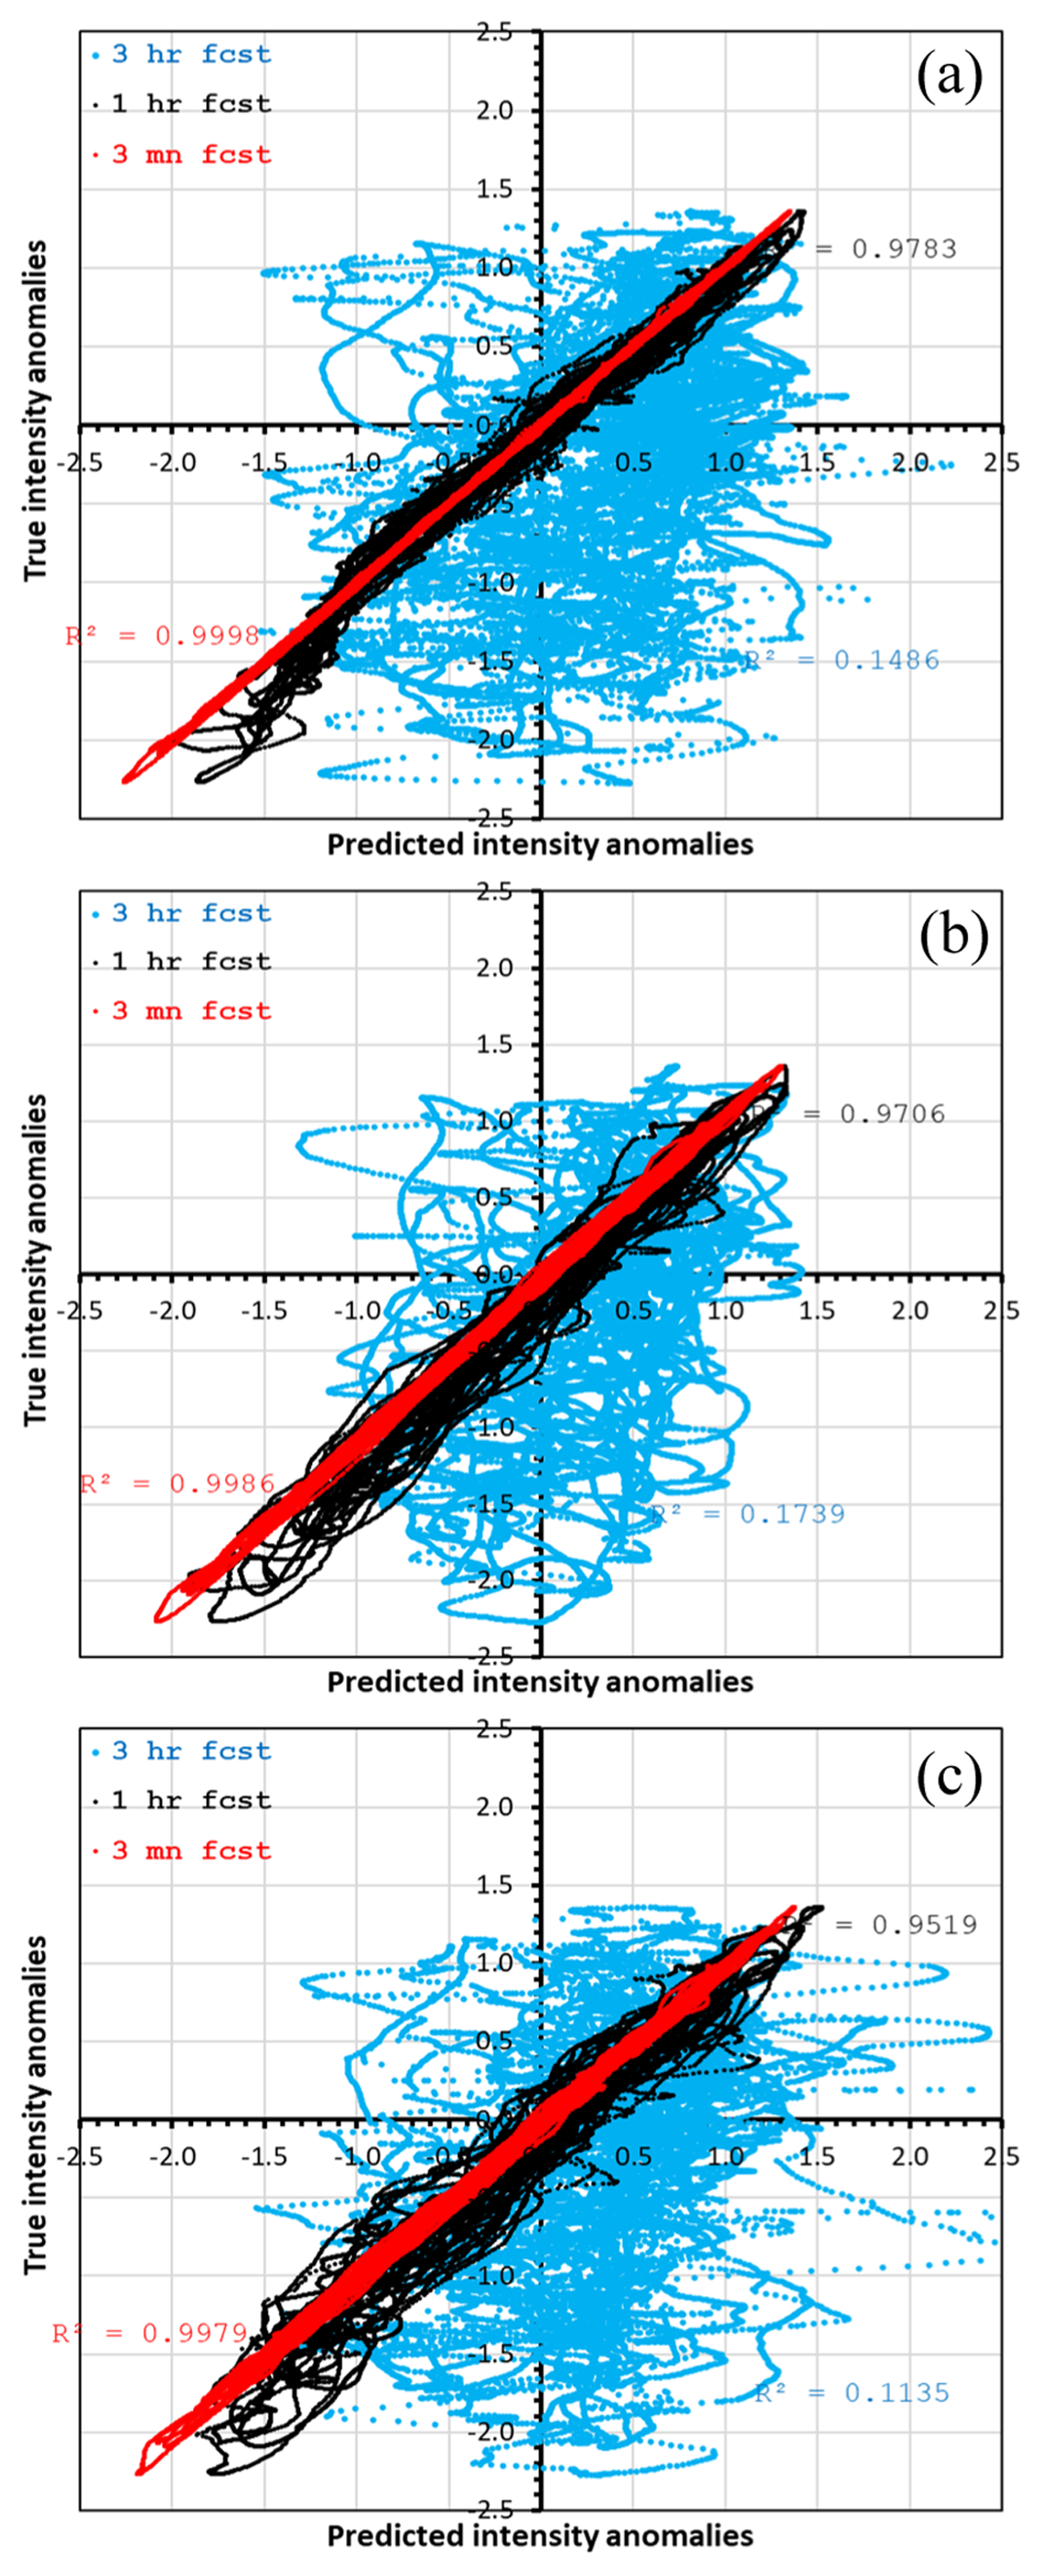
Figure 2
Scatter plots of the ML-predicted TC intensity anomaly (x-axis) and the CM1 true intensity anomaly (y-axis) for a test dataset taken between t = 90–100 days of the CM1 simulation at three lead times: minutes (red), 1 hour (black), and 3 hours (blue) for a) LSTM, b) GRU, and c) DNN model. Note that TC intensity anomaly is relative to the average PI value of 84 ms–1 and normalized by its standard deviation . The R values for each lead time best fit are also provided in each panel.
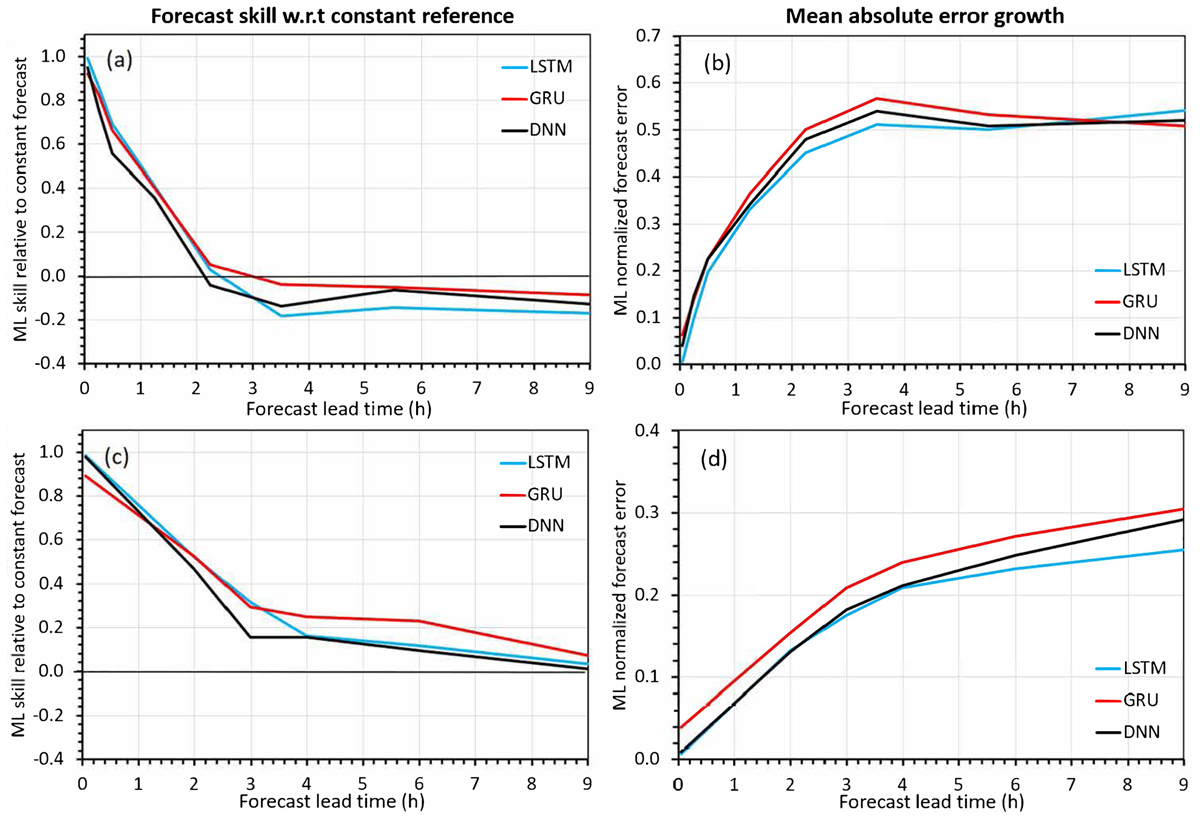
Figure 3
a) Forecast skill of three ML models LSTM (blue), GRU (red) and DNN (black) as a function of lead time relative to the reference forecast that uses the average Vmax value at the PI equilibrium, and (b) similar to (a) but using Pmin for TC intensity. Here, the forecast skill is defined as 1-MAEML/MAEref), where MAEML and MAEref are the mean absolute errors from the ML predictions and reference prediction of TC intensity over the test dataset, respectively.
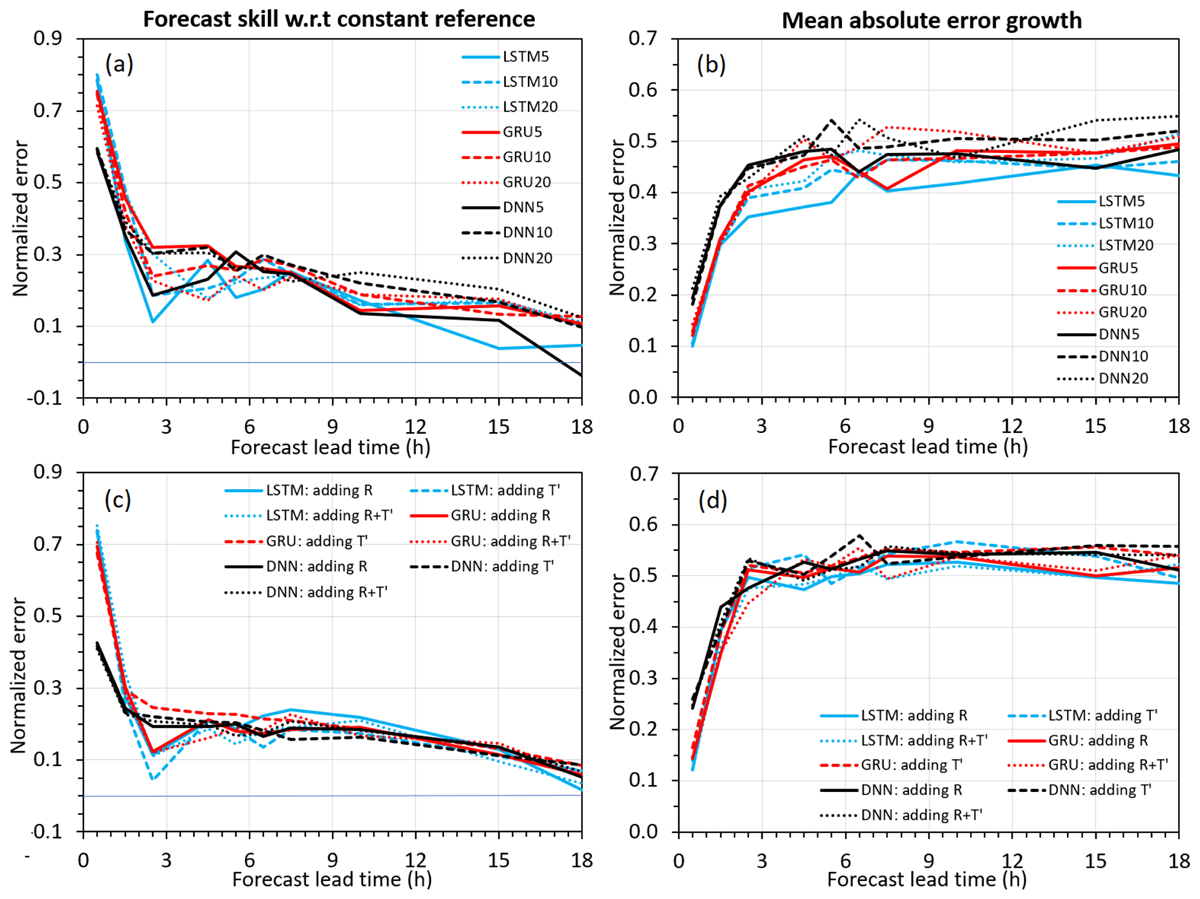
Figure 4
Similar to Figure 3a–3b, but for sensitivity experiments using (a)–(b) different past windows M = 5 (solid), 10 (dashed), and 20 (dotted); and (c)–(d) adding new input features including the radius of maximum wind (R) and the warm core anomaly (T’).